
Cuba has the lowest infant mortality rate in Latin America, while Chile has an infant mortality rate above the average of the Organisation for Economic Co-operation and Development (OECD) countries.
ObjectiveTo compare the epidemiology of infant mortality between Chile and Cuba in order to find characteristics that may explain the differences found.
MethodComparative analysis between Chile and Cuba of infant mortality rate, causes of mortality, live birth weight, and maternal age, in 2015.
ResultsCuba had a lower infant, neonatal, early and late mortality than Chile, with no differences in post-neonatal mortality. Chile had a higher infant mortality due to, alterations of the nervous system, urinary system, chromosomal alterations, respiratory distress syndrome, and disorders related to the short duration of gestation. Chile had a higher frequency of mothers ≥35 years old and live births weighing ≤2.500 g. The possible effects of health inequities could not be analysed due to lack of data.
ConclusionsIt is possible to attribute the lower infant mortality rate in Cuba to: selective abortion due to congenital malformations and chromosomal anomalies, lower epidemiological risk of the Cuban pregnant population, and lower frequency of live births with low birth weight.
Cuba presenta la tasa de mortalidad infantil más baja de Latinoamérica, mientras que Chile presenta una tasa de mortalidad infantil sobre el promedio de países de la OECD.
ObjetivoComparar la epidemiología de la mortalidad infantil entre Chile y Cuba para detectar características que puedan explicar las diferencias encontradas.
MétodoAnálisis comparativo entre Chile y Cuba de la mortalidad infantil, causas de mortalidad, peso del nacido vivo y edad materna, en el año 2015.
ResultadosCuba presentó menor mortalidad infantil, neonatal precoz y tardía que Chile, sin diferencia en mortalidad posneonatal. Chile presentó una mayor mortalidad infantil por alteraciones del sistema nervioso, sistema urinario, alteraciones cromosómicas, síndrome de dificultad respiratoria y trastornos relacionados con la duración corta de la gestación. Chile presentó mayor frecuencia de madres ≥35 años y nacidos vivos con peso ≤2.500 g. No se analizó los posibles efectos de las inequidades en salud por ausencia de datos.
ConclusionesEs posible atribuir la menor mortalidad infantil de Cuba a: 1° aborto selectivo por malformaciones congénitas y anomalías cromosómicas, 2° menor riesgo epidemiológico de la población de embarazadas cubanas, 3° menor frecuencia de nacidos vivos con bajo peso al nacer.
Infant mortality is a powerful statistic indicative of the social, economic and cultural conditions and the characteristics of the health system of a country. Thus, the worst infant mortality rates are found in developing countries.1
Infant mortality is frequently used to establish international rankings by organizations such as the United Nations Children's Fund (UNICEF),1 the Organisation for Economic Co-operation and Development (OECD)2 or the World Bank3 with the aim of improving comprehensive child health.
One of the main challenges in the assessment of infant mortality is that many countries do not have adequate records of live births with birth weights of less than 500 g or before 23 weeks’ gestation, which is a source of bias in the calculation of perinatal indicators4–7 and therefore renders the validity of the international rankings questionable. The underreporting of mortality associated with live births with birth weights of less than 500 g is demonstrated by the differences in the statistics of countries with similar epidemiological circumstances, such as Belgium, in which the documented frequency of live birth with birth weights of less than 500 g is 1 per 10 000 live births, much lower compared to the 16.9 per 10 000 live births documented in the United States.8 Such underreporting explains the substantial variability in the neonatal mortality attributed to this subset of live newborns (for example, 1% in Luxemburg, 29.6% in Canada and 31.1% in the United States).8
Since April 2003, Chile registers all still births and live births independently of birth weight and gestational age and includes them in the calculation of perinatal and infant survival,9 whereas Cuba does not register live births with weights of less than 500 g in the estimates of infant mortality and its components.10
Cuba is the country with the lowest infant mortality in Latin America.11 With its comprehensive care policies in women and child health, this country has become a regional reference for other countries aiming to improve child health indicators. Chile ranks 34th place with the highest infant mortality among the OECD member countries (7.0/1000 live births) and above the average (3.8/1000 live births) in the 2011–2013 period.2
One of the public health policies in Cuba that has contributed indirectly to a reduction in infant mortality is the prenatal screening of chromosomal disorders and congenital malformations combined with the legal option of voluntary termination of pregnancy.12 A previous study by our research group that compared infant mortality in Chile and Cuba in 2008 suggested that termination of pregnancy due to foetal abnormalities could explain the lower infant mortality in Cuba that year.13
Between 1990 and September 2017, Chilean law did not permit abortion under any circumstances.14 From the latter date, voluntary termination of pregnancy became legal on three grounds,15 the second being the presence of foetal anomalies incompatible with life. The impact of this change in law on infant mortality in Chile is still unknown.
The aim of our study was to compare the epidemiology of infant mortality in Chile and Cuba to identify characteristics that may explain the differences observed in this indicator.
Material and methodsWe conducted a comparative analysis of infant mortality (IM, defined as death before age 1 year) in Chile and Cuba in 2015, including the components of IM: early neonatal mortality (<7 days post birth), late neonatal mortality (7−27 days post birth) and postneonatal mortality (28 days-11 months post birth). We collected data for the following variables in live births: birth weight, maternal age stratified in 5-year bands, and the main causes of infant death. We retrieved raw data from official vital statistics and demographic records in Cuba10 and the Vital Statistics Yearbook (Anuario de Estadísticas Vitales) of Chile for year 2015.16 We have expressed IM and its components as cases per 1000 live births, and the results of the causes of death as cases per 10 000 live births. We estimated the relative risk of different indicators by means of odds ratios (ORs) with the corresponding 95% confidence intervals (CIs),17 where Chile was the index group and Cuba the reference group. We defined statistical significance as a P-value of less than .05.
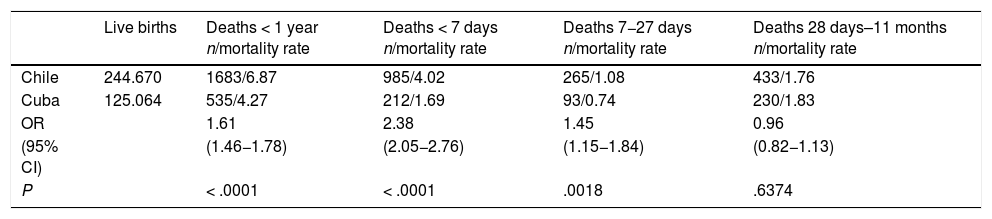
ResultsIn 2015, Chile recorded 244 670 live births and Cuba 125 064 live births. The IM was higher in Chile (OR, 1.61; 95% CI, 1.46−1.78), with a higher early neonatal mortality (OR, 2.38; 95% CI, 2.05−2.76) and late neonatal mortality (OR, 1.45; 95% CI, 1.15−1.84) compared to Cuba and no difference in postneonatal mortality (OR, 0.96; 95% CI, 0.82−1.13) (Table 1).
Comparison of infant mortality and its components in Chile and Cuba, 2015.
| Live births | Deaths < 1 year n/mortality rate | Deaths < 7 days n/mortality rate | Deaths 7−27 days n/mortality rate | Deaths 28 days–11 months n/mortality rate | |
|---|---|---|---|---|---|
| Chile | 244.670 | 1683/6.87 | 985/4.02 | 265/1.08 | 433/1.76 |
| Cuba | 125.064 | 535/4.27 | 212/1.69 | 93/0.74 | 230/1.83 |
| OR | 1.61 | 2.38 | 1.45 | 0.96 | |
| (95% CI) | (1.46−1.78) | (2.05−2.76) | (1.15−1.84) | (0.82−1.13) | |
| P | < .0001 | < .0001 | .0018 | .6374 |
Mortality expressed as deaths per 1000 live births. Infant mortality (< 1 year) in Chile includes newborns with birth weights < 500 g.
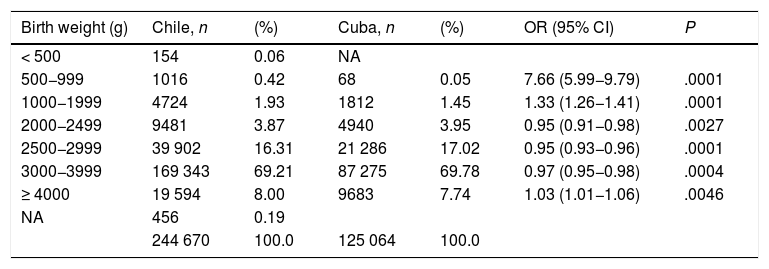
Table 2 compares the frequency distribution of live births by birth weight in Chile and Cuba. In Chile, 6.28% of live births corresponded to birth weights of < 2500 g compared to 5.45% in Cuba (OR, 1.16; 95% CI, 1.12–1.19). We ought to highlight the considerable difference between Chile and Cuba in the proportion of live births with weights ranging from 500 to 999 g (OR, 7.66; 95% CI, 5.99–9.79) and the fact that Cuba did not report any deaths of newborns with birth weights of less than 500 g. In Chile, the proportion of live births with weights in the 2000–3999 g range was lower, and the proportion with weights of 4000 g and greater was higher.
Comparison of live births in Chile and Cuba based on birth weight, 2015.
| Birth weight (g) | Chile, n | (%) | Cuba, n | (%) | OR (95% CI) | P |
|---|---|---|---|---|---|---|
| < 500 | 154 | 0.06 | NA | |||
| 500−999 | 1016 | 0.42 | 68 | 0.05 | 7.66 (5.99−9.79) | .0001 |
| 1000−1999 | 4724 | 1.93 | 1812 | 1.45 | 1.33 (1.26−1.41) | .0001 |
| 2000−2499 | 9481 | 3.87 | 4940 | 3.95 | 0.95 (0.91−0.98) | .0027 |
| 2500−2999 | 39 902 | 16.31 | 21 286 | 17.02 | 0.95 (0.93−0.96) | .0001 |
| 3000−3999 | 169 343 | 69.21 | 87 275 | 69.78 | 0.97 (0.95−0.98) | .0004 |
| ≥ 4000 | 19 594 | 8.00 | 9683 | 7.74 | 1.03 (1.01−1.06) | .0046 |
| NA | 456 | 0.19 | ||||
| 244 670 | 100.0 | 125 064 | 100.0 |
NA, not available.
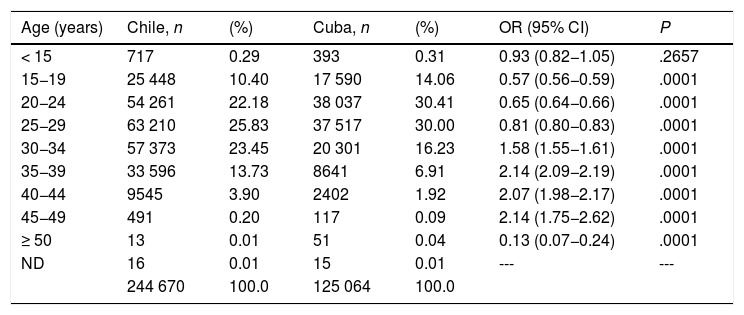
Table 3 compares the frequency distribution of live births by maternal age, expressed in 5-year increments, in Chile and Cuba. There was a higher frequency of live births in Chile in all maternal age bands between 30 and 49 years, while the frequency of live births in women aged less than 30 years was lower compared to Cuba. Chile also have a lower frequency of live births in mothers aged 50 or more years.
Comparison of maternal age frequency distribution in live births in Chile and Cuba, 2015.
| Age (years) | Chile, n | (%) | Cuba, n | (%) | OR (95% CI) | P |
|---|---|---|---|---|---|---|
| < 15 | 717 | 0.29 | 393 | 0.31 | 0.93 (0.82−1.05) | .2657 |
| 15−19 | 25 448 | 10.40 | 17 590 | 14.06 | 0.57 (0.56−0.59) | .0001 |
| 20−24 | 54 261 | 22.18 | 38 037 | 30.41 | 0.65 (0.64−0.66) | .0001 |
| 25−29 | 63 210 | 25.83 | 37 517 | 30.00 | 0.81 (0.80−0.83) | .0001 |
| 30−34 | 57 373 | 23.45 | 20 301 | 16.23 | 1.58 (1.55−1.61) | .0001 |
| 35−39 | 33 596 | 13.73 | 8641 | 6.91 | 2.14 (2.09−2.19) | .0001 |
| 40−44 | 9545 | 3.90 | 2402 | 1.92 | 2.07 (1.98−2.17) | .0001 |
| 45−49 | 491 | 0.20 | 117 | 0.09 | 2.14 (1.75−2.62) | .0001 |
| ≥ 50 | 13 | 0.01 | 51 | 0.04 | 0.13 (0.07−0.24) | .0001 |
| ND | 16 | 0.01 | 15 | 0.01 | --- | --- |
| 244 670 | 100.0 | 125 064 | 100.0 |
ND, not documented.
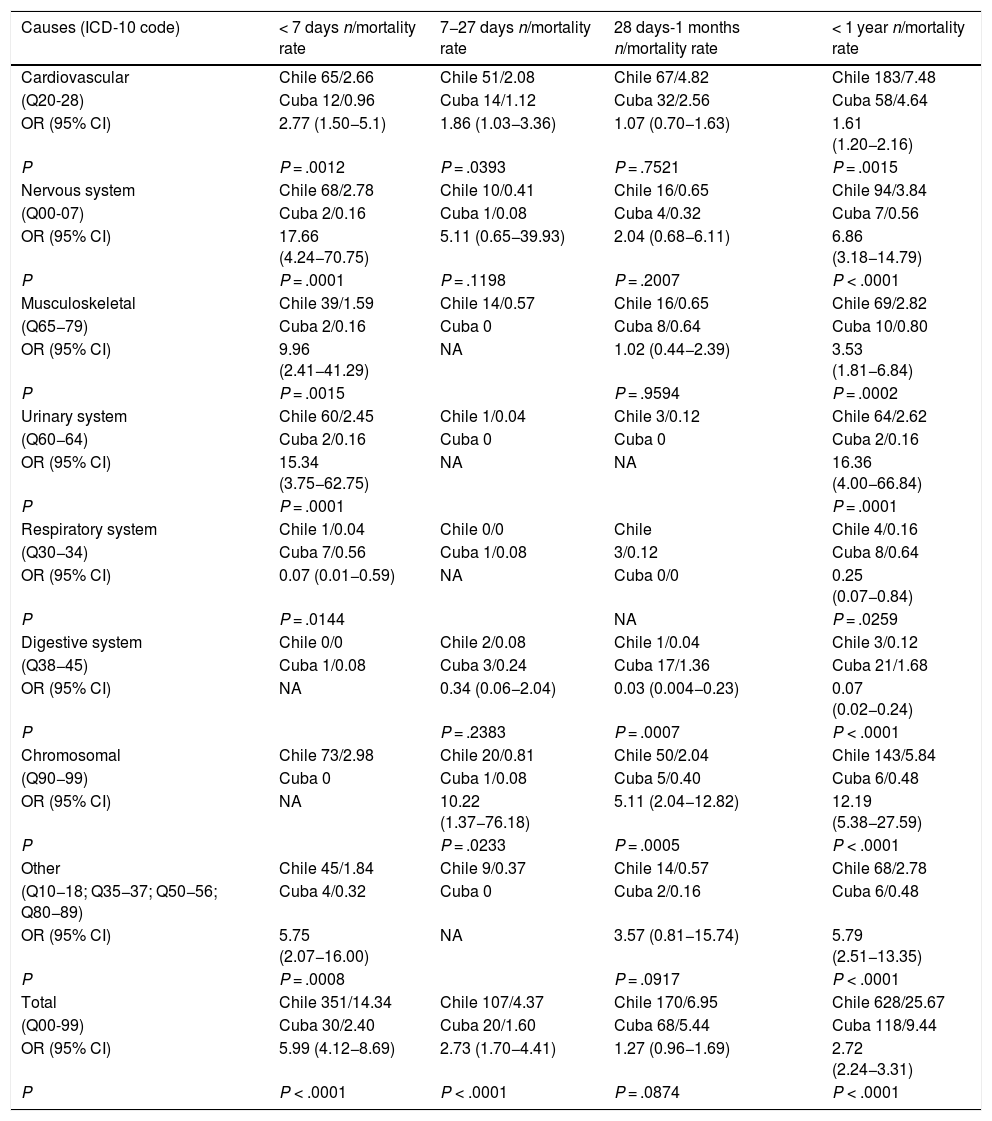
Table 4 presents the comparison of Chile and Cuba based on the frequency of infant deaths caused by congenital malformations, deformations and chromosomal disorders (international classification of diseases [ICD] codes Q00-99). We found a higher frequency of infant deaths due to these disorders in Chile (25.6 per 10 000 live births) compared to Cuba (9.4 per 10 000 live births) (OR, 2.72; 95% CI, 2.24−3.31). In Chile, there was a higher frequency of infant deaths due to urinary system malformations (OR, 16.36; 95% CI, 4.00−66.84), chromosomal disorders (OR, 12.19; 95% CI, 5.38−27.59) and nervous system anomalies (OR, 6.86; 95% CI, 3.18−14.79).
Comparison of infant mortality and its components in association with congenital malformations and chromosomal abnormalities in Chile and Cuba (2015).
| Causes (ICD-10 code) | < 7 days n/mortality rate | 7−27 days n/mortality rate | 28 days-1 months n/mortality rate | < 1 year n/mortality rate |
|---|---|---|---|---|
| Cardiovascular | Chile 65/2.66 | Chile 51/2.08 | Chile 67/4.82 | Chile 183/7.48 |
| (Q20-28) | Cuba 12/0.96 | Cuba 14/1.12 | Cuba 32/2.56 | Cuba 58/4.64 |
| OR (95% CI) | 2.77 (1.50−5.1) | 1.86 (1.03−3.36) | 1.07 (0.70−1.63) | 1.61 (1.20−2.16) |
| P | P = .0012 | P = .0393 | P = .7521 | P = .0015 |
| Nervous system | Chile 68/2.78 | Chile 10/0.41 | Chile 16/0.65 | Chile 94/3.84 |
| (Q00-07) | Cuba 2/0.16 | Cuba 1/0.08 | Cuba 4/0.32 | Cuba 7/0.56 |
| OR (95% CI) | 17.66 (4.24−70.75) | 5.11 (0.65−39.93) | 2.04 (0.68−6.11) | 6.86 (3.18−14.79) |
| P | P = .0001 | P = .1198 | P = .2007 | P < .0001 |
| Musculoskeletal | Chile 39/1.59 | Chile 14/0.57 | Chile 16/0.65 | Chile 69/2.82 |
| (Q65−79) | Cuba 2/0.16 | Cuba 0 | Cuba 8/0.64 | Cuba 10/0.80 |
| OR (95% CI) | 9.96 (2.41−41.29) | NA | 1.02 (0.44−2.39) | 3.53 (1.81−6.84) |
| P | P = .0015 | P = .9594 | P = .0002 | |
| Urinary system | Chile 60/2.45 | Chile 1/0.04 | Chile 3/0.12 | Chile 64/2.62 |
| (Q60−64) | Cuba 2/0.16 | Cuba 0 | Cuba 0 | Cuba 2/0.16 |
| OR (95% CI) | 15.34 (3.75−62.75) | NA | NA | 16.36 (4.00−66.84) |
| P | P = .0001 | P = .0001 | ||
| Respiratory system | Chile 1/0.04 | Chile 0/0 | Chile | Chile 4/0.16 |
| (Q30−34) | Cuba 7/0.56 | Cuba 1/0.08 | 3/0.12 | Cuba 8/0.64 |
| OR (95% CI) | 0.07 (0.01−0.59) | NA | Cuba 0/0 | 0.25 (0.07−0.84) |
| P | P = .0144 | NA | P = .0259 | |
| Digestive system | Chile 0/0 | Chile 2/0.08 | Chile 1/0.04 | Chile 3/0.12 |
| (Q38−45) | Cuba 1/0.08 | Cuba 3/0.24 | Cuba 17/1.36 | Cuba 21/1.68 |
| OR (95% CI) | NA | 0.34 (0.06−2.04) | 0.03 (0.004−0.23) | 0.07 (0.02−0.24) |
| P | P = .2383 | P = .0007 | P < .0001 | |
| Chromosomal | Chile 73/2.98 | Chile 20/0.81 | Chile 50/2.04 | Chile 143/5.84 |
| (Q90−99) | Cuba 0 | Cuba 1/0.08 | Cuba 5/0.40 | Cuba 6/0.48 |
| OR (95% CI) | NA | 10.22 (1.37−76.18) | 5.11 (2.04−12.82) | 12.19 (5.38−27.59) |
| P | P = .0233 | P = .0005 | P < .0001 | |
| Other | Chile 45/1.84 | Chile 9/0.37 | Chile 14/0.57 | Chile 68/2.78 |
| (Q10−18; Q35−37; Q50−56; Q80−89) | Cuba 4/0.32 | Cuba 0 | Cuba 2/0.16 | Cuba 6/0.48 |
| OR (95% CI) | 5.75 (2.07−16.00) | NA | 3.57 (0.81−15.74) | 5.79 (2.51−13.35) |
| P | P = .0008 | P = .0917 | P < .0001 | |
| Total | Chile 351/14.34 | Chile 107/4.37 | Chile 170/6.95 | Chile 628/25.67 |
| (Q00-99) | Cuba 30/2.40 | Cuba 20/1.60 | Cuba 68/5.44 | Cuba 118/9.44 |
| OR (95% CI) | 5.99 (4.12−8.69) | 2.73 (1.70−4.41) | 1.27 (0.96−1.69) | 2.72 (2.24−3.31) |
| P | P < .0001 | P < .0001 | P = .0874 | P < .0001 |
Rate expressed as deaths per 10 000 live births. NA, not applicable.
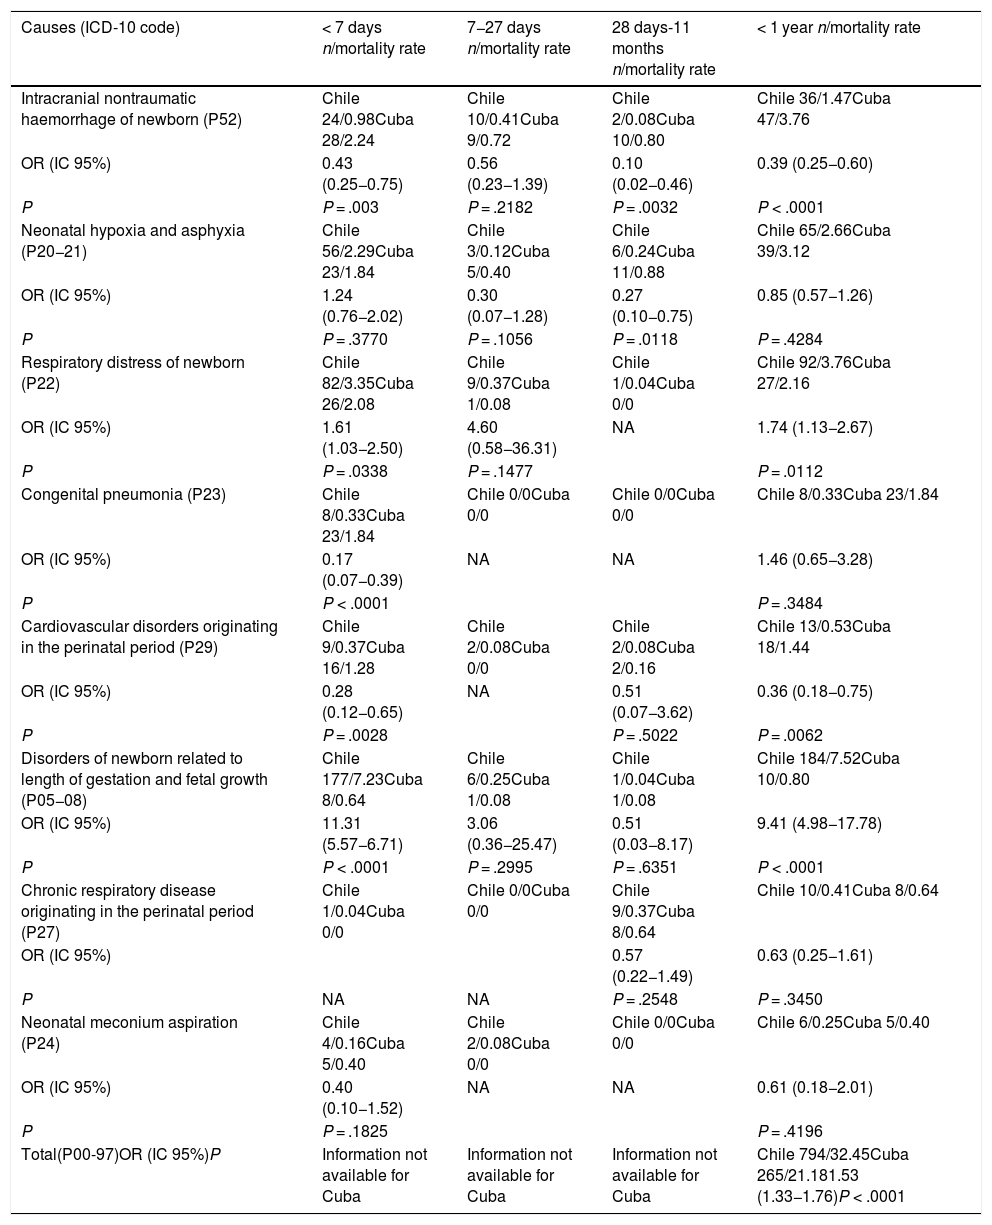
Table 5 presents the results of the comparison of infant deaths due to “certain conditions originating in the perinatal period” (ICD P00-97). We found a higher frequency of infant deaths in Chile due to conditions originating in the perinatal period (OR, 1.53; 95% CI, 1.33−1.76). We ought to highlight the greater frequency in Chile of infant deaths due to respiratory distress syndrome (OR, 1.74; 95% CI, 1.13−2.67) and disorders of newborn related to length of gestation (OR, 9.41; 95% CI, 4.98−17.78).
Comparison of infant mortality and its components in association with certain conditions originating in the perinatal period in Chile and Cuba (2015).
| Causes (ICD-10 code) | < 7 days n/mortality rate | 7−27 days n/mortality rate | 28 days-11 months n/mortality rate | < 1 year n/mortality rate |
|---|---|---|---|---|
| Intracranial nontraumatic haemorrhage of newborn (P52) | Chile 24/0.98Cuba 28/2.24 | Chile 10/0.41Cuba 9/0.72 | Chile 2/0.08Cuba 10/0.80 | Chile 36/1.47Cuba 47/3.76 |
| OR (IC 95%) | 0.43 (0.25−0.75) | 0.56 (0.23−1.39) | 0.10 (0.02−0.46) | 0.39 (0.25−0.60) |
| P | P = .003 | P = .2182 | P = .0032 | P < .0001 |
| Neonatal hypoxia and asphyxia (P20−21) | Chile 56/2.29Cuba 23/1.84 | Chile 3/0.12Cuba 5/0.40 | Chile 6/0.24Cuba 11/0.88 | Chile 65/2.66Cuba 39/3.12 |
| OR (IC 95%) | 1.24 (0.76−2.02) | 0.30 (0.07−1.28) | 0.27 (0.10−0.75) | 0.85 (0.57−1.26) |
| P | P = .3770 | P = .1056 | P = .0118 | P = .4284 |
| Respiratory distress of newborn (P22) | Chile 82/3.35Cuba 26/2.08 | Chile 9/0.37Cuba 1/0.08 | Chile 1/0.04Cuba 0/0 | Chile 92/3.76Cuba 27/2.16 |
| OR (IC 95%) | 1.61 (1.03−2.50) | 4.60 (0.58−36.31) | NA | 1.74 (1.13−2.67) |
| P | P = .0338 | P = .1477 | P = .0112 | |
| Congenital pneumonia (P23) | Chile 8/0.33Cuba 23/1.84 | Chile 0/0Cuba 0/0 | Chile 0/0Cuba 0/0 | Chile 8/0.33Cuba 23/1.84 |
| OR (IC 95%) | 0.17 (0.07−0.39) | NA | NA | 1.46 (0.65−3.28) |
| P | P < .0001 | P = .3484 | ||
| Cardiovascular disorders originating in the perinatal period (P29) | Chile 9/0.37Cuba 16/1.28 | Chile 2/0.08Cuba 0/0 | Chile 2/0.08Cuba 2/0.16 | Chile 13/0.53Cuba 18/1.44 |
| OR (IC 95%) | 0.28 (0.12−0.65) | NA | 0.51 (0.07−3.62) | 0.36 (0.18−0.75) |
| P | P = .0028 | P = .5022 | P = .0062 | |
| Disorders of newborn related to length of gestation and fetal growth (P05−08) | Chile 177/7.23Cuba 8/0.64 | Chile 6/0.25Cuba 1/0.08 | Chile 1/0.04Cuba 1/0.08 | Chile 184/7.52Cuba 10/0.80 |
| OR (IC 95%) | 11.31 (5.57−6.71) | 3.06 (0.36−25.47) | 0.51 (0.03−8.17) | 9.41 (4.98−17.78) |
| P | P < .0001 | P = .2995 | P = .6351 | P < .0001 |
| Chronic respiratory disease originating in the perinatal period (P27) | Chile 1/0.04Cuba 0/0 | Chile 0/0Cuba 0/0 | Chile 9/0.37Cuba 8/0.64 | Chile 10/0.41Cuba 8/0.64 |
| OR (IC 95%) | 0.57 (0.22−1.49) | 0.63 (0.25−1.61) | ||
| P | NA | NA | P = .2548 | P = .3450 |
| Neonatal meconium aspiration (P24) | Chile 4/0.16Cuba 5/0.40 | Chile 2/0.08Cuba 0/0 | Chile 0/0Cuba 0/0 | Chile 6/0.25Cuba 5/0.40 |
| OR (IC 95%) | 0.40 (0.10−1.52) | NA | NA | 0.61 (0.18−2.01) |
| P | P = .1825 | P = .4196 | ||
| Total(P00-97)OR (IC 95%)P | Information not available for Cuba | Information not available for Cuba | Information not available for Cuba | Chile 794/32.45Cuba 265/21.181.53 (1.33−1.76)P < .0001 |
Rate expressed as deaths per 10 000 live births. NA, not applicable.
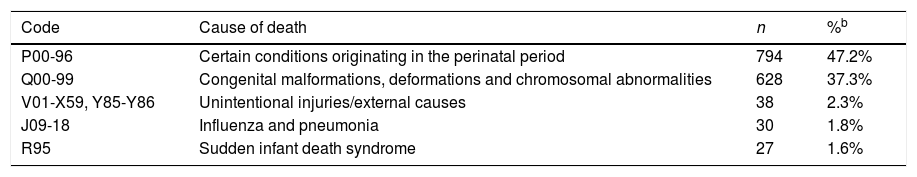
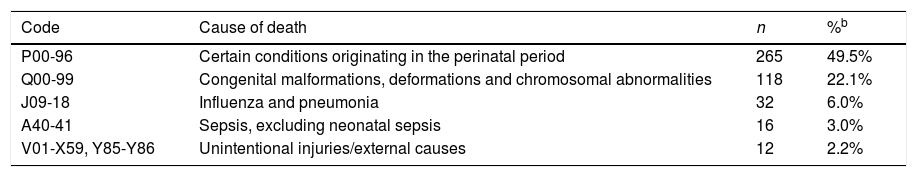
Tables 6 and 7 present the 5 leading causes of infant death in Chile and Cuba. In both countries, the 2 leading causes are certain conditions originating in the perinatal period (ICD P00-96) and congenital malformations, deformations and chromosomal disorders (ICD Q00-99), accounting for 84.5% of the IM in Chile and 71.6% in Cuba. Influenza and pneumonia (ICD J09-18) were the third leading cause in Cuba and the fourth in Chile. Unintentional injuries (ICD V01-X59, Y85-Y86) were the fifth leading cause in Cuba and the third in Chile. A relevant finding was that in Chile, the fifth leading cause was sudden infant death syndrome (R95).
Leading causes of death in infants aged less than 1 year in Chile (2015)a.
| Code | Cause of death | n | %b |
|---|---|---|---|
| P00-96 | Certain conditions originating in the perinatal period | 794 | 47.2% |
| Q00-99 | Congenital malformations, deformations and chromosomal abnormalities | 628 | 37.3% |
| V01-X59, Y85-Y86 | Unintentional injuries/external causes | 38 | 2.3% |
| J09-18 | Influenza and pneumonia | 30 | 1.8% |
| R95 | Sudden infant death syndrome | 27 | 1.6% |
Leading causes of death in infants aged less than 1 year in Cuba (2015)a.
| Code | Cause of death | n | %b |
|---|---|---|---|
| P00-96 | Certain conditions originating in the perinatal period | 265 | 49.5% |
| Q00-99 | Congenital malformations, deformations and chromosomal abnormalities | 118 | 22.1% |
| J09-18 | Influenza and pneumonia | 32 | 6.0% |
| A40-41 | Sepsis, excluding neonatal sepsis | 16 | 3.0% |
| V01-X59, Y85-Y86 | Unintentional injuries/external causes | 12 | 2.2% |
Our findings show that IM was significantly greater in Chile compared to Cuba in 2015 (6.87/1000 live births vs 4.27/1000 live births; P < .0001). Most of this difference can be explained by the higher frequency of infant deaths in Chile due to congenital malformations, chromosomal disorders and certain conditions originating in the perinatal period.
Infant mortality in Chile is higher, especially in association with malformations that can be easily detected with level 1 and level 2 ultrasound examinations, such as central nervous system malformations (anencephaly) and renal malformation (renal agenesis). We found that these diseases were nearly non-existent in Cuban newborns, probably as a consequence of the National Programme of Medical Genetics in that country,18–20 which provides the framework for the establishment of protocols for early detection of congenital anomalies compatible and incompatible with life and for voluntary termination of pregnancy due to foetal abnormalities.21 Indeed, this programme allowed the detection of congenital anomalies in 1 out of 90 evaluated pregnancies: Down syndrome was diagnosed in 1036 foetuses, and approximately 80% of couples chose to terminate the pregnancy.21
On the other hand, Chilean law did not allow abortion on the grounds of lethal malformations until September 2017,14 when law 21.030 was enacted15 decriminalizing voluntary termination of pregnancy in case “the embryo or foetus suffers from an acquired or genetic congenital disorder, incompatible with an independent extrauterine life, as to be of a lethal nature”. While this law was not enacted as a public health policy seeking to reduce IM, we hypothesise that it will contribute indirectly to a reduction in the number of associated deaths before age 1 year. These are the considerations that constitute one of the strengths of our study, that our findings will allow a comparison of the epidemiology of IM in Chile before and after the enactment of this law and the assessment of the impact of this law in this health indicator in future studies. Thus, previous studies in Canada22 and Australia,23 for example, reported a significant decrease in IM associated with voluntary termination of pregnancy in cases of congenital malformations and chromosomal abnormalities.
Since 2000, flour in Chile is fortified with folic acid, a primary prevention intervention that achieved a 50% reduction in the incidence of neural tube defects in the 1999–2009 period.24 Notwithstanding, in 2015 there were 59 infant deaths due to anencephaly in Chile, 53 of which took place in the first week of life,16 while no cases of this disease were reported in Cuba.10
While the higher IM in Chile can be explained by the legality of abortion on the ground of foetal anomalies in Cuba, we consider that this is not the only factor at play. In Chile, there is a higher proportion of live births in mothers aged 35 or more years compared to Cuba (17.84% vs 8.96% of live births, respectively), and our group has already reported the increased risk of IM associated with advanced maternal age.25
Chile is undergoing an epidemic shift characterised by an increase in the number of births in women aged 40 years and older26 and ageing of the population of women of reproductive age,27 which entails an increased risk in pregnancy of congenital malformations and aneuploidies like Down syndrome. Thus, Chile has the highest incidence of Down syndrome in Latin America, and it shows an increasing trend.28,29 Prenatal diagnosis of Down syndrome in Chile is not considered grounds for abortion in the new Chilean law, but prenatal diagnosis of trisomies 13 and 18 could be considered grounds for voluntary termination of pregnancy in Chile in upcoming years.
In 2015, there were more infant deaths in Chile compared to Cuba attributable to disorders of newborn related to length of gestation and fetal growth (OR, 9.41; 95% CI, 4.98−17.78) and to respiratory distress of newborn (OR, 1.74; 95% CI, 1.13−2.67). This may be due to a higher probability of high-risk pregnancy in women in Chile compared to Cuba, mainly on account of the greater proportion of births in mothers aged 35 years or more found in our study. Our group already reported the increased risk of perinatal and infant mortality associated with the ageing of the population of women of reproductive age in Chile,25,30 and there is also evidence that advanced maternal age is associated with an increased risk of preterm birth and low birth weight.31,32 We found a substantial difference between Chile and Cuba in the proportion of live births with birth weights ranging from 500 to 999 g (OR, 7.66; 95% CI, 5.99–9.79), and live births with a high risk of neonatal death and important risk factors for infant mortality (OR, 9.41; 95% CI, 4.98−17.78). It is worth noting that 60.41% of live births in Cuba, compared to 48.01% in Chile, were in women aged 20–29 years, an age interval known to correspond to a lower risk of maternal, perinatal and infant morbidity and mortality.33
Chile includes newborns with birth weights of less than 500 g in its vital records, unlike Cuba. Our study found that the live birth records for Chile included 154 newborns with birth weights of less than 500 g, whereas these newborns were not included in the live birth records in Cuba, yet given the low frequency of these live births in Chile (0.06%), this factor does not affect the comparison of IM in both countries. In developed countries, there is evidence of significant variations in IM associated with the interpretation or inclusion of extremely low birth weights of less than 500 g or 1000 g,8 leading the World Health Organization to recommend that international comparisons of IM be limited to live births with birth weights of 1000 g and greater to avoid interpretation biases or under-recording of extremely low birth weight infants born alive.34 In this sense, it is important to consider the potential under-recording in Cuba of live births with birth weights between 500 and 999 g (68 live births recorded) compared to Chile (1016 live births recorded) (OR, 7.66; 95% CI, 5.99–9.79), or the influence of the success of the programme for the reduction of low birth weight developed in 1998 by the Ministry of Public Health of Cuba.35
An important finding of the study was the lack of differences in postneonatal mortality between Chile and Cuba, which refers to a life stage in which deaths due to congenital malformations and chromosomal abnormalities have a low impact on IM, which supports our hypothesis that the lower IM in Cuba is explained in part by elective abortion in case of foetal abnormalities; also, while we ought to acknowledge that in 2008 our group found a higher postneonatal mortality in Chile compared to Cuba,13 our current findings could be due to improvements in infant care in Chile.
Another finding of interest was the similarity in the causes of infant deaths in Chile compared to other developed countries in the region, with unintentional injuries and sudden infant death syndrome included among the five leading causes of IM.36,37
Health inequalities, defined as differences in the availability or accessibility of health care services across the population, are a serious public health problem, especially in developing countries. Several studies have demonstrated the impact of poverty, educational attainment, residence in rural areas, ethnicity and migrant status in IM in Chile.38–41 We did not find any sources on infant health inequalities in Cuba.
ConclusionIn 2015, infant mortality was higher in Chile compared to Cuba. The lower IM in Cuba can be attributed to 1) elective termination of pregnancy due to congenital malformations and chromosomal abnormalities; 2) lower epidemiological risk in the population of pregnant women in Cuba compared to Chile; and 3) a lower frequency of low birth weight newborns. We hypothesise that the decriminalization of abortion on the grounds of congenital malformations incompatible with life may reduce IM in Chile.
Conflicts of interestThe authors have no conflicts of interest to declare.
Please cite this article as: Donoso E, Carvajal JA. Diferencias epidemiológicas podrían explicar la mayor mortalidad infantil de Chile comparada con Cuba. An Pediatr (Barc). 2021;94:28–35.