


The metabolically healthy obese phenotype (FOMS) defines obese patients who have preserved insulin sensitivity and absence of metabolic complications. This phenotype is associated with a lower risk of cardiovascular disease and type 2 diabetes in adulthood.
ObjectivesTo determine the prevalence of FOMS and the obese phenotype with metabolic risk (FORM) in a cohort of obese children and adolescents and to establish the predictive capacity of the tri-ponderal mass index (TMI) and other anthropometric parameters in order to identify these patients.
Patients and methodsA cross-sectional study was conducted on 239 obese patients (125 males) from 8 to 18 years of age. Grade 3 obesity was present in 45.9% of the patients. ROC curves were used to find the best cut-off point for: TMI, body mass index (BMI), BMI z-score (BMIzs), and waist/height index (WHI). FOMS components: plasma blood glucose, plasma triglycerides, HDL-cholesterol, and blood pressure.
ResultsThe prevalence of FOMS in the study cohort was 37.6%. No differences between genders were observed, and it was increasing with the age and the level of obesity. The TMI has a sensitivity of 75.8 and a specificity of 42.2 to identify the FORM patients. The best cut-off point for TMI is 18.7 kg/m3, for BMI it was 30.4 kg/m2, for BMIzs +3.5 SD, and 0.62 for WHI.
ConclusionsThe diagnostic accuracy of TMI in identifying obese adolescents with metabolic risk was similar to BMI and WHI. However, the TMI makes it easier and simplifies the classification of the obesity level in both genders.
El fenotipo obeso metabólicamente sano (FOMS) define a los pacientes obesos que tienen preservada la sensibilidad a la insulina y que no presentan complicaciones metabólicas. Este fenotipo se asocia a menor riesgo de padecer enfermedad cardiovascular y diabetes tipo 2 en la edad adulta.
ObjetivosDeterminar la prevalencia del FOMS y del fenotipo obeso con riesgo metabólico (FORM) en una cohorte de niños y adolescentes obesos y establecer la capacidad predictiva del índice de masa triponderal (IMT) y de otros parámetros antropométricos para identificar a estos pacientes.
Pacientes y métodosEstudio transversal de 239 pacientes (125 varones) obesos de 8 a 18 años de edad. El 45,9% presenta obesidad grado 3. Se utilizan las curvas ROC para buscar el mejor punto de corte para: IMT, índice de masa corporal (IMC), valor z-score del IMC (zsIMC) e índice cintura/talla (ICT). Componentes FOMS: glucemia plasmática, triglicéridos plasmáticos, colesterol HDL y tensión arterial.
ResultadosLa prevalencia del FOMS en nuestra cohorte es de 37.6% sin observarse diferencias entre sexos, incrementándose con la edad y con el grado de obesidad. El IMT tiene una sensibilidad de 75.8 y una especificidad de 42.2 para identificar los pacientes FORM. El mejor punto de corte para el IMT es 18.7 kg/m3, para el IMC 30.4 kg/m2, para el zsIMC +3.5 DE y para el ICT 0.62.
ConclusionesLa precisión diagnóstica del IMT para identificar niños y adolescentes con riesgo metabólico es similar al IMC y al ICT. No obstante, facilita y simplifica la categorización del grado de obesidad en ambos sexos.
Childhood obesity is one of the most important public health problems in our society, not only on account of its increasing incidence, but also because it tends to persist in adolescence, and adolescent obesity tends to persist in adulthood. Childhood and adolescent obesity constitute a risk factor for development of metabolic, cardiovascular and endocrine complications, among others, in the short term (childhood and adolescence) and the long term (adulthood), and it is generally associated with a decreased life expectancy.1–4
The body mass index (BMI, in kg/m2) is the anthropometric parameter used most frequently to estimate the body fat of an individual. However, its interpretation in children and adolescents is subject to limitations, since this index is not constant and varies widely based on age, sex, stage of development and the prevalence of obesity in the population, and therefore requires reference values and reporting in the form of z-scores. The BMI is very useful to analyse the association between morbidity and the degree of obesity and to monitor the effectiveness of treatment in the short and long terms.5–7
Recent studies suggest that the tri-ponderal mass index (TMI, in kg/m3) provides a more accurate estimate than the BMI of the body fat percentage in children and adolescents aged 8–18 years, and therefore some authors have proposed using the TMI z-score instead of the BMI z-score.8,9 In Spain, the reference BMI and TMI values for age and sex in children without malnutrition or obesity from data obtained in the longitudinal growth study of Barcelona for the millennial generation (1995–2017) were published recently.10 These values could be very useful in the clinical assessment of obesity, especially in prepubertal children and adolescents. Specifically, TMI values are very uniform from 8 to 18 years of age in both sexes, and therefore a single cut-off point could be used to identify either overweight or obesity, avoiding more complex calculations to determine the severity of excess weight (BMI percent and z-score).
The waist-to-height ratio (WHtR), also known as the waist-to-stature ratio, has been proposed as a very useful parameter for identification of central obesity and cardiovascular/metabolic risk. In paediatric patients with obesity, a WHtR greater than 0.5 increases the risk of metabolic syndrome by a factor of 12.11 compared to children with a normal BMI.11
Recently, the term metabolically healthy obesity (MHO) was coined to refer to obese patients that are free of metabolic complications (high fasting glucose, dyslipidaemia and high blood pressure) and with preserved insulin sensitivity despite the excess of body fat.12 This phenotype is associated with a lower relative risk of developing cardiovascular disease and type 2 diabetes in adulthood.13,14 Metabolically unhealthy obesity (MUO), the definition of which also does not include the waist circumference, is a term currently recommended to refer to obese patients with metabolic complications, whether paediatric15,16 or adult, on account of its greater discriminatory power.12,17,18
The aim of our study was to determine the prevalence of MHO and MUO in a cohort of children and adolescents with obesity and to establish cut-off points for anthropometric parameters using ROC curves to identify patients with MUO more accurately.
Sample and methodsWe conducted a prospective study in 239 children and adolescents aged 8–18 years referred for assessment of obesity to the paediatric endocrinology unit of a tertiary care hospital between 2012 and 2016; 125 were male, with a mean age (± standard deviation) of 12.7 ± 2.4 years and a mean BMI of 31.4 ± 3.9 kg/m2, a BMI z-score of 5.7 ± 1.9 and a mean TMI of 20.4 ± 2.6 kg/m3; 114 were with a mean age of 12.3 ± 2.2 years and a mean BMI of 31.6 ± 4.6, a BMI z-score of 5.4 ± 1.8 and a mean TMI of 20.1 ± 2.6. The distribution of the patients by Tanner stage of pubertal development19 was as follows: 45 prepubertal, 119 pubertal and 75 postpubertal that had achieved their final height. All patients included in the study were white, none had genetic or endocrine disorders with a known association with obesity (hypothyroidism, Cushing syndrome, hypothalamic obesity following brain surgery) or chronic diseases, and none was currently in treatment with drugs that could affect body weight (systemic steroids and psychotropic drugs). The study was approved by the ethics committee of our hospital, and we obtained the informed consent of all participants.
For each participant, we measured the weight (with a Seca 220® digital scale accurate to 0.1 kg and a range of 1−150 kg) and the standing height (with a Holtain® stadiometer), and then calculated the BMI (weight [kg] divided by the height squared [m2]) and the TMI (weight [kg] divided by the height cubed [m3]). We compared the BMI values with the population reference values for age and sex10 and obtained the corresponding BMI z-scores as follows: we subtracted the reference BMI for age and sex from the BMI of the subject and divided the result by the standard deviation of the distribution of BMI values for that age and sex in the reference population.
The criteria most widely used to define obesity is the BMI value, with obesity diagnosed if the BMI is above the 95th percentile or the BMI z-score is 2 or greater based on the reference values for age and sex.10 We estimated the severity and degree of obesity based on the calculation of the BMI as a percentage of the 95th percentile (P95) in the reference population, as proposed by Flegal et al.,20 categorising patients into 3 groups: grade 1 obesity (moderate) when the BMI as percentage of the P95 was less than l 120%, grade 2 obesity (severe) if the percentage over the P95 was between 120 and 140%, and grade 3 obesity (morbid) when the BMI as a percentage of the P95 was greater than 140%.
We measured the waist circumference with a non-stretch nylon tape measure, with the patient standing, at the midpoint between the caudal edge of the lowest rib and the iliac crest at the level of the navel, with the tape measure in the horizontal plane. We calculated the WHtR by dividing the waist circumference by the height (both in cm). We considered values between 0.4 and 0.5 normal.11
Blood pressureWe measured blood pressure (BP) with the patient seated and with the left arm at the level of the heart with an automated oscillometric vital signs monitor (Bionet BM3 Multi-parameter Plus, Bionet America, USA), after having the patient at rest for 5 min, with a cuff of a size that would cover 80–100% of the arm circumference of the patient. We took three measurements 3−5 min apart and calculated the mean BP from the last 2. We defined obese patient with cardiovascular risk as a systolic blood pressure (SBP) and/or diastolic blood pressure (DBP) above the 90th percentile for age, sex and height.16,21
Laboratory parametersWe obtained blood samples by venepuncture from all participants after a fast of at least 8 h, which were analysed by means of colorimetric enzyme assays with the AU5800 clinical chemistry analyser (Beckman Coulter, USA), including blood glucose, total cholesterol, low-density lipoprotein cholesterol (LDL-C), high-density lipoprotein cholesterol (HDL-C) and triglycerides; we measured blood insulin by 2‑step sandwich immunoassay using indirect chemiluminescent technology with an Atellica IM analyser (Siemens Healthineers, USA). We estimated the degree of insulin resistance with the Homeostatic Model Assessment for Insulin Resistance (HOMA-IR) (basal glucose [mg/dL] × basal insulin [mU/L] / 405)22 and peripheral insulin sensitivity with the quantitative insulin-sensitivity check index (QUICKI) (1/[log basal insulin + log basal glucose]).23
Definition of metabolic status in obese patientsTo define the metabolic status of obese patients, we classified patients into 2 groups (MHO and MUO) based on the following criteria: 1) blood glucose < 100 mg/dL; 2) triglycerides ≤ 150 mg/dL; 3) HDL-C ≥ 40 mg/dL and 4) SBP and DBP ≤ 90th percentile (P90). We classified patients as having MHO based on the absence of high blood pressure, dyslipidaemia and high fasting blood glucose, applying the consensus definition published by Damanhoury et al.16 We classified patients as having MUO if they met one or more of the cardiovascular risk criteria.
Statistical analysisWe have expressed the results as mean and standard deviation. We performed a univariate descriptive analysis of the different variables under study and used the nonparametric Mann-Whitney U test for independent groups to analyse differences between the MHO and MUO groups in the mean values of the variables under study. We set a probability of type I error at 5%. Last of all, we performed a receiver operating characteristic (ROC) curve analysis. For each of the anthropometric parameters used, we used the ROC curve and the Youden index to determine the optimal cut-off point for identifying patients with MHO and MUO. We present the results of this analysis using the area under the curve (AUC), the established cut-off point and the sensitivity, specificity and the accuracy (correct classification) achieved with this point.
ResultsTable 1 presents the age, Tanner stages and anthropometric values in female and male patients; we found no differences between the sexes in age, BMI, BMI z-scores, TMI and TMI z-score, although we did find differences in the Tanner stage distribution (P < .005).
Distribution of age, pubertal stage and anthropometric values in obese children and adolescents by sex (N = 239).
| Female, n = 114 (47.7%) | Male, n = 125 (52.3%) | P | |
|---|---|---|---|
| Age (years) | 12.3 ± 2.2 | 12.7 ± 2.4 | ns |
| Tanner | Prepubertal: 16 | Prepubertal: 29 | .005 |
| Pubertal: 51 | Pubertal: 68 | ||
| Postpubertal: 47 | Postpubertal: 28 | ||
| BMI (kg/m2) | 31.6 ± 4.6 | 31.4 ± 3.9 | ns |
| BMI z-score 2017 | 5.4 ± 1.8 | 5.7 ± 1.9 | ns |
| TMI (kg/m3) | 20.1 ± 2.6 | 20.4 ± 2.6 | ns |
| TMI z-score 2017 | 5.1 ± 1.8 | 5.5 ± 2.1 | ns |
The weight status distribution of the patients in the sample was as follows: 14.5% grade 1 obesity, 39.6% grade 2 obesity and 45.9% grade 3 obesity.
We found a prevalence of MHO of 37.6% and a prevalence of MUO of 62.4%, with no differences between male and female patients. We found a statistically significant increase in the proportion of patients with MUO associated with age and degree of obesity. The frequency distribution of the criteria used to define MUO was: 1) blood glucose ≥ 100 mg/dL: 0.8%; 2) triglycerides ≥ 150 mg/dL: 17.6%; 3) HDL-C ≤ 40 mg/dL: 27.6% and 4) SBP > P90 and DBP > P90: 38.1% and 14.6%, respectively.
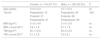
Table 2 presents the age, sex and anthropometric characteristics of participants by metabolic phenotype. We did not find differences in the sex distribution but found that patients in the MUO group were older (12.8 ± 2.4 years vs 12.0 ± 2.2 years; P = .009) and had more body fat based on the BMI (32.1 ± 4.6 vs 30.4 ± 3.6; P = .002), the BMI z-score (3.6 ± 1.3 vs 3.3 ± 1.1; P = .05) and the TMI (20.6 ± 2.6 vs 20.0 ± 2.4; P = .05) and had a larger waist circumference (100.5 ± 11.6 cm vs 91.8 ± 9.0 cm; P = .001). We did not find differences in the WHtR between the 2 groups.
Distribution of age, pubertal stage and anthropometric values in children and adolescents with metabolically healthy obesity (MHO) versus metabolically unhealthy obesity (MUO) in the study cohort (N = 239).
| MHO, n = 90 | MUO, n = 149 | P | |
|---|---|---|---|
| Age | 12.0 ± 2.2 | 12.8 ± 2.4 | .009 |
| Sex, n (%) | Male 46 (51.1%)Female 44 (48.9%) | Male 79 (53.0%)Female 70 (47.0%) | .79 |
| BMI (kg/m2) | 30.4 ± 3.6 | 32.1 ± 4.6 | .002 |
| BMI z-score | 3.3 ± 1.1 | 3.6 ± 1.3 | .05 |
| TMI (kg/m3) | 20.0 ± 2.4 | 20.6 ± 2.6 | .05 |
| Waist to height ratio | 0.61 ± 0.05 | 0.62 ± 0.05 | .10 |
| Waist circumference (cm) | 91.8 ± 9.0 | 100.5 ± 11.6 | .001 |
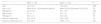
Table 3 shows the values of each of the components of the MUO phenotype: fasting blood glucose (mg/dL), triglycerides (mg/dL), HDL-C (mg/dL) and SBP and DBP (mmHg), insulin values and HOMA-IR and QUICKI indices. Patients with MUO had higher triglyceride levels in blood (133.1 ± 154.5 mg/dL vs 82.8 ± 28.2 mg/dL; P = .0001), a higher SBP (125.2 ± 13.7 mmHg vs 111.4 ± 7.4 mmHg; P = .0001) and DBP 72.7 ± 11.1) mmHg vs 65.1 ± 8.2 mmHg; P = .0001) and lower levels of HDL-C (43.2 ± 9.2 mg/dL vs 51.9 ± 15.8 mg/dL; P = .0001) compared to patients with MHO. We did not find differences in fasting blood glucose levels between the groups. Also, patients with MUO had higher basal insulin values (20.4 ± 11.7 mU/L vs 16.4 ± 7.4 mU/L; P = .01) and higher HOMA-IR scores (4.0 ± 2.3 vs 3.2 ± 1.5 mU/L; P = .02) and lower QUICKI scores (0.320 ± 0.029 vs 0.328 ± 0.034; P = .02) compared to patients with MHO.
Distribution of insulin levels, HOMA-IR and QUICKI scores and components of the MHO phenotype (blood glucose, triglycerides, HDL-C, systolic blood pressure [SBP] and diastolic blood pressure [DBP]) in children and adolescents with metabolically healthy obesity (MHO) versus metabolically unhealthy obesity (MUO) in the study cohort (N = 239).
| MHO, n = 90 | MUO, n = 149 | P | |
|---|---|---|---|
| Insulin (mU/L) | 16.4 ± 7.4 | 20.4 ± 11.7 | .01 |
| HOMA-IR | 3.2 ± 1.5 | 4.0 ± 2.3 | .02 |
| QUICKI | 0.328 ± 0.034 | 0.320 ± 0.029 | .02 |
| Blood glucose (mg/dL) | 81.0 ± 7.5 | 80.8 ± 7.1 | .50 |
| Triglycerides (mg/dL) | 82.8 ± 28.2 | 133.1 ± 154.5 | .0001 |
| HDL-C (mg/dL) | 51.9 ± 15.8 | 43.2 ± 9.2 | .0001 |
| SBP (mmHg) | 111.4 ± 7.4 | 125.2 ± 13.7 | .0001 |
| DBP (mmHg) | 65.1 ± 8.2 | 72.7 ± 11.1 | .0001 |
Table 4 shows the values of the area under the ROC curve, the sensitivity, specificity, percentage of patients classified correctly, selected cut-off point (Youden) and optimal cut-off point (AUC) for each of the anthropometric parameters under study. The optimal cut-off points to identify MUO were: BMI, 30.4 (ROC AUC, 0.621; confidence interval [CI], 0.547−0.694); BMI z-score, +3.5 (ROC AUC, 0.574; CI, 0.499−0.648); TMI, 18.7 (ROC AUC, 0.561; CI, 0.485−0.637); WHtR, 0.62 (ROC AUC, 0.565; CI, 0.487−0.643).
ROC curves. Optimal cut-off points for the anthropometric parameters under study for identification of the metabolically unhealthy obesity phenotype.
| AUC | Sensitivity | Specificity | Correctly classified | Cutoff (Youden) | Optimal cutoff (AUC) | |
|---|---|---|---|---|---|---|
| BMI (kg/m2) | 0.621 | 81.2 | 41.1 | 66.1 | 28.8 | 30.4 |
| BMI z-score | 0.574 | 30.8 | 82.2 | 50.2 | 4.0 | 3.5 |
| TMI (kg/m3) | 0.561 | 75.8 | 42.2 | 63.1 | 18.7 | 18.7 |
| WHtR | 0.565 | 73.3 | 40.9 | 61.2 | 0.59 | 0.62 |
Obesity is a chronic multisystemic disease with a multifactorial aetiology characterised by an excessive accumulation of body fat. In recent years, its incidence in developed countries is reaching epidemic proportions, with obesity becoming a major public health problem with a considerable economic and social impact.24 Childhood obesity tends to persist in adulthood and leads to abnormalities in the blood lipid profile and carbohydrate metabolism, which contribute to the development of high blood pressure and increases the risk of cardiovascular disease and early atherosclerosis and therefore to a lower life expectancy.1,2
Recently, the MHO phenotype has been defined for the purpose of identifying patients with preserved insulin sensitivity and free of metabolic complications.12,15–18 This phenotype is associated with a lower risk of cardiovascular disease and type 2 diabetes in adulthood.25,26 From a functional perspective, patients with MHO have the ability to store excess fat in the subcutaneous adipose tissue, which expands or grows as needed, while in patients with MUO, the subcutaneous adipose tissue does not expand enough and lipids end up accumulating in other body tissues. This is what is known as ectopic fat, found at the level of the liver, pericardium, retroperitoneum, mesentery and perivascular space, among others, also known as visceral fat.27,28 Visceral fat is strongly associated with cardiovascular risk factors such as diabetes, hypertension, non-alcoholic fatty liver, hyperlipidaemias and the link between them, insulin resistance.29 Since it does not include the waist circumference in its definition, which is the main criterion used to define metabolic syndrome,30 the MUO phenotype has a greater discriminative power for identification of patients with insulin resistance with a waist circumference below the P90. The relevance and consequence of early identification of obese patients at cardiovascular and metabolic risk through anthropometric or blood chemistry parameters that are sensitive and accessible to clinicians with the aim of reversing metabolic risk cannot be overstated.
Anthropometry is a key component of the nutritional evaluation of individuals and populations, and the BMI is the parameter used most widely to define weight status and obesity. However, greater diagnostic accuracy is achieved in clinical practice through skin fold measurement and the estimation of body density to indirectly calculate the body fat percentage, although this approach has practical limitations that restrict its use in clinical practice. There is also disagreement as to which BMI/age standards should be used as reference to define the degree of overweight and obesity in children and adolescents, although there is agreement on the need to establish standard values obtained from current populations free of malnutrition and obesity, as the references we use today are biased due to the inclusion of a variable proportion of children/adolescents with overweight and/or obesity.
Recent studies suggest that the TMI provides a better estimate of body fat percentage compared to the BMI in children and adolescents between ages 8 and 18 years, and some authors have proposed using TMI values instead of BMI z-scores.8,9 In Spain, reference BMI and TMI values for age and sex obtained from healthy children without malnutrition or obesity have been published recently.10 These values may be very useful in the clinical evaluation of obesity, especially in prepubertal children and adolescents, as TMI values remain pretty stable in individuals of either sex from ages 8 years to 18 years, and therefore single cut-off points would suffice to identify overweight and obesity, respectively, avoiding more complex mathematical calculations for estimating the degree and severity of obesity. More specifically, a TMI of 13.9 or greater in boys and of 13.8 or greater in girls would identify patients with overweight, while values of 15.4 and greater in boys and of 15.2 or greater in girls would identify obesity in this age group. In addition, our study showed that while the diagnostic accuracy of the TMI is not very high, it allows correct classification of 63% of patients with MUO, with an optimal cutoff of 18.7, and that it performs similarly to the BMI and the WHtR. Patients with MUO have a significantly greater degree of insulin resistance, which highlights the importance of this abnormality in the pathogenesis of metabolic disorders associated with obesity. A recent study designed to establish the predictive accuracy of the TMI for identification of cardiovascular risk markers in a large multiracial sample of children and adolescents aged 6–19 years in Canada found an accuracy that was similar to the one observed in our sample.31 Our study was limited to the Spanish Caucasian population, and therefore its findings should be validated specifically in children and adolescents of other ethnicities and races.
The prevalence of MUO in the study cohort was 62.4%, which was in intermediate to high compared to the prevalence reported by other studies, which ranges between 21.5 and 79.1%.32–34 When we analysed the factors associated most strongly with the classification of cardiovascular risk, we found that older age, male sex and higher BMI z-scores or TMI values were the main contributors, along with the development of insulin resistance. The association with race, waist circumference, the level of physical activity and socioeconomic status seems to be weaker.31,35–39 In this regard, we would like to underscore not only the importance of correctly identifying patients with overweight and obesity, but also the importance of establishing the degree and severity of obesity on account of their significant association with the presence of metabolic complications.4,40 The stratification of patients based on TMI for age standards obtained from populations of individuals free of obesity or malnutrition with a nearly normal distribution and an unchanging standard deviation offers methodological and practical advantages compared to the use of BMI values that vary based on age and sex and require calculation of the z-score.
In short, our study found that the diagnostic accuracy of the TMI for identification of children and adolescents at metabolic risk is similar to the accuracy of the BMI and the WHtR. However, the TMI simplifies and facilitates the classification of patients of either sex aged 8–18 years based on the degree of obesity.
Conflicts of interestThe authors have no conflicts of interest to declare.
We thank Mr Santiago Pérez-Hoyos, a biostatistician and epidemiologist at the Statistics and Bioinformatics Unit of the Institut de Recerca Vall d'Hebron (VHIR) of Barcelona, for his overall support and the statistical analysis.
Please cite this article as: Yeste D, Clemente M, Campos A, Fábregas A, Mogas M, Soler L et al. Precisión diagnóstica del índice de masa triponderal (kg/m3) para identificar el fenotipo de riesgo metabólico en pacientes obesos. An Pediatr (Barc). 2021;94:68–74.
