

Overweight and obesity in childhood and adolescence has grown alarmingly in the last twenty years or so in many countries of Europe, including Spain. This study presents the prevalences of overweight and obesity in 6–9 year-old schoolchildren in 2015, and their associated characteristics.
MethodologyALADINO (Its initials in Spanish for Diet, physical activity, child development and obesity) is a cross-sectional study of a representative sample of 6–9 year-old schoolchildren in Spain, in line with the Childhood Obesity Surveillance Initiative (COSI) of the World Health Organisation (WHO). The height and weight of the participants, defining the weight status according to WHO standards, and a questionnaire was given to the parents on lifestyle and sociodemographic characteristics.
ResultsAnthropometric measurements were taken on 10,899 schoolchildren for 168 primary education centres. Excess weight was observed in 41.3% (95% CI: 40.0−42.6), overweight in 23.2% (95% CI: 22.1−24.3) and obesity in 18.1% (95% CI: 17.2−19.1), with obesity being more prevalent in boys, overweight in girls. The prevalence of abdominal obesity was 23.2% (95% CI: 21.8−24.6). The prevalence of overweight and obesity increased with age. Excess weight decreased by 3.2% compared to 2011, mainly due to the decrease in overweight in boys, while that of obesity remained stable. Excess weight was more prevalent in schoolchildren from families with a lower socioeconomic level.
ConclusionsThe prevalence of excess weight in 6–9 year-old schoolchildren in Spain has decreased by 3.2% since 2011, due to the decrease in overweight, whilst obesity remained stable. Action must be taken in the obesogenic environment, by promoting healthy eating habits and physical activity, bearing in mind the inequalities in health.
El sobrepeso y la obesidad en la infancia y en la adolescencia han crecido alarmantemente en las últimas décadas en muchos países de Europa, incluido España. Este estudio presenta las prevalencias de sobrepeso y obesidad en escolares de 6 a 9 años en 2015 y sus características asociadas.
MetodologíaALADINO es un estudio transversal de una muestra representativa de escolares de 6 a 9 años en España, alineado con la iniciativa COSI de la OMS. Se talló y pesó a los participantes, definiendo la situación ponderal según los estándares de la OMS, y se pasó un cuestionario a los progenitores sobre el estilo de vida y las características sociodemográficas.
ResultadosSe tomaron medidas antropométricas a 10.899 escolares de 168 centros de educación primaria. El 41,3% (IC 95%: 40,0-42,6) presentaba exceso de peso, el 23,2% sobrepeso (IC 95%: 22,1-24,3) y el 18,1% obesidad (IC 95%: 17,2-19,1), siendo la obesidad más prevalente en niños y el sobrepeso en niñas. La prevalencia de obesidad abdominal era del 23,2% (IC 95%: 21,8-24,6). La prevalencia de sobrepeso y obesidad aumentaba con la edad. El exceso de peso disminuyó un 3,2% respecto a 2011, principalmente por la disminución del sobrepeso en niños, mientras que la obesidad permaneció estable. El exceso de peso era más prevalente en los escolares de familias con menor nivel socioeconómico.
ConclusionesLa prevalencia de exceso de peso entre los escolares de 6 a 9 años en España ha disminuido un 3,2% desde 2011 por la disminución del sobrepeso, mientras que la obesidad permanece estable. Se debe intervenir en el entorno obesogénico, promocionando hábitos alimentarios saludables y la actividad física, incidiendo en las desigualdades en salud.
The prevalence of overweight and obesity in children and adolescents has increased at an alarming rate in the past 4 decades in many European countries, including Spain.1 According to the Regional Office for Europe of the World Health Organization (WHO), responsible for implementing the Childhood Obesity Surveillance Initiative (COSI),2 the prevalence of obesity in children aged 6 to 9 years in different countries in the region in the 2012/2013 period ranged from 6% to 28% in boys and 4% to 20% in girls, with a higher prevalence in Southern Europe.3
In Spain, which participates in the COSI, and based on data from the Study for the Surveillance of Growth, Nutrition, Physical Activity, Child Development and Obesity (known as ALADINO, after its Spanish acronym),4 in 2011 the prevalence of overweight in children aged 6–9 years was 26.2% and the prevalence of obesity 18.3%, while the ALADINO 2013 data (in children aged 7 and 8 years) found prevalence of 24.6% for overweight and of 18.4% for obesity.5
Childhood obesity has a negative impact on health both in childhood and adulthood. At the psychological level, obese school-age children exhibit less self-esteem, more sleep disturbances and a higher risk of bullying or social isolation.6 Adults with a history of childhood obesity are more likely to develop cardiovascular disease, insulin resistance and diabetes, musculoskeletal disorders, certain cancers and disability.7 Childhood obesity is an independent risk factor for obesity in adulthood, and the age at onset and duration of obesity are relevant contributors to this risk.8 Early detection of excess weight and its prevention during childhood are essential to reduce its deleterious impact on health and to facilitate maintenance of a healthy weight from childhood and for life.9 Therefore, it is important to closely monitor the weight status of children as well as factors that may promote excessive weight gain or help identify the most vulnerable groups, which can serve as the starting point to implement interventions to fight obesity.
In 2015, the Agencia Española de Seguridad Alimentaria y Nutrición (Spanish Agency of Food Safety and Nutrition, AESAN) carried out the third ALADINO study, whose results we present in this article, following publication of the results of the studies carried out in 2011 and 2013 within the framework of the Strategy on Nutrition, Physical Activity and Prevention of Obesity (known as NAOS, after its Spanish acronym) and more specifically of the Observatory for Nutrition and the Study of Obesity.
The primary objective of the study was to determine the prevalence of excess weight, overweigh and obesity (general and central) in schoolchildren aged 6–9 years in Spain in 2015, by age and sex. As a secondary objective, we described the weight status of schoolchildren in relation to socioeconomic status, level of physical activity and dietary habits.
MethodsGeneral framework of ALADINO studyALADINO is a cross-sectional descriptive study performed on a representative random sample of schoolchildren aged 6–9 years, with proportional representation of each autonomous community, selected from the total population of children enrolled in primary schools (PSs) in Spain, both public and private. Detailed information about the ALADINO study has been published in the past.4,10 The ALADINO 2015 study corresponds to the fourth round of the COSI (the third round in which Spain participated).
The target groups for study and sample size were established by the AESAN according to the COSI protocols,2 which recommend a sample size of approximately 2800 participants for each of the 4 age groups. A sample of 10 899 schoolchildren aged 6–9 years (Table 1) enrolled in 165 PSs was selected by multistage sampling using the PS database of the Ministry of Education, Culture and Sports of Spain, stratifying by autonomous community and population size (4 strata: ≤ 10 000 inhabitants, 10 001–100 000 inhabitants; 100 001–499 999 inhabitants and ≥ 500 000 inhabitants) (first stage). After selecting a PS and obtaining consent from the school administration, one class was selected at random for each form (years 1–4 of primary education) (second stage). An informational letter with an attached questionnaire was sent to the parents or legal guardians of each selected student, who had to sign an informed consent form, and the final sample (third stage) included all schoolchildren of the selected classes for who signed informed consent had been received that attended the PS on the date of the site visit (November 2015–March 2016) and who assented to participation. If participation in a given classroom was low and the sample smaller than expected, the sample in another school in the same stratum and of similar characteristics was expanded to compensate. Children underwent measurement of weight, height and waist following a standardised protocol and calibrated equipment (Tanita UM-076 scale, TANITA Tantoise portable stadiometer, SECA 201 flexible measuring tape). We measured the waist circumference at the midpoint between the iliac crest and the inferior edge of the ribcage during the expiration.11 The families filled out a questionnaire on the lifestyle habits and dietary habits of the child and sociodemographic characteristics of the household. We anonymised the data prior to processing.
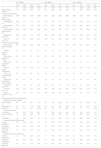
Anthropometric measurements for the total sample and by sex (mean, SD and percentiles).
| n | Mean | SD | P5 | P25 | P50 | P75 | P95 | |
|---|---|---|---|---|---|---|---|---|
| Total | ||||||||
| Weight; kg | 10 899 | 29.8 | 7.8 | 20.2 | 24.1 | 28.2 | 33.8 | 44.9 |
| Height; cm | 10 899 | 129.0 | 8.8 | 115.3 | 122.5 | 128.7 | 135.0 | 144.0 |
| BMI; kg/m2 | 10 899 | 17.7 | 3.0 | 14.1 | 15.5 | 16.9 | 19.2 | 23.5 |
| Waist; cm | 10 890 | 60.2 | 8.0 | 49.8 | 54.5 | 59.0 | 64.5 | 76.0 |
| Waist/height | 10 890 | 0.47 | 0.05 | 0.40 | 0.43 | 0.46 | 0.50 | 0.56 |
| Boys | ||||||||
| Weight; kga | 5532 | 30.0 | 7.8 | 20.5 | 24.4 | 28.4 | 34.0 | 45.5 |
| Height; cma | 5532 | 129.4 | 8.8 | 115.5 | 123.0 | 129.3 | 135.5 | 144.2 |
| BMI; kg/m2 | 5532 | 17.7 | 3.0 | 14.2 | 15.6 | 16.9 | 19.2 | 23.6 |
| Waist; cma | 5528 | 60.6 | 8.1 | 50.2 | 55.0 | 59.0 | 65.0 | 76.0 |
| Waist/heighta,b | 5528 | 0.47 | 0.05 | 0.40 | 0.43 | 0.46 | 0.49 | 0.56 |
| Girls | ||||||||
| Weight; kg | 5367 | 29.5 | 7.7 | 20.0 | 23.8 | 28.0 | 33.5 | 44.5 |
| Height; cm | 5367 | 128.5 | 8.8 | 115.0 | 122.0 | 128.1 | 134.4 | 143.7 |
| BMI; kg/m2 | 5367 | 17.7 | 3.1 | 14.0 | 15.5 | 16.9 | 19.3 | 23.5 |
| Waist; cm | 5362 | 59.8 | 8.0 | 49.2 | 54.0 | 58.5 | 64.0 | 75.0 |
| Waist/heightb | 5362 | 0.47 | 0.05 | 0.39 | 0.43 | 0.46 | 0.50 | 0.56 |
BMI, body mass index; P, percentile; SD, standard deviation.
We calculated the body mass index (BMI) using the weight and height measurements (BMI = weight [kg]/height2[(m2]). We defined the underweight, normal weight, overweight and obesity categories based on the growth standards of the WHO,12 which we used in subsequent comparative analyses. To ensure that the results could be used in comparisons with results based on different standards, we also applied the criteria of the International Obesity Task Force (IOTF)13 and the growth charts of the Fundación Orbegozo (2011).14 In addition, we calculated the waist-to-height ratio (WHtR) and defined central obesity of a WHtR of 0.5 or greater.15
The data were weighted to ensure representation of the population of schoolchildren in Spain. We performed a descriptive analysis with calculation of mean, standard deviation (SD) and percentiles for quantitative variables and absolute frequencies and percentages for qualitative variables (including the prevalence of overweight, obesity and of both combined, or excess weight). We used the chi quare test to analyse the association between qualitative variables and the Student t test to analyse differences between means for independent samples, or, in case the distribution was not normal, the Mann–Whitney U test. To compare more than 2 means, we used analysis of variance (ANOVA), or the Kruskal–Wallis test in case of nonparametric distributions. We defined statistical significance as a p-value of less than 0.05. The statistical analysis was performed with the software SPSS® version 19 and Stata version 16.
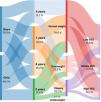
ResultsOf the 242 PSs selected initially, 165 (68.2%) agreed to participate, corresponding to 14 908 eligible schoolchildren, and we obtained consent for participation of 11 297 of these children. We excluded another 398 schoolchildren (we were unable to take measurements for 14 and the other 384 were outside the age range for the study). The final sample of children that underwent anthropometric measurements was of 10 899 pupils (50.8% male) aged 6–9 years (73.1% participation in anthropometric measurements). The distribution of the sample was fairly even between the 8 groups of age and sex, as required by the COSI protocol2 (Fig. 1, Table 1). We received completed questionnaires about dietary and lifestyle habits and sociodemographic characteristics of the household for 10 321 schoolchildren (questionnaire response rate: 94.7% of children that underwent the anthropometric assessment).
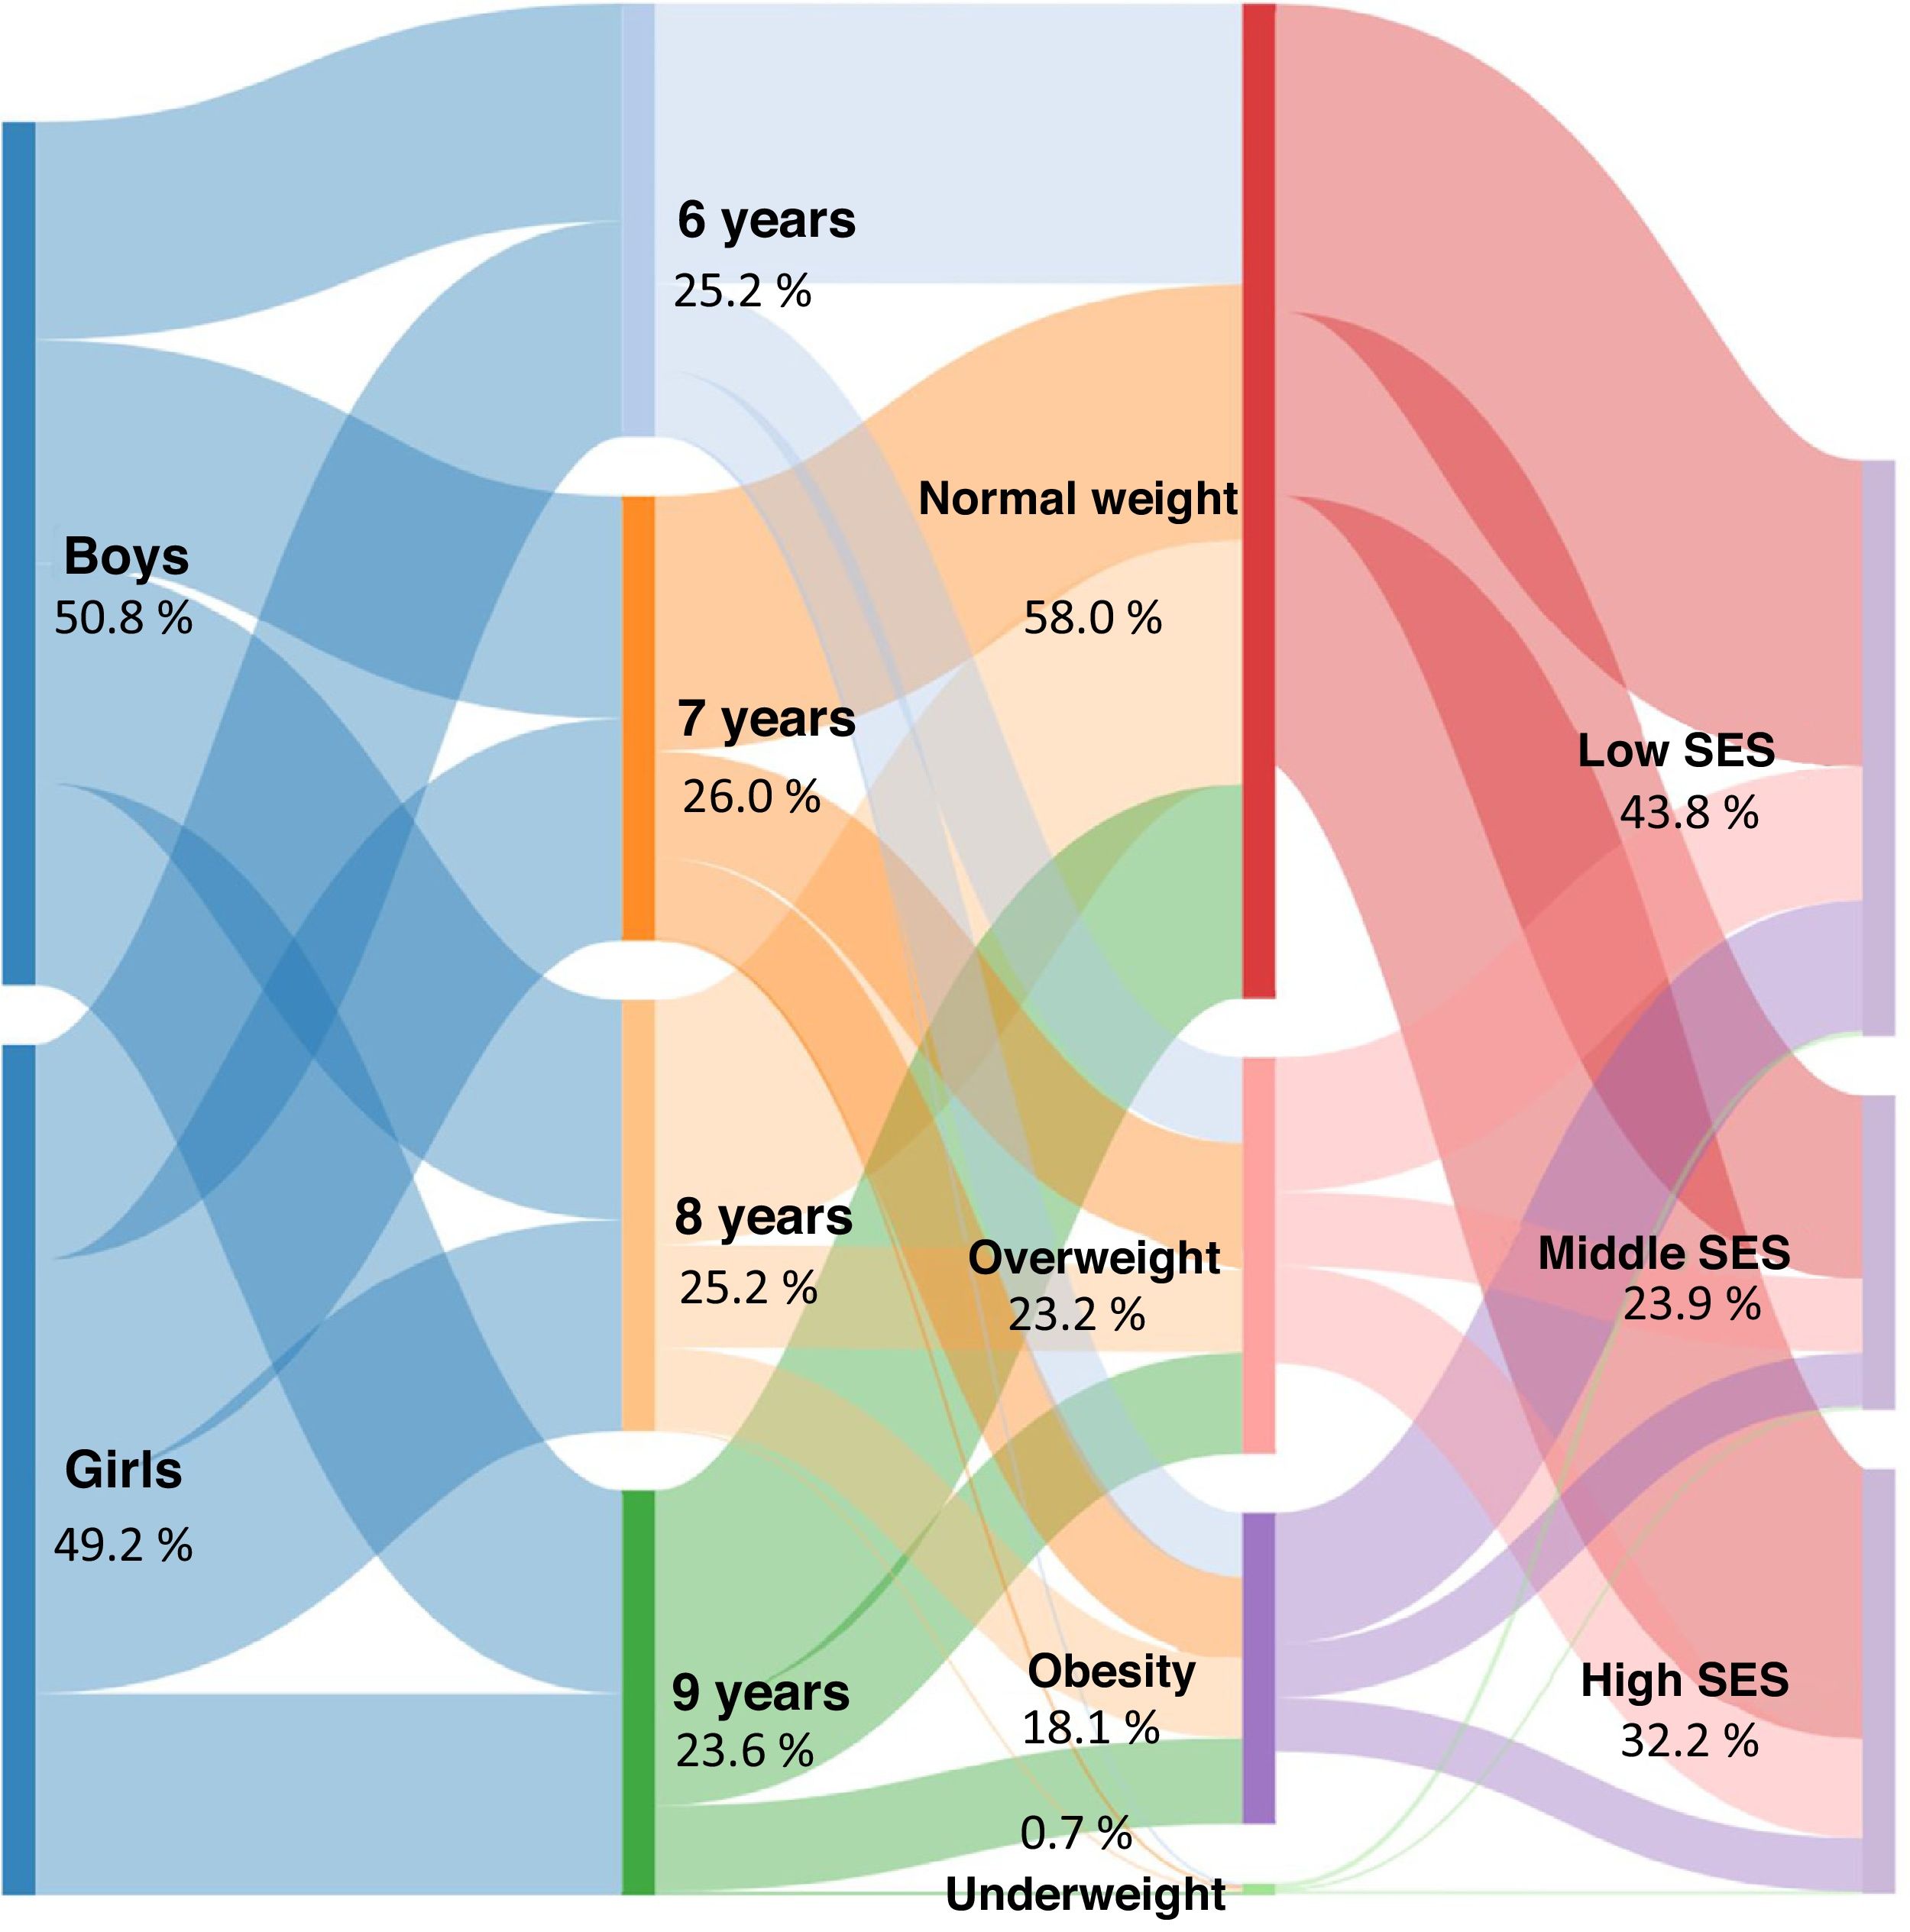
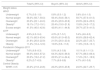
Table 1 summarizes the descriptive data for the sample under study: mean and percentile values of the measurements obtained in the total sample and by sex. The mean weight was 29.8 kg (SD, 7.8) and the mean BMI was 17.7 kg/m2 (SD, 3.0). We found significant differences based on sex in weight, height, waist circumference and the WHtR, which were slightly higher in boys.
When it came to weight status based on the WHO standards, we found that 41.3% of participants (95% confidence interval [CI], 40.0%–42.6%) had excess weight: 23.2% overweight (95% CI, 22.1%–24.3%) and 18.1% obesity (95% CI, 17.2%–19.1%) (Fig. 1, Table 2). General obesity was 4.6% more frequent in boys than girls (P < .05) and overweight was 1.5% more frequent in girls. The prevalence of obesity in schoolchildren aged 6–9 years varied with the applied standard: 18.1% (WHO), 11.2% (IOTF) and 6.2% (Orbegozo 2011). Using the WHO and the Fundación Orbegozo 2011 standards as reference, the prevalence of obesity was greater in boys, whereas applying the IOTF standard it was slightly greater in girls. We found statistically significant differences in weight status between boys and girls based on the WHO and Orbegozo 2011 standards. When it came to central obesity based on the WHtR, we found a prevalence of 23.2%, higher compared to general obesity.
Weight status and central obesity in the total sample and by sex.
| Total% (95% CI) | Boys% (95% CI) | Girls% (95% CI) | |
|---|---|---|---|
| Weight status | |||
| WHO | |||
| Underweight | 0.7% (0.5−1.0) | 0.8% (0.5−1.2) | 0.6% (0.4−1.0) |
| Normal weight | 58.0% (56.7−59.3) | 56.4% (54.6−58.1) | 59.7% (57.9−61.5) |
| Overweight | 23.2% (22.1−24.3) | 22.4% (20.9−23.9) | 23.9% (22.4−25.5) |
| Obesitya | 18.1% (17.2−19.1) | 20.4% (19.0−21.9) | 15.8% (14.5−17.2) |
| Excess weight | 41.3% (40.0−42.6) | 42.8% (41.1−44.6) | 39.7% (37.9−41.5) |
| IOTF | |||
| Underweight | 4.9% (4.3−5.4) | 4.3% (3.7−5.1) | 5.4% (4.6−6.3) |
| Normal weight | 62.1% (60.9−63.4) | 63.6% (61.9−65.3) | 60.6% (58.8−62.4) |
| Overweight | 21.8% (20.8−22.9) | 21.5% (20.0−23.0) | 22.2% (20.7−23.7) |
| Obesity | 11.2% (10.4−12.0) | 10.6% (9.6−11.8) | 11.8% (10.6−13.1) |
| Fundación Orbegozo 2011 | |||
| Underweighta | 7.6% (6.9−8.3) | 5.0% (4.3−5.8) | 10.1% (9.1−11.3) |
| Normal weight | 66.0% (64.8−67.2) | 64.3% (62.6−66.0) | 67.7% (66.0−69.4) |
| Overweighta | 20.2% (19.2−21.2) | 22.9% (21.4−24.4) | 17.4% (16.1−18.9) |
| Obesitya | 6.2% (5.7−6.9) | 7.7% (6.8−8.8) | 4.7% (4.0−5.6) |
| Central Obesity | |||
| WHtR ≥ 0.5 | 23.2% (21.8−24.6) | 22.2% (20.9−23.6) | 24.0% (22.7−25.7) |
CI, confidence interval; IOTF, International Obesity Task Force; WHtR, waist-to-height ratio; WHO, World Health Organization.
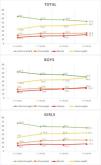
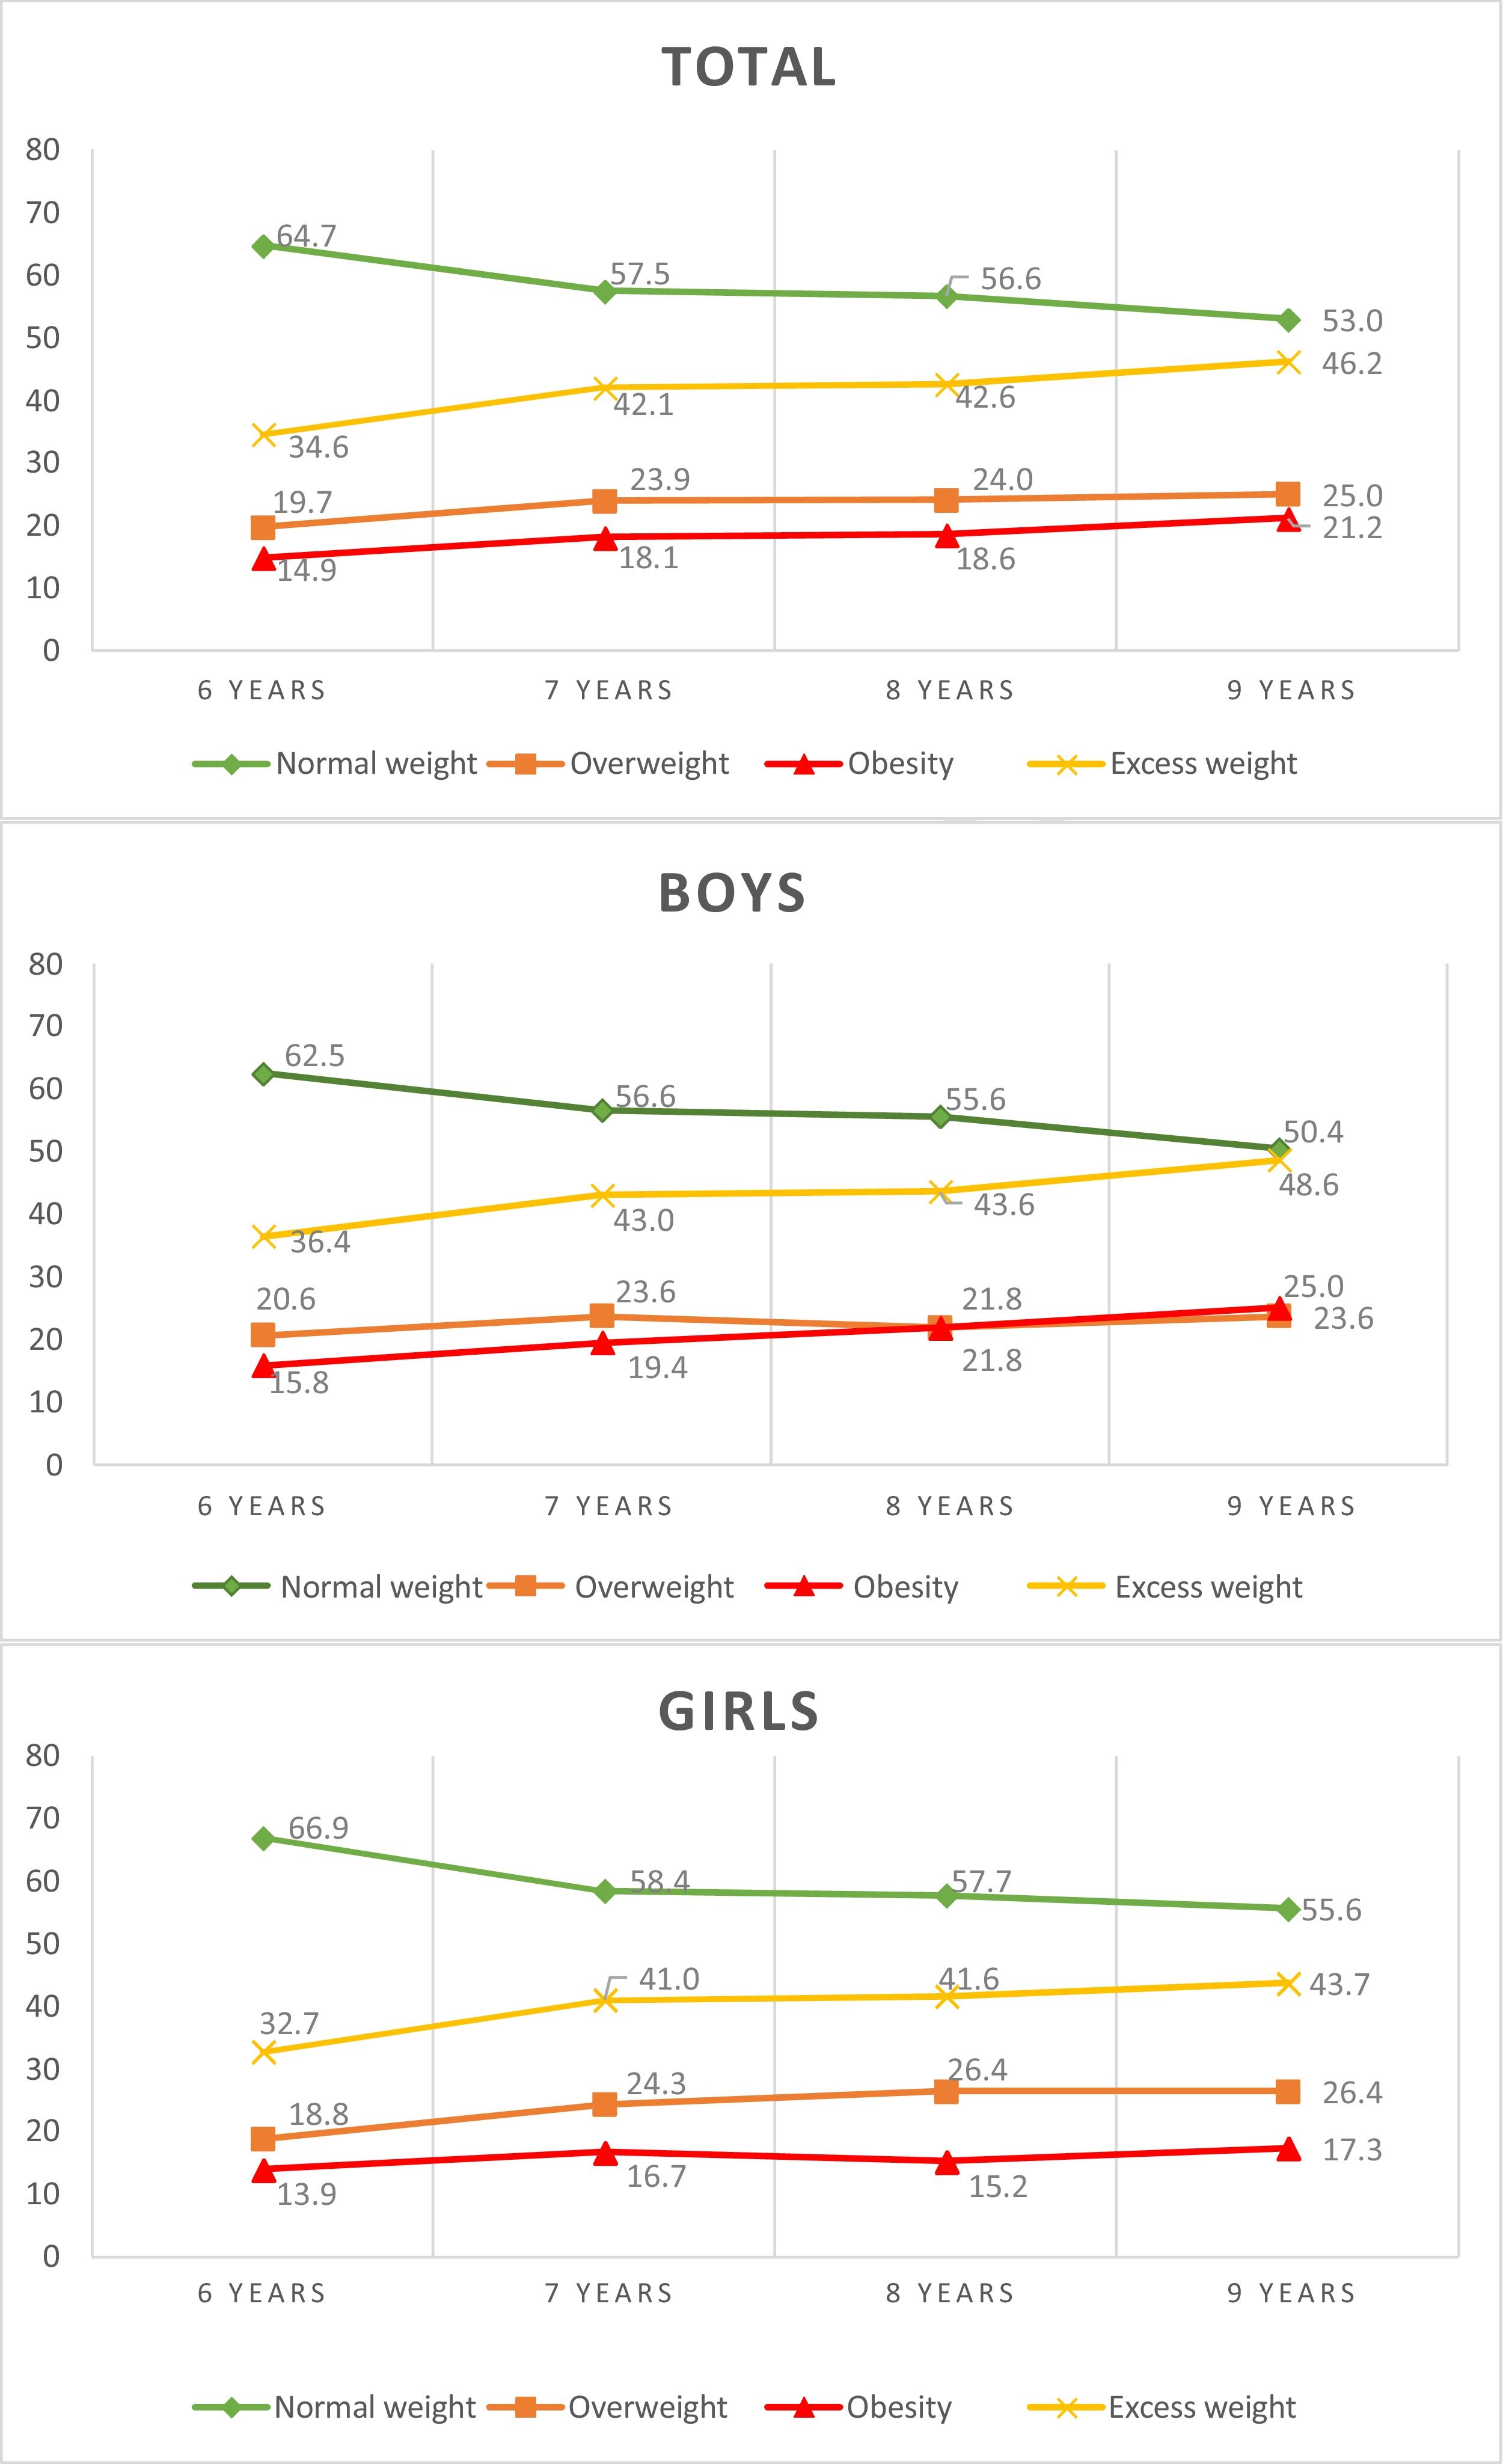
Between ages 6 and 9 years, weight status based on the WHO growth standards worsened with age, with an overall increase in the prevalence of excess weight of 11.6% (3.9% per year of age), and a more pronounced increase between ages 6 and 7 years; obesity increased in frequency by 6.3%, with a slight decrease in girls aged 8 years, while overweight increased by 5.3%, with the highest increase corresponding to children aged 6 and 7 years and a slight decrease in boys aged 7 years (Fig. 2).
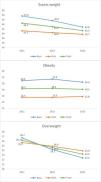
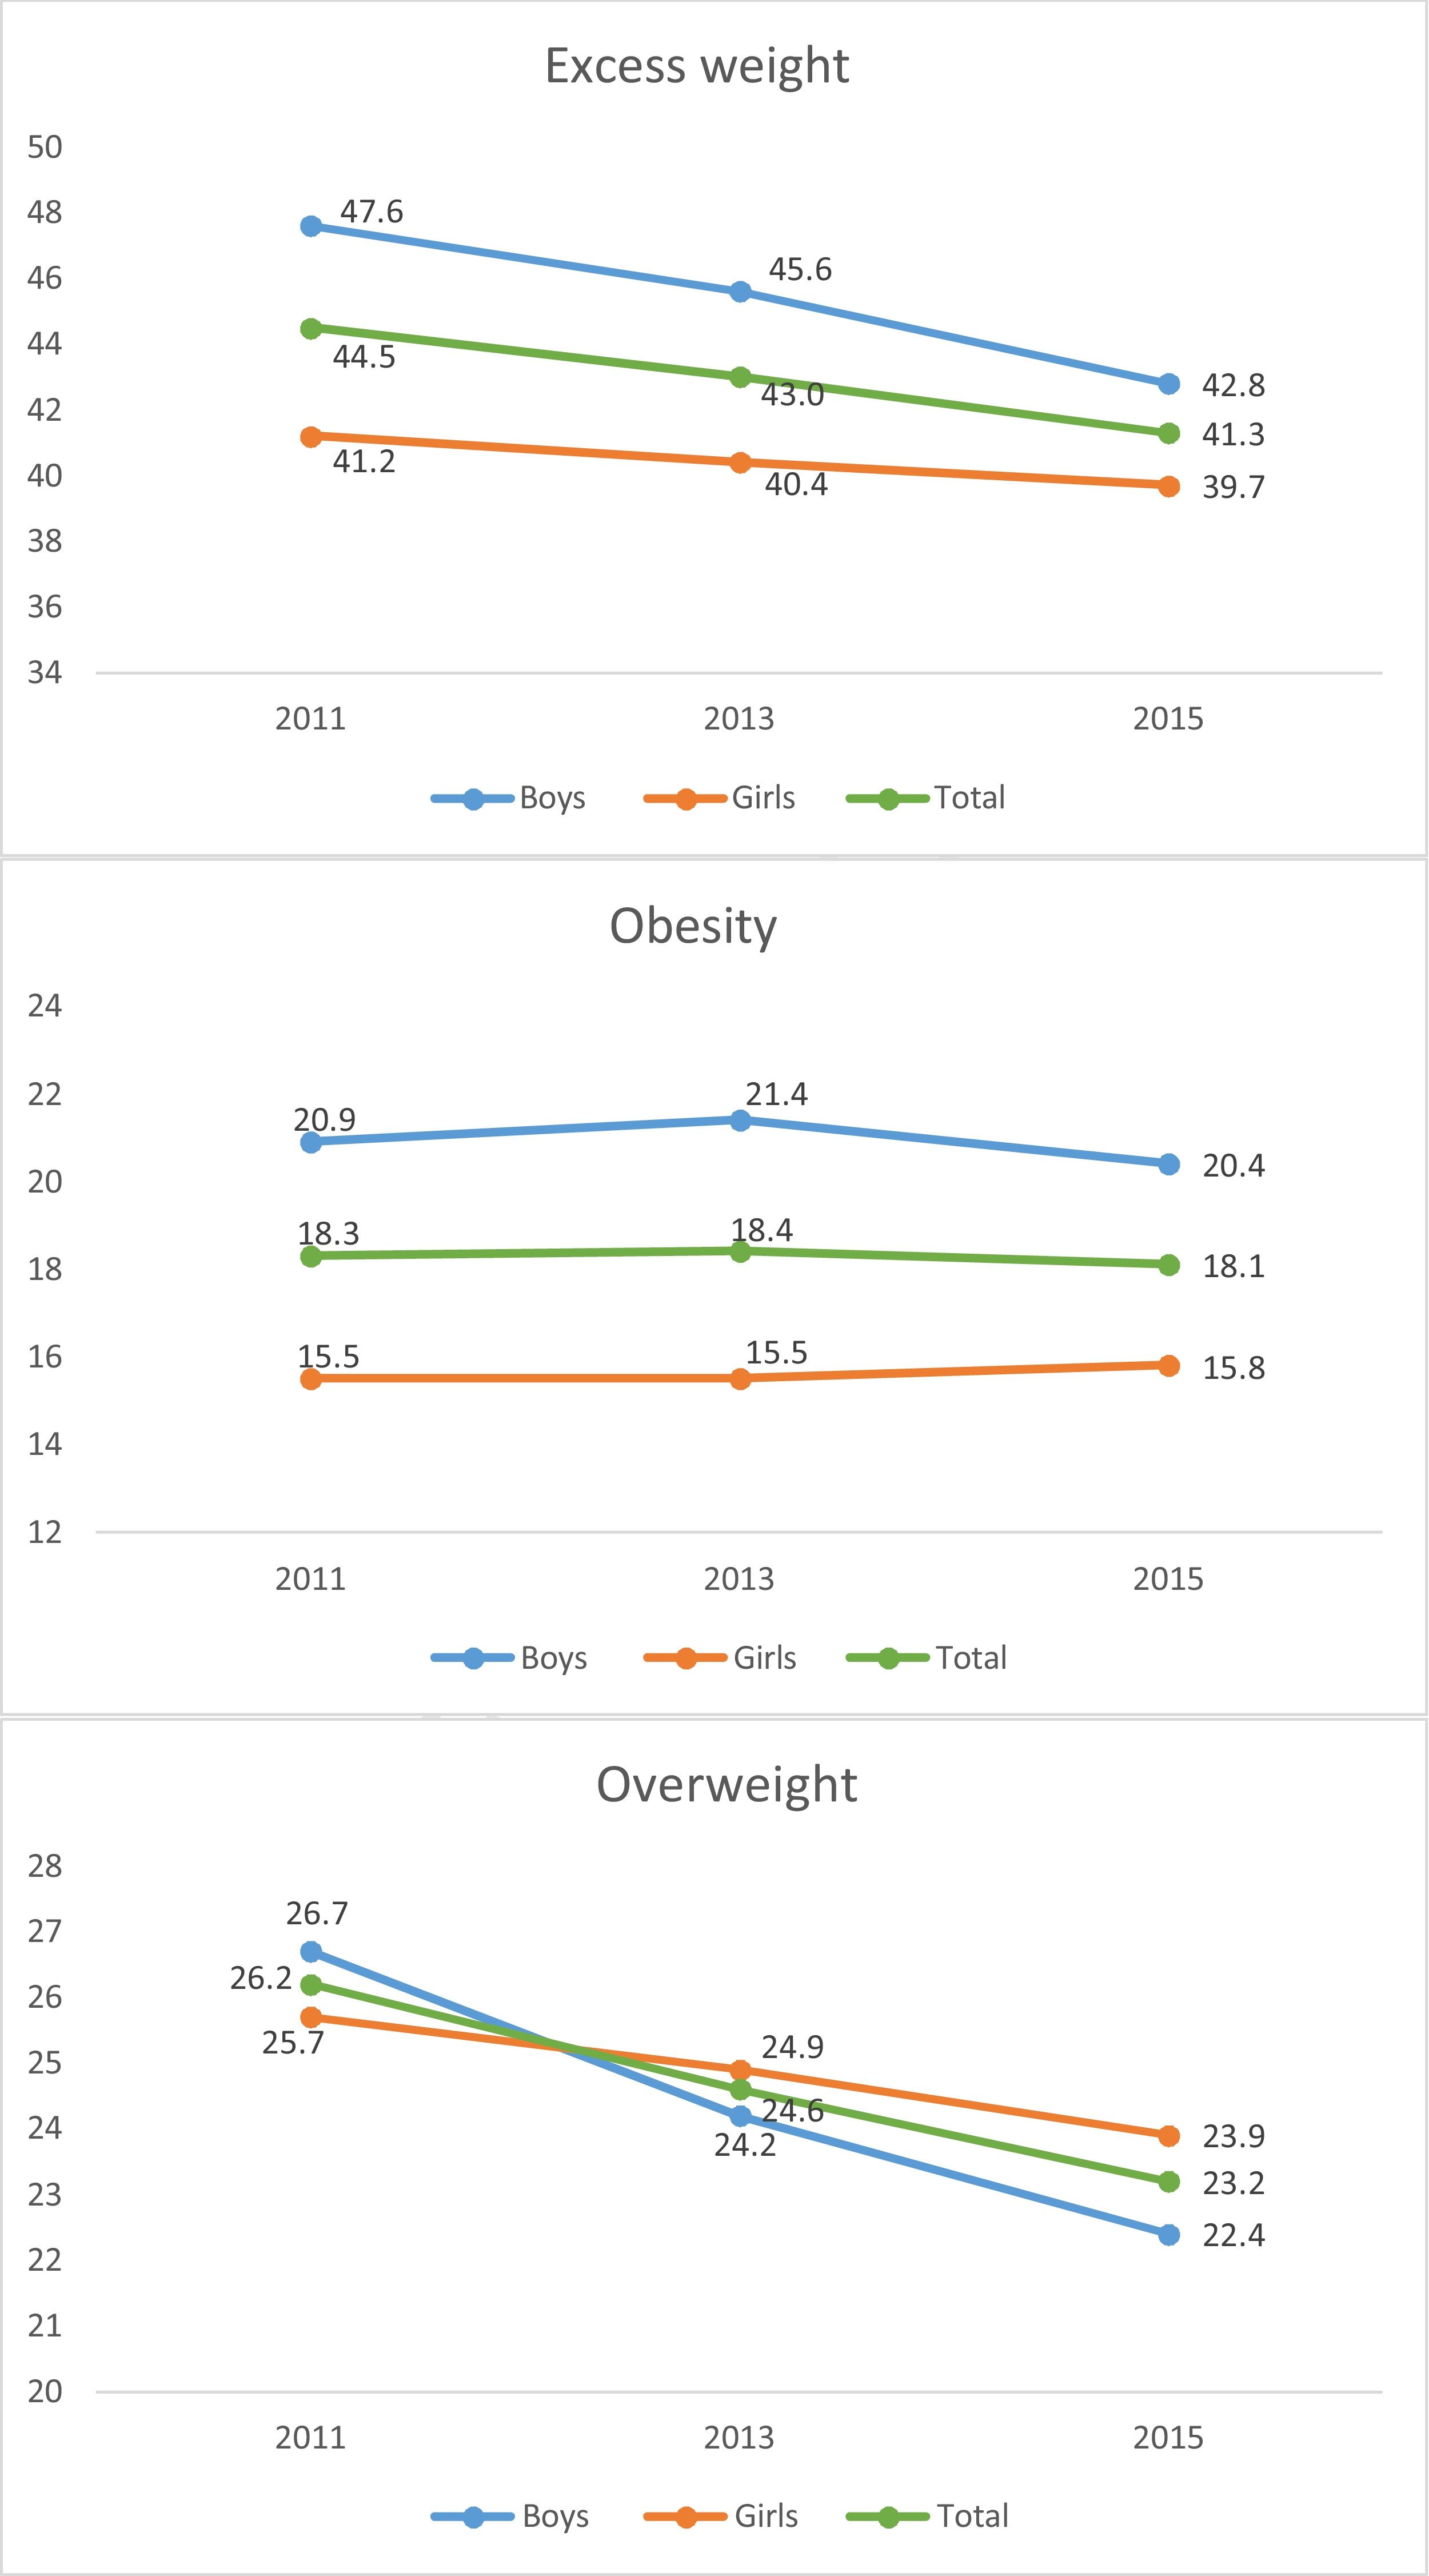
The overall prevalence of excess weight based on the WHO standards in schoolchildren aged 6–9 years decreased by 3.2% (P < .05) between 2011 and 2015, with the sharpest decrease in boys, in whom the prevalence was higher. When it came to obesity based on the WHO standards, we found minimal changes (−0.2% overall, with a slight increase in girls) while the prevalence of overweight based on the WHO standards decreased significantly and persistently by 3%, with a greater decrease in boys (−4.3%), so that the prevalence in 2011 was higher in boys in 2015 higher in girls (Fig. 3). The trends observed in the 2011–2015 period applying the IOTF and the Fundación Orbegozo 2011 charts as reference was similar to the trends observed with the WHO standards, with a decrease in overweight (−2.4% IOTF; −1.4% Fundación Orbegozo 2011) and a stable frequency of obesity (0.2% IOTF; 0.3% Fundación Orbegozo 2011).
When we compared the information reported by parents, we found that schoolchildren with obesity had a higher mean birth weight (boys) and spent more hours doing physical activity, ate at home more frequently and were more likely to have screens in their room (game console and most frequently a television and DVD player; P < .05) (Table 3). Obesity was nearly twice as frequent in schoolchildren from low-income households compared to the high-income group (Fig. 1) and nearly 1.5 times more frequent in schoolchildren whose parents had a low educational attainment compared to those with parents with high educational attainment.
Individual characteristics, dietary habits, physical activity and sleep, screen time and household characteristics by weight status and sex.
| [0,2–5]Total | [0,6–9]Boys | [0,10–13]Girls | ||||||||||
|---|---|---|---|---|---|---|---|---|---|---|---|---|
| UW | NW | OW | OB | UW | NW | OW | OB | UW | NW | OW | OB | |
| n | 76 | 6324 | 2524 | 1976 | 44 | 3094 | 1229 | 1122 | 32 | 3230 | 1295 | 854 |
| Weight status, WHO; % | 0.7 | 58.0 | 23.2 | 18.1 | 0.8 | 56.4 | 22.4 | 20.4 | 0.6 | 59.7 | 23.9 | 15.8 |
| Personal characteristics | ||||||||||||
| Birth weight; g (mean)a | 2900 | 3172 | 3273 | 3298 | 2931 | 3218 | 3336 | 3365 | 2859 | 3128 | 3214 | 3207 |
| Dietary habits | ||||||||||||
| Breastfeeding; %a | 65.4 | 77.2 | 77.6 | 73.7 | 73.4 | 78.2 | 77.4 | 74.4 | 54.6 | 76.2 | 77.9 | 72.8 |
| Had breakfast (boys); %a | 78.4 | 83 | 81.4 | 79.4 | 81.7 | 83.4 | 82.4 | 78.2 | 73.7 | 82.6 | 80.4 | 81.1 |
| Has breakfast daily (parents); %a | 97.9 | 93.9 | 92.9 | 90.2 | 98.1 | 94.3 | 92.9 | 90.1 | 97.5 | 93.6 | 92.9 | 90.4 |
| Breakfast at home; %a | 84.8 | 93.2 | 91.4 | 90.4 | 84.1 | 93.6 | 92.0 | 90.5 | 85.7 | 92.8 | 90.8 | 90.3 |
| Lunch at home; %a | 41.3 | 51.7 | 54.2 | 60.1 | 39.9 | 52 | 53.8 | 60.2 | 43.3 | 51.5 | 54.5 | 60.1 |
| Physical activity and sleep | ||||||||||||
| Extracurricular physical activity; % | 57.9 | 69.3 | 70.4 | 69.2 | 73.6 | 73.6 | 75 | 70.5 | 36.8 | 65.1 | 66.1 | 67.5 |
| Physical activity; h (mean)a | 2.7 | 3.2 | 2.9 | 3.7 | 3.0 | 3.4 | 3.3 | 4.0 | 1.9 | 3.0 | 2.6 | 3.3 |
| Plays during the week; h (mean) | 2.3 | 2.7 | 2.7 | 2.8 | 2.3 | 2.8 | 2.7 | 2.9 | 2.4 | 2.7 | 2.7 | 2.7 |
| Plays on the weekend; h (mean) | 3.3 | 3.6 | 3.7 | 3.8 | 3.3 | 3.6 | 3.8 | 3.8 | 3.4 | 3.6 | 3.6 | 3.7 |
| Sleep; h (mean) | 10.5 | 10.3 | 10.2 | 10.1 | 10.3 | 10.3 | 10.2 | 10.1 | 10.7 | 10.3 | 10.2 | 10.2 |
| Screen time | ||||||||||||
| Screen time on weekdays; h (mean) | 2.1 | 2.4 | 2.4 | 2.5 | 1.9 | 2.5 | 2.5 | 2.5 | 2.3 | 2.4 | 2.3 | 2.5 |
| Screen time on weekend days, h (mean) | 3.6 | 3.2 | 3.3 | 3.4 | 3.5 | 3.3 | 3.3 | 3.4 | 3.7 | 3.2 | 3.3 | 3.4 |
| Computer in room; %a | 3.8 | 7.8 | 9.5 | 12.3 | 0.4 | 8.3 | 9.1 | 11.9 | 8.4 | 7.5 | 10.0 | 12.9 |
| TV/DVD in room; %a | 34.0 | 22.1 | 23.7 | 37.3 | 22.5 | 23.8 | 23.5 | 36.9 | 49.4 | 20.5 | 23.9 | 37.8 |
| Gaming console in room; %a | 20.1 | 12.1 | 13.1 | 19.1 | 32.0 | 16.0 | 18.4 | 22.4 | 4.1 | 8.4 | 8.2 | 14.7 |
| Parental and household characteristics | ||||||||||||
| Weight perceived by parentsa | ||||||||||||
| Normal weight; % | 0.5 | 64.3 | 25.1 | 10.1 | 0.5 | 61.6 | 25.6 | 12.3 | 0.4 | 67.1 | 24.6 | 7.9 |
| Overweight; % | 0.0 | 3.1 | 11.9 | 85.0 | 0.0 | 4.4 | 30.0 | 65.6 | 0.0 | 3.8 | 21.3 | 74.9 |
| Obesity; % | 0.0 | 0.0 | 0.0 | 100.0 | 0.2 | 3.8 | 3.1 | 92.9 | 0.1 | 1.7 | 1.4 | 96.8 |
| Household incomea | ||||||||||||
| < €18 000; % | 0.9 | 53.3 | 23.2 | 22.7 | 1.0 | 52.2 | 21.2 | 25.6 | 0.8 | 54.3 | 25.2 | 19.7 |
| €18 000−30 000; % | 1.0 | 58.3 | 23.6 | 17.2 | 1.1 | 56.0 | 23.1 | 19.7 | 0.9 | 60.5 | 24.1 | 14.6 |
| > €30 000; % | 0.4 | 63.6 | 23.3 | 12.7 | 0.7 | 61.2 | 22.8 | 15.3 | 0.2 | 66.0 | 23.8 | 10.0 |
| Maternal educational attainmenta | ||||||||||||
| Primary education; % | 0.5 | 52.9 | 25.0 | 21.7 | 0.8 | 52.0 | 21.4 | 25.8 | 0.3 | 53.7 | 28.8 | 17.2 |
| Secondary education; % | 0.8 | 55.8 | 23.0 | 20.3 | 0.9 | 55.3 | 21.2 | 22.7 | 0.7 | 56.4 | 24.9 | 18.0 |
| University degree; % | 0.7 | 61.8 | 22.6 | 15.0 | 0.8 | 58.0 | 23.3 | 17.8 | 0.5 | 65.7 | 21.8 | 12.1 |
| Paternal educational attainmenta | ||||||||||||
| Primary education; % | 1.3 | 55.6 | 23.0 | 20.1 | 1.7 | 57.3 | 19.1 | 21.9 | 1.0 | 53.9 | 26.7 | 18.5 |
| Secondary education; % | 0.8 | 57.2 | 22.7 | 19.3 | 0.7 | 54.6 | 22.4 | 22.2 | 0.8 | 59.8 | 23.0 | 16.4 |
| University degree; % | 0.3 | 61.1 | 23.8 | 14.8 | 0.4 | 58.3 | 23.5 | 17.9 | 0.2 | 64.0 | 24.2 | 11.6 |
H, hours; NW, normal weight; OB, obesity; OW, overweight; UW, underweight, WHO, World Health Organization.
In contrast, overall, we found that the proportions of children that had had breakfast on the day of the study, whose parents reported that the child had breakfast daily at home and that had been breastfed were significantly lower in the obesity group.
We did not find significant differences between children with obesity and all other children in the level of physical activity outside of school, the time spent playing and screen time. We found a negative association, although not statistically significant, between weight status and the hours of sleep: the greater the weight, the fewer hours the child slept.
Of the schoolchildren perceived as having normal weight by the parents, 25.1% had overweight and 10.1% obesity, with slightly higher proportions in boys. Similarly, of the children perceived as overweight by parents, 74.9% actually had obesity (Table 3).
DiscussionThis article presents the results on the prevalence of excess weight (overweight and obesity) assessed by the direct measurement of weight and height in a representative sample of schoolchildren aged 6–9 years in Spain in 2015, and other associated variables. Excess weight is a frequent problem experienced by 4 out of 10 schoolchildren aged 6–9 years in Spain, although it decreased by 3.2% between 2011 and 2015,4 mainly on account of a decrease in overweight in boys, while obesity remained stable in both sexes.
A recent nationwide study conducted in Spain in 201916 in a sample of 3887 schoolchildren aged 8–16 years found an overall prevalence of excess weight of 34.9%, although data broken down by age and sex, which have yet to be published, are required to determine whether the differences observed relative to the ALADINO 2015 study are due to an actual decrease in the prevalence of excess weight or can be explained by differences between age groups and sampling methods. The next rounds of the ALADINO study may provide clues about the evolving trends in children aged 6–9 years.
In a broader context, another 2 studies conducted recently have provided data on childhood obesity in the European Region. The first is a review with meta-analysis and the second is the 2015 study WHO Regional Office for Europe (preliminary results), which includes the ALADINO study. Both found a high prevalence of excess weight in Spain, along with other Mediterranean countries, but also a tendency toward stabilization in the Iberian region (Spain and Portugal), consistent with our findings, and in contrast to other countries in the Mediterranean regions, where based on the available data there still seems to be an increasing trend.1,17
The observed prevalence values differed depending on the criteria used for classification. Application of the WHO standards resulted in a higher proportion of obesity and overweight overall and in each sex compared to the IOTF and Fundación Orbegozo references (except for overweight in boys, which was slightly higher using the Fundación Orbegozo reference), with the highest difference observed in obesity, as has been the case in other studies and other countries.18,19 These discrepancies can be explained by differences between the reference populations used to develop the growth charts and cut-off points to identify groups at risk of morbidity and mortality associated with excess weight.20 Although there is no universal consensus on what criteria should be applied to classify the weight status of school-age children, it is considered appropriate to present the results obtained applying different criteria to facilitate comparisons between countries and with previous series.
The prevalence of central or abdominal obesity based on the WHtR was higher compared to general obesity measured by other criteria.19,21 Thus, a percentage of schoolchildren without obesity using the other classification schemes did have central obesity, and in our study this difference was greater in girls. The WHtR is also a good marker of cardiovascular cardiovascular22 and metabolic23 risk. Compared to the waist circumference, the WHtR is a parameter standardised by height that can be compared in different sex, age and ethnic groups, and therefore of easy application in anthropometric assessment. For this reason, several authors recommend the addition to the WHtR calculation to routine weight and height measurements.11,23 Similarly, we found an important increase in overweight and obesity between ages 6 and 7 years, underscoring the need to intervene from an early age to prevent excess weight.
As for dietary habits, fewer schoolchildren with overweight and obesity had breakfast and more of them had breakfast outside the home compared to schoolchildren with normal weight, similar to the findings of previous studies.24 Skipping breakfast may lead to excess weight through the consumption of more energy-dense foods or more frequent eating between meals.25 When it came to breastfeeding, our study found a lower frequency in children with obesity, and the duration of breastfeeding was a relevant factor.26
Other known determinants of childhood obesity are sedentary lifestyles and excessive use of screens, along with low levels of physical activity. In our study we found a significantly greater percentage of schoolchildren that had electronic devices in their rooms (TV/DVD, gaming console, computer) in the overweight and obesity groups, which was consistent with the findings of previous ALADINO rounds and other studies.4,5,27 Longer screen time is associated with a lower level of physical activity, exposure to advertisements of unhealthy foods or overeating while distracted using these devices.28 In our study, the differences in the physical activity estimators were not statistically significant except for the mean number of hours of physical activity, which was greater in children with obesity.
Another well-known fact is the inverse association of the prevalence of obesity with the socioeconomic status of the household and parental educational attainment: obesity is more prevalent in the most disadvantaged homes.29 This inequality is more marked in schoolchildren with obesity than in those with overweight, which may be one of the reasons why the prevalence of overweight decreased, but not the prevalence of obesity. This circumstance highlights the need to take into account this social dimension in the development and implementation of strategies against childhood obesity.30 Another salient finding was the high percentage of parents that underestimated the weight of their children, which may pose a significant barrier to implementing changes aimed to improve weight status in children and adolescents.31
Some of the strengths of our study are the large sample representative of the population of schoolchildren aged 6–9 years in Spain, the high participation rate of both schools and students and families, the study design similar to the designs used in other European countries and previous ALADINO studies, using objective anthropometric measurements taken directly by trained staff and following a shared protocol, which allows comparison of results from different studies. Some of its limitations are its cross-sectional design, on account of which we could not make inferences about causality, and the potential biases associated with self-report questionnaires, although we believe that they are accurate enough after having been used in different rounds of the study with minimal modifications.
In the future, it would be useful to complement prevalence studies with other types of studies and research methods, incorporating objective evaluations of physical activity, qualitative studies of habits, motivations and barriers to change in school-age children and their families, or optimizing the collection of objective anthropometric data by mining health care data systems, such as electronic health records.
Our findings show that there is room for improvement, both at the individual and population levels, through interventions to address childhood obesity supported by an adequate amount of evidence.32 The goal is to transform an obesogenic environment into an environment that promotes healthy habits from public as well as private institutions. Physical activity in children and breastfeeding must be encouraged and facilitated, the availability, access and use of nutritious, safe and sustainable foods must be guaranteed, promoting consumption of fresh foods, especially fruits, vegetables and legumes, to provide healthy and sustainable diets to schoolchildren, and sedentary habits and screen use must be reduced. More generally, in the framework of goals 1, 2 and 3 of the 2030 Sustainable Development Agenda, reducing health inequities and improving the ability of individuals to make choices about their nutrition must be given priority, especially when it comes to the most disadvantaged socioeconomic strata of the population.
ConclusionsExcess weight is a problem that affects 4 out of every 10 schoolchildren aged 6–9 years in Spain. Between 2011 and 2015 there was a 3.2% decrease in the prevalence of excess weight, mainly on account of the decrease in the prevalence of overweight, while the prevalence of obesity remained stable. To prevent obesity and health inequities from an early age, we need to continue developing interventions to promote healthy dietary habits and physical activity and reduce sedentary activities and screen use in schoolchildren, adapting them to the target population.
FundingThe ALADINO 2015 study was funded by the Spanish Agency of Food Safety and Nutrition.
Conflicts of interestThe authors have no conflicts of interest to declare.
Please cite this article as: García-Solano M, Gutiérrez-González E, López-Sobaler AM, Dal Re Saavedra MÁ, Robledo de Dios T, Villar-Villalba C, et al. Situación ponderal de la población escolar de 6 a 9 años en España: resultados del estudio ALADINO 2015. An Pediatr (Barc). 2021;94:366–376.
