Late preterm neonates (born at between 34 and 36 weeks of gestation) account for approximately 6% of all live births and about 75% of preterm newborns in our setting. Furthermore, there is recurrent evidence that their neonatal morbidity—especially respiratory, metabolic and nutritional—and even their mortality are higher than those of children born full term (FT).1,2 Thus, it is to be expected that these children will require more care3,4 and lead to an increased demand for healthcare in the future, with the corresponding increase in the use of economic as well as healthcare resources.
Our aim was to assess the weight and height development and the use of primary care resources in the group of late preterm children, comparing it with the FT population.
We conducted a cross-sectional, retrospective case–control study in an urban health care centre (HCC) located in a neighbourhood of low-to-middle socioeconomic level, staffed by three paediatricians and two nurses and with a caseload of 2800 children.
The target population were children served by the HCC who were born between August 1, 2003 and July 31, 2011, which amounted to a total of 1720 children. The case group consisted of all children that were born late preterm (LPT), the control group consisted of children of the same ages born FT, paired by date of birth. We analysed the data overall and stratified by age.
We studied neonatal variables (gestational age, birth weight, sex, perinatal complications); weight and height development; respiratory, gastrointestinal and ear-nose-throat (ENT) disease variables; vaccinations; number of visits to the paediatrician and the nurse, referrals to specialists, imaging tests and laboratory tests performed.
We performed an initial descriptive analysis (mean and 95% confidence interval for quantitative variables; percentage for qualitative variables), and compared independent variables in both groups by means of the Student's t test or the chi square test. The statistical significance was set at a probability of 5% for the entire study. We performed the analysis using the statistical software SPSS® v. 18.0 for Windows®.
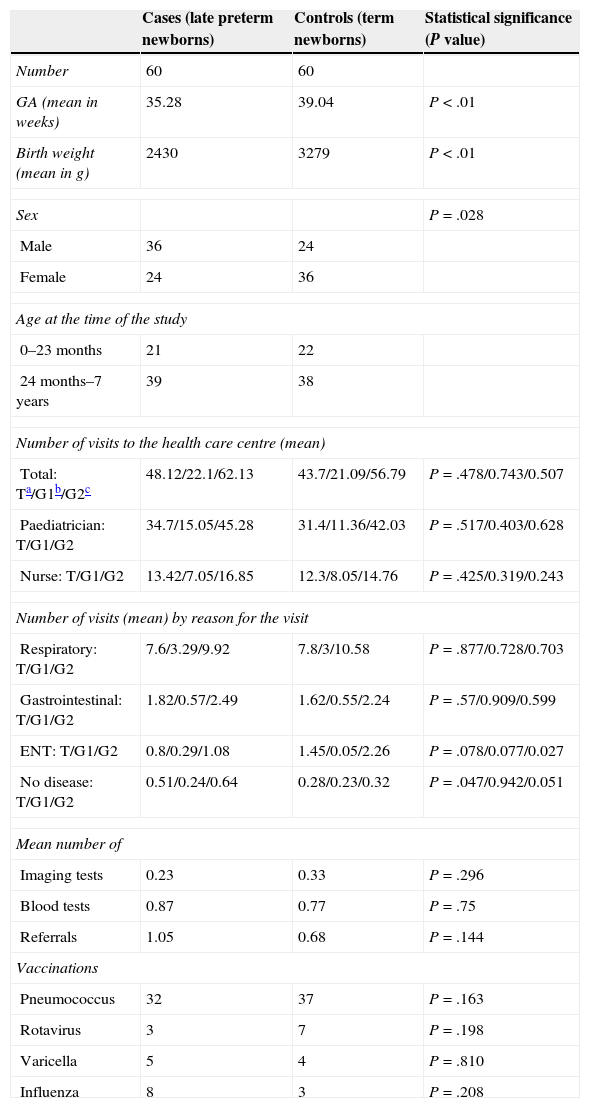
We studied 60 cases and 60 controls. Table 1 presents the data for gestational age, sex, age and use of specific healthcare resources. Fifty-five percent of LPT newborns were admitted to the neonatal units (33% to intermediate care and 22% to intensive care) while only 8% of FT newborns required admission.
Summary of outcomes.
| Cases (late preterm newborns) | Controls (term newborns) | Statistical significance (P value) | |
|---|---|---|---|
| Number | 60 | 60 | |
| GA (mean in weeks) | 35.28 | 39.04 | P<.01 |
| Birth weight (mean in g) | 2430 | 3279 | P<.01 |
| Sex | P=.028 | ||
| Male | 36 | 24 | |
| Female | 24 | 36 | |
| Age at the time of the study | |||
| 0–23 months | 21 | 22 | |
| 24 months–7 years | 39 | 38 | |
| Number of visits to the health care centre (mean) | |||
| Total: Ta/G1b/G2c | 48.12/22.1/62.13 | 43.7/21.09/56.79 | P=.478/0.743/0.507 |
| Paediatrician: T/G1/G2 | 34.7/15.05/45.28 | 31.4/11.36/42.03 | P=.517/0.403/0.628 |
| Nurse: T/G1/G2 | 13.42/7.05/16.85 | 12.3/8.05/14.76 | P=.425/0.319/0.243 |
| Number of visits (mean) by reason for the visit | |||
| Respiratory: T/G1/G2 | 7.6/3.29/9.92 | 7.8/3/10.58 | P=.877/0.728/0.703 |
| Gastrointestinal: T/G1/G2 | 1.82/0.57/2.49 | 1.62/0.55/2.24 | P=.57/0.909/0.599 |
| ENT: T/G1/G2 | 0.8/0.29/1.08 | 1.45/0.05/2.26 | P=.078/0.077/0.027 |
| No disease: T/G1/G2 | 0.51/0.24/0.64 | 0.28/0.23/0.32 | P=.047/0.942/0.051 |
| Mean number of | |||
| Imaging tests | 0.23 | 0.33 | P=.296 |
| Blood tests | 0.87 | 0.77 | P=.75 |
| Referrals | 1.05 | 0.68 | P=.144 |
| Vaccinations | |||
| Pneumococcus | 32 | 37 | P=.163 |
| Rotavirus | 3 | 7 | P=.198 |
| Varicella | 5 | 4 | P=.810 |
| Influenza | 8 | 3 | P=.208 |
GA, gestational age; ENT, ear-nose-throat.
The total number of visits ranged between 4 and 154, with a mean of 48.1 visits for LPT children (22.1 in children up to 23 months of age), and 43.7 for children born FT (21.1 in children up to 23 months of age). However, we did not find statistically significant differences between cases and controls in the use of HCC resources: neither in the number of paediatrician and nurse visits, nor in the request for diagnostic tests or the referrals to specialists. There were also no differences in the number of referrals for respiratory, gastrointestinal or ENT problems. Meanwhile, LPT children did make a greater number of visits to the HCC in which there was no apparent disease.
The pneumococcal vaccination coverage was 53.3% in LPT children and 61.6% in FT children; the rotavirus vaccine was administered to 5% of the case group versus 11.6 of the control group; the varicella vaccine was given to 8.3% and 6.6%, respectively; and the influenza vaccine to 13.3% versus 5%. None of these differences were statistically significant.
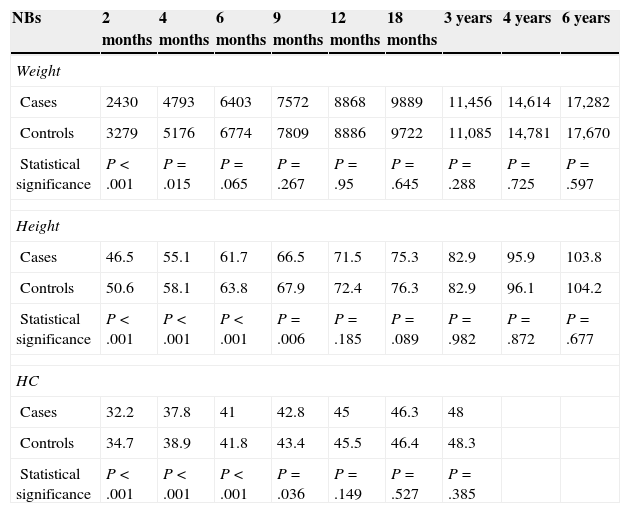
As expected, we found statistically significant differences in weight, height and head circumference at the time of birth, which stopped being significant for weight at 4 months, and for height and head circumference at 9 months (Table 2).
Evolution of the mean somatometric values at different time points.
| NBs | 2months | 4months | 6months | 9months | 12months | 18months | 3years | 4years | 6years |
|---|---|---|---|---|---|---|---|---|---|
| Weight | |||||||||
| Cases | 2430 | 4793 | 6403 | 7572 | 8868 | 9889 | 11,456 | 14,614 | 17,282 |
| Controls | 3279 | 5176 | 6774 | 7809 | 8886 | 9722 | 11,085 | 14,781 | 17,670 |
| Statistical significance | P<.001 | P=.015 | P=.065 | P=.267 | P=.95 | P=.645 | P=.288 | P=.725 | P=.597 |
| Height | |||||||||
| Cases | 46.5 | 55.1 | 61.7 | 66.5 | 71.5 | 75.3 | 82.9 | 95.9 | 103.8 |
| Controls | 50.6 | 58.1 | 63.8 | 67.9 | 72.4 | 76.3 | 82.9 | 96.1 | 104.2 |
| Statistical significance | P<.001 | P<.001 | P<.001 | P=.006 | P=.185 | P=.089 | P=.982 | P=.872 | P=.677 |
| HC | |||||||||
| Cases | 32.2 | 37.8 | 41 | 42.8 | 45 | 46.3 | 48 | ||
| Controls | 34.7 | 38.9 | 41.8 | 43.4 | 45.5 | 46.4 | 48.3 | ||
| Statistical significance | P<.001 | P<.001 | P<.001 | P=.036 | P=.149 | P=.527 | P=.385 | ||
HC, head circumference; NBs, newborns.
Unlike what we expected, the use of primary care resources by LPT children in our series was no different than that by their FT peers. The immaturity of LPT newborns was not associated with a higher frequency of infectious processes or evaluated paediatric disease. Although they were being followed up more closely and they did visit the HCC more often, probably due to a higher level of worry in the parents, this did not result in a greater number of diagnostic tests or referrals to specialists. The results we obtained may have been somewhat biased by the heterogeneity in age within the sample and the potential variability of care between paediatricians.
We should put in context the lack of significant differences in vaccination coverage between groups, keeping in mind that there have been many changes in the immunisation schedule during the period under study.5,6
Please cite this article as: López Martínez A, Mantecón Fernández L, González Álvarez CE, Arias Llorente RP. Consumo de recursos sanitarios en atención primaria de los prematuros tardíos. Estudio caso-control en un centro de salud urbano. An Pediatr (Barc). 2015;83:213–215.
