


The fat mass (FM) is greater in late preterm than full term infants at 1 month post birth, which may be an additional risk factor for metabolic syndrome in adulthood.
ObjetivesTo evaluate body composition (BC) in late preterm infants using bioelectrical impedance analysis (BIA) to determine which anthropometric parameters are associated with BC. Our hypothesis was that weight-for-length is associated with the length-normalized fat mass index (FMI) at 1 year of life.
Materials and methodsWe carried out a prospective cohort study in 2 groups: late preterm infants and full term infants. We obtained BC data by BIA. We calculated the fat mass (FM), FMI, fat-free mass (FFM) and length-normalized fat-free mass index (FFMI) at 1, 6 and 12 months of life. After, we assessed the association of the FMI with anthropometric parameters using multiple linear regression analysis.
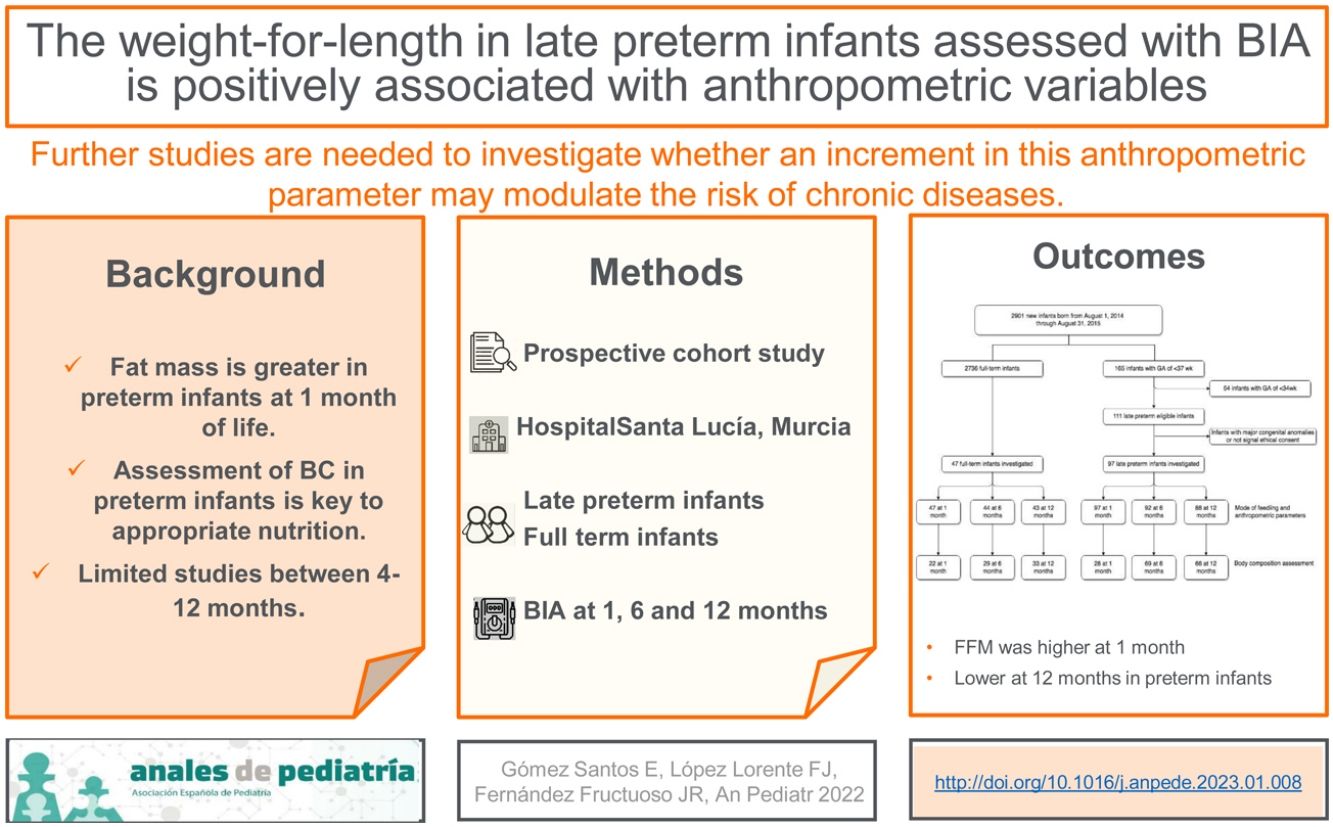
ResultsThe study included 97 late preterm and 47 full term infants, although at 12 months of life, the BC assessment was performed on 66 and 33 infants, respectively. Late preterm infants, compared to full term infants, had a higher FFM at 1 month (4013 vs 3524 g), a higher weight velocity at 6 months (5480 g versus 4604 g) and a lower FFM (7232 vs 7813 g) and FFMI (12.55 vs 13.26) at 12 months of life. The multivariate regression analysis showed that the weight-for-length z-core at 12 months was positively associated with the FMI at 12 months in all infants.
ConclusionThe weight-for-length z-score at 12 months is strongly associated with the FMI at 1 year of life. Further studies are needed to investigate whether an increment in this anthropometric parameter may modulate the risk of chronic diseases.
La masa grasa es mayor en lactantes pretérmino tardíos que en lactantes nacidos a término al mes de vida y esto podría ser un factor de riesgo adicional para el síndrome metabólico en la vida adulta.
ObjetivosPara evaluar la composición corporal (CC) en prematuros tardíos utilizamos el análisis de impedancia bioeléctrica (BIA) y buscamos determinar qué parámetro antropométrico está asociado con la CC. Nuestra hipótesis es que el peso para la longitud está asociado con el índice de masa grasa (IMG) normalizado por longitud al año de vida.
Materiales y métodosRealizamos un estudio de cohortes prospectivo con dos grupos: prematuros tardíos y nacidos a término. Los datos de CC se midieron mediante BIA. Se calcularon la masa grasa (MG), el índice de masa grasa (IMG), la masa libre de grasa (MLG) y el índice de masa libre de grasa (IMLG) normalizado por talla a los 1, 6 y 12 meses de vida. Luego determinamos la asociación del IMG con los parámetros antropométricos mediante un análisis de regresión lineal múltiple.
ResultadosIncluimos 97 prematuros tardíos y 47 nacidos a término, aunque la evaluación de CC se realizó en 66 y 33 a los 12 meses de vida. Al mes, el contenido de MLG fue mayor en los recién nacidos prematuros tardíos (4013 frente a 3524 g); a los 6 meses, tuvieron una mayor velocidad de incremento de peso (5480 g versus 4604 g) y a los 12 meses de vida, el contenido de MLG y el IMLG de los recién nacidos prematuros tardíos fue menor que el de los recién nacidos a término (7232 versus 7813 g; 12,55 versus 13.26). Según el análisis de regresión multivariable, la puntuación z del peso para la talla a los 12 meses se asoció positivamente con el IMG a los 12 meses en todos los lactantes.
ConclusiónLa puntuación z del peso para la talla a los 12 meses está estrechamente relacionada con el IMG al año de vida. Se necesitan más estudios para investigar si un incremento en este parámetro antropométrico puede modular el riesgo de enfermedades crónicas.
The American Academy of Pediatrics has indicated that preterm infant growth should resemble intrauterine foetal growth in order to achieve an optimal postnatal development,1 but this may lead to overfeeding to prevent or treat extrauterine growth restriction.2 The International Fetal and Newborn Growth Consortium for the 21 st Century project (INTERGROWTH-21, a multicentre population-based study conducted between 2009 and 2014 in 8 locations across the world) suggested that lowering the targets for postnatal weight gain in preterm infants could be beneficial, although this recommendation has not been widely adopted yet.3 The total weight gain, the clinical parameter used most widely to guide nutritional management in preterm infants, does not differentiate between proportionate or disproportionate gains in FM and lean mass. The separate assessment of FFM and FM provides a more accurate estimation of nutritional status than total weight. In infants, the length-normalized FM and FFM indices (FMI and FFMI) may be useful for comparing the BC of individuals with different lengths, particularly in preterm infants.4 More recently, evidence has emerged that the BC is also abnormal in preterm infants, with a higher fat mass (FM) and a lower fat-free mass (FFM) than their term counterparts.1,2 In addition, the BC may vary based on whether the infant is breastfed or formula-fed in early life, and that it depends on gestational age (GA) (preterm vs full term).5–7
The optimum pattern of growth remains unclear, with apparent pitfalls for rapid early growth as well as growth failure. Nevertheless, there is relevant evidence that growth quality in terms of BC is as important as growth quantity. Understanding how to assess BC in preterm infants in early life is therefore key to determine the appropriate nutritional interventions required for optimal growth and future outcomes.8
Bioelectrical impedance analysis (BIA) is an indirect method of BC analysis, a non-invasive and portable measure that can be safely applied in neonates and infants, with no need for blood sampling or excessive handling of some fragile babies.1 The basis of the analysis is to pass a weak alternating frequency electrical current through the subject. Then, the impedance to the flow current is measured. Body water is the main conductive volume in humans, and therefore BIA measurements will reflect total body water (TBW). As almost the entire TBW is found in the FFM, BIA can be used to estimate FFM using a prediction equation that converts impedance values into an estimates of the FFM, usually with a combination of height, weigth, sex and age values.1,8 The advantages are: simple and quick measurements, low cost, reproducibility of measurements and low interobserver error.9,10 The interpretation of BIA is based on the assumption that fat is non-conductive, but given the increased vascularity and higher water content of fat in early life, this may not be accurate. Movement artifact is also difficult to eliminate in infants, which affects accuracy. The results of BIA are also influenced by size, sex and disease states, and moreover, studies have used a variety of frequencies, models and electrode placements, so that results cannot be generalised. The appeal of BIA is the cost and portability of the technology. Although more validation studies are needed to establish appropriate reference values for BC, BIA is sufficiently reliable for use in studies of BC during infancy, even if it is not yet ready for routine clinical application.8 Accuracy can be improved by adhering to standardized measurement protocols and ensuring accurate length measurements.1
In most studies, compared to term infants, late preterm infants had higher FM and FMI values at full-term corrected age and 1 month of corrected age, whereas no differences were found at 3 months of corrected age,11–16 and few studies have been published that explored differences in BC between preterm and term infants between 4 and 12 months of life. Furthermore, the study by Villar et al. showed that FFM deposition plays a key role in foetal weight changes during late pregnancy and the simple weight/length ratio at birth by GA is a better predictor of BC parameters than the body mass index (BMI) or the ponderal index due to its stronger correlation to both body fat (BF) and FFM.17
The aim of our study was to describe changes in BW, FM and FFM in late preterm infants in the first 12 months of life by means of BIA, and to assess which anthropometric parameter is associated with BC at 1 year of life. Our hypothesis was that the weight-for-length z-score is associated with FMI at 1 year of life.
MethodsWe conducted a prospective cohort observational study in a neonatal care unit of the Hospital General Universitario Santa Lucía (Cartagena, Spain) betweeen 2014 and 2015.
Infants were recruited at birth and evaluated at 1, 6 and 12 months of life (using the corrected age for late preterm infants).
The study was approved by the Clinical Research Ethics Committee of the hospital (file TI 14/15) and we obtained written informed consent from the parents to the participation of the infants.
The groups under study were late preterm infants and full term infants, all born in the Hospital General Universitario Santa Lucía in Cartagena, Spain.
Of all the newborns admitted to the neonatal care unit between August 2014 and August 2015, 97 late preterm infants participated in the study. The reference group consisted of a convenience sample of 47 full term infants. The inclusion criteria were: birth from 34+0/7 to 36+6/7 weeks of gestation for late preterm infants and 37+0/7 to 41+6/7 weeks of gestation for full term infants. The exclusion criteria were: major congenital disease, chromosomal abnormality, severe cardiac, neurologic, renal, endocrine, gastrointestinal or infectious disease, or lack of signed informed consent by the parents or guardians.
Once we had obtained consent, we collected information from the health records on the sex and GA of the infant and maternal BMI and gestational weight gain, and on the feeding modality (breastfeeding or formula feeding) in the first 2 days of life and at each study timepoint as reported by parents.
All anthropometric measurements were obtained with the patient unclothed.
The weight, supine length and head circumference were measured at birth, 1 month, 6 months and 12 months post birth. Weight was measured with an electronic scale accurate to the nearest 10 gr (SECA scale) and the body length with a SECA infantometer accurate to the nearest 1 mm. The head circumference was measured with a to the nearest 1 mm using a non-strech measuring tape. We calculated growth indicators using the Olsen growth curves for newborns and the WHO child growth standards for infants, including weight-for-length and weight velocity z-scores.18,19 We converted anthropometric measurements were to z-scores using the LMS method (Cole and Green).20
The BC was assessed using the BIA 101 impedance analyser (Akern, Florence, Italy). It is a non-invasive and portable device based on electrode placement. Measurements of BC were made with infants clothed, but without gloves or socks, 2 hours after feeding, and at a room temperature of 27 °C. The measurement was taken, and repeated if there were artifacts or erroneous values. We used a generic reference equation obtained in older children and adults.21
The FM and FFM were then normalized for length to obtain the FM and FFM indexes (fat-mass/length2 and fat-free mass/length2).
Statistical analysisWe calculated the mean and standard deviation (SD) for continuous variables and absolute frequencies and percentages for categorical variables. We compared categorical data with the χ2 test and continuous data by means of the Student t test or the nonparametric Mann-Whitney U test depending on whether the data followed a normal distribution. First, we assessed which predictors were associated with the FMI at 12 months (sex, feeding modality, GA [late preterm vs full term], and anthropometric variables) by means of univariate linear regression analysis. A sensitivity analysis was conducted on the stratified sample. We calculated the Pearson correlation coefficient to measure the linear association between anthropometric variables such as the weight-for-length z-score and weight velocity z-score (0−12 months) and the FMI at 12 months. We also assessed the association of FMI with anthropometric quantitative variables by fitting a multiple linear regression model (Enter method), including all covariates with P values of less than 0.05, after excluding multicollinearity by means of the tolerance test. The analyses were performed with the statistical package SPSS version 21 (SPSS Inc, Chicago, Illinois, USA). We set the level of statistical significance at 0.05.
ResultsThere were a total 165 preterm births, including 111 late preterm and 54 before 34 weeks of gestation. A total of 97 late preterm infants and 47 full term infants underwent the assessment at 1 month of life, 92 and 44, respectively, at 6 months, and 88 and 43, respectively, at 12 months (for a flowchart of the study sample, see Fig. 1 online). Table 1 online presents the maternal and baseline infant characteristics at birth. None of the infants required diuretic agents or mechanical ventilation. Body composition was assessed by BIA, with no evidence of adverse events, and had to be repeated in 20% of the infants on average due to a previous failed measurement. The procedure lasted approximately 3 minutes.
.")
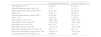
Maternal and baseline infant characteristics in the final sample.
| Late preterm infants (N = 97) | Full term infants (N = 47) | |
|---|---|---|
| Twin pregnancy, n (%) | 32 (33%)* | 2 (4.3) % |
| Maternal weight gain (kg), mean ± SD | 11 ± 7 | 11.4 ± 5 |
| Maternal body mass index, median (IQR) | 23 (21−28) | 24 (22−27) |
| Males, n (%) | 59 (61%) | 22 (47%) |
| Gestational age (weeks), median (IQR) | 35 (34−36)* | 40 (39−41) |
| SGAa, n (%) | 16 (16.5%) | 6 (12.8%) |
| Birth weigth (g), mean ± SD | 2384 ± 440* | 3354 ± 503 |
| Birth weight z-score, mean ± SD | –0.29 ± 0.89 | –0.20 ± 0.89 |
| Birth length (cm), mean ± SD | 45.6 ± 2.3* | 49.7 ± 1.7 |
| Birth length z-score, mean ± SD | –0.34 ± 0.79 | –0.44 ± 0.53 |
| Birth head circumference (cm), mean ± SD | 32 ± 1.3* | 34 ± 1.4 |
| Birth head circumference z-score, mean ± SD | –0.06 ± 0.76 | –0.05 ± 0.81 |
| Formula feeding in first two days, n (%) | 61 (63%)* | 18 (38%) |
IQR, interquartile range; SD, standard deviation; SGA, small for gestational age.
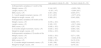
At the time of the first assessment, late preterm infants had higher BMI, BMI z-score, weight-for-length and weight velocity z-scores than full term infants. When it came to BC, the FFM (g) was significantly higher in late preterm infants than in full term infants in the first month of life, whereas the FM and FMI were similar (Table 2).
Infant feeding modality, anthropometric and body composition measurements at each time point.
| Late preterm infants (N = 97) | Full-term infants (N = 47) | |
|---|---|---|
| At 1 month of life | ||
| Exclusive breastfeeding, n (%) | 28 (29%) | 19 (40%) |
| Mixed feeding, n (%) | 32 (33%) | 12 (25%) |
| Exclusive formula feeding, n (%) | 37 (38%) | 16 (34%) |
| Weight (g), mean ± SD | 4556 ± 661 | 4360 ± 649 |
| Weight z-score, mean ± SD | 0.263 ± 1 | 0.008 ± 1 |
| Length (cm), mean ± SD | 54 ± 2.5 | 54 ± 2.4 |
| Length z-score, mean ± SD | –0.06 ± 1.3 | 0.08 ± 1.2 |
| Head circumference (cm), mean ± SD | 37.7 ± 1.2 | 37.6 ± 1.4 |
| Head circumference z-score, mean ± SD | 0.63 ± 1.02 | 0.64 ± 1.12 |
| BMI (kg/m2), mean ± SD | 15.4 ± 1.6* | 14.7 ± 1.3 |
| BMI z-score, mean ± SD | 0.44 ± 1.1* | –0.06 ± 1 |
| 0−1 month weight velocity (g), mean ± SD | 2172 ± 573* | 1005 ± 551 |
| 0−1 month weight velocity z-score, mean ± SD | 2.97 ± 2* | −1.15 ± 2 |
| Weight-for-length z-score, mean ± SD | 0.45 ± 1.2* | –0.14 ± 1 |
| Fat mass (%), mean ± SDa | 15.7 ± 8.7 | 16.7 ± 9.4 |
| Fat mass (g), mean ± SDa | 755 ± 453 | 691 ± 459 |
| Fat mass index (kg/m2), mean ± SDa | 2.42 ± 1.41 | 2.55 ± 1.52 |
| Fat-free mass (g), mean ± SDa | 4014 ± 638* | 3524 ± 456 |
| Fat-free mass index (kg/m2), mean ± SDa | 12.94 ± 1.53 | 12.30 ± 1.21 |
| At 6 months of life | ||
| Late preterm infants (N = 92) | Full term infants (N = 44) | |
|---|---|---|
| Months of exclusive breastfeeding, median (IQR) | 3 (0−7) | 2 (1−6) |
| Weight (g), mean ± SD | 7870 ± 1083 | 7974 ± 792 |
| Weight z-score, mean ± SD | 0.141 ± 1.13 | 0.386 ± 0.84 |
| Length (cm), mean ± SD | 67.8 ± 2.7 | 67.9 ± 2.4 |
| Length z-score, mean ± SD | 0.41 ± 1.2 | 0.61 ± 1 |
| Head circumference (cm), median (IQR) | 43.5 (42.7−44.5) | 43.5 (42.6−44) |
| Head circumference z-score, median (IQR) | 0.54 (–0.24−1.27) | 0.58 (0.13−1.37) |
| BMI (kg/m2), mean ± SD | 17 ± 1.5 | 17.2 ± 1.4 |
| BMI z-score, mean ± SD | –0.12 ± 1.02 | 0.06 ± 0.99 |
| 0−6 months weight velocity (g), mean ± SD | 5480 ± 988* | 4604 ± 745 |
| 0−6 months weight velocity z-score, mean ± SD | 0.82 ± 1.1* | –0.21 ± 1 |
| Weight-for-length z-score, mean ± SD | –0.01 ± 1 | 0.17 ± 0.9 |
| Fat mass (%), mean ± SDb | 26.3 ± 8.3 | 26 ± 8.7 |
| Fat mass (g), mean ± SDb | 2105 ± 797 | 2132 ± 762 |
| Fat mass index (kg/m2), mean ± SDb | 4.54 ± 1.6 | 4.57 ± 1.6 |
| Fat-free mass (g), mean ± SDb | 5174 ± 1114 | 5986 ± 849 |
| Fat-free mass index (kg/m2), mean ± SDb | 12.5 ± 1.3 | 12.8 ± 1.7 |
| At 12 months of life | ||
| Late preterm infants (N = 88) | Full-term infants (N = 43) | |
|---|---|---|
| Months of exclusive breastfeeding, median (IQR) | 3.5 (0−9) | 2 (1−9) |
| Weight (g), mean ± SD | 9719 ± 1350 | 9932 ± 1062 |
| Weight z-score, mean ± SD | 0.243 ± 1.15 | 0.544 ± 0.89 |
| Length (cm), mean ± SD | 75.8 ± 2.8 | 76.2 ± 2.4 |
| Length z-score, mean ± SD | 0.34 ± 1.06 | 0.60 ± 0.9 |
| Head circumference (cm), mean ± SD | 46 ± 1.4 | 46 ± 1.5 |
| Head circumference z-score, median (IQR) | 0.33 (–0.05–0.8) | 0.44 (–0.05−1.5) |
| BMI (kg/m2), mean ± SD | 16.8 ± 1.5 | 17 ± 1.3 |
| BMI z-score, mean ± SD | 0.06 ± 1.11 | 0.28 ± 0.91 |
| 6−12 months weight velocity (g), mean ± SD | 1833 ± 493 | 1969 ± 645 |
| 6−12 months weight velocity z-score, mean ± SD | –0.48 ± 0.9 | –0.25 ± 1.1 |
| Weight-for-length z-score, mean ± SD | 0.13 ± 1.1 | 0.39 ± 0.9 |
| Fat mass (%), median (IQR)c | 25.3 (20−30) | 23 (19−26) |
| Fat mass (g), mean ± SDc | 2442 ± 834 | 2274 ± 870 |
| Fat mass index (kg/m2), mean ± SDc | 4.2 ± 1.3 | 3.8 ± 1.4 |
| Fat-free mass (g), mean ± SDc | 7232 ± 1086* | 7813 ± 1163 |
| Fat-free mass index (kg/m2), mean ± SDc | 12.5 ± 1.3* | 13.2 ± 1.5 |
BMI, body mass index; IQR, interquartile range; SD, standard deviation.
Subgroup of late preterm and full term infants who underwent body composition assessment (n = 28 and n = 22, respectively).
Subgroup of late preterm and full-term infants who underwent body composition assessment (n = 69 and n = 29, respectively).
In the second assessment, late preterm infants had a higher weight velocity and weight velocity z-score at 6 months of life compared to full term infants. We found no differences in any of the remaining anthropometric and BC parameters or the months of exclusive breastfeeding between late preterm and full term infants (Table 2).
In the last assessment, the FFM (g) and FFMI of late preterm infants were lower compared to those of full term infants (Table 2).
The crude analysis of the predictors showed that infant sex, feeding modality (in the first 48 h of life, at 1 month, at 6 months and at 12 months) and GA (late preterm vs full term) were not associated with FMI at 1 year of life (P > .05).
The Pearson correlation coefficient and simple linear regression analysis evinced a significant association between the FMI at 12 months of life and the weight-for-length z-score at each timepoint and as well as the weight velocity z-score (0−6 months and 6−12 months) (Tables 3 and 4).
Association between the fat mass index at 12 months and anthropometric variables (Pearson correlation).
| Late preterm infants (N = 66) | Full-term infants (N = 33) | |
|---|---|---|
| Anthropometric variables at 1 month of life | ||
| Weight z-score, r (P) | 0.144 (.247) | –0.055 (.762) |
| Length z-score, r (P) | –0.181 (.147) | –0.094 (.601) |
| BMI z-score, r (P) | 0.351 (.004) | 0.005 (.977) |
| 0−1 month weight increment z-score, r (P) | 0.141 (.257) | –0.077 (.674) |
| Weight-for-length z-score, r (P) | 0.389 (.001) | 0.040 (.826) |
| Anthropometric variables at 6 months of life | ||
| Weight z-score, r (P) | 0.478 (< .001) | 0.068 (.707) |
| Length z-score, r (P) | 0.185 (.137) | –0.217 (.224) |
| BMI z-score, r (P) | 0.548 (< .001) | 0.267 (.134) |
| 0−6 months weight increment z-score, r (P) | 0.530 (< .001) | 0.064 (.724) |
| Weight-for-length z-score, r (P) | 0.554 (< .001) | 0.260 (.144) |
| Anthropometric variables at 12 months of life | ||
| Weight z-score, r (P) | 0.433 (< .001) | 0.271 (.126) |
| Length z-score, r (P) | 0.036 (.774) | –0.042 (.818) |
| BMI z-score, r (P) | 0.594 (< .001) | 0.415 (.016) |
| 6−12 months weight increment z-score, r (P) | 0.165 (.186) | 0.402 (.021) |
| Weight-for-length z-score, r (P) | 0.561 (< .001) | 0.379 (.03) |
BMI, body mass index; r, Pearson correlation coefficient.
Association between the fat mass index at 12 months and anthropometric variables (simple linear regression).
| All infants (99) Beta P | |
|---|---|
| Anthropometric variables at 1 month of life | |
| 0−1 month weight increment z-score, r (P) | 0.126 (.218) |
| Weight-for-length z-score, r (P) | 0.293 (.003) |
| Anthropometric variables at 6 months of life | |
| 0−6 months weight increment z-score, r (P) | 0.390 (.001) |
| Weight-for-length z-score, r (P) | 0.424 (.001) |
| Anthropometric variables at 12 months of life | |
| 6−12 months weight increment z-score, r (P) | 0.242 (.016) |
| Weight-for-length z-score, r (P) | 0.472 (.001) |
Beta: typified coefficient.
The multiple regression analysis included all the covariates mentioned above with P values of less than 0.05 and the weight-for-length z-score at 12 months, which maintained the statistically significant positive association with the FMI in both groups of infants (Table 5).
Multivariable associations of predictors with the fat mass index at 12 months of life.
| Beta | P | |
|---|---|---|
| Fat mass index at 12 months | ||
| Weight-for-length z-score at 1 month | 0.067 | .530 |
| 0−6 months weight gain z-score | –0.046 | .775 |
| Weight-for-length z-score at 6 months | 0.007 | .971 |
| 6−12 months weight gain z-score | –0.138 | .390 |
| Weight-for-length z-score at 12 months | 0.604 | .033 |
Beta: typified coefficient.
Covariates included in the model: weight-for-length z-score at 1 month, 0−6 months weight increment z-score, weight-for-length z-score at 6 months, 6−12 months weight increment z-score, weight-for-length z-score at 12 months.
We found that the weight-for-length z-score at 12 months was positively associated with the FMI at 1 year of life, corroborating our hypothesis.
Preterm infants are at higher risk of growth problems, such as underweight, stunting and wasting in the first 2 years of life, decreased FFM and increased FM.15,22,23 This disproportionate growth may increase their risk of obesity and metabolic syndrome, and possibly neurocognitive impairment in late childhood and adulthood.22–25
Bioelectrical impedance analysis is a non-invasive, inexpensive and widely used approach to assess BC and clinical condition in patients, as it measures the total body water.8,10 Although there may be movement artifacts and the test may need to be repeated, BIA offers advantages such as its simplicity and portability.
In our study, we found that significant increases in body weight from birth to 1 month of life in late preterm infants were mainly due to increases in FFM (g). The use of BW for normalization (%FM as fat-mass/body weight or %FFM as fat-free mass/body weight) fails to account for independent tissue accretion rates, as the %FM depends on the amount of FFM and vice versa. Compared with the BMI or BF percentage, the FMI offers a higher sensitivity for slight changes in BF stores, and is therefore superior for assessing static and dynamic nutritional status.4 In our study, after taking length into account, there were no differences between groups in FMI. Contrary to our findings, other authors have reported that postnatal weight gain in late preterm infants chiefly involves the preferential deposition of FM that leads to an increase in total adiposity at the term-corrected age and 1 month of corrected age, while finding no significant differences between late preterm and full term infants at 3 months, therefore describing growth that is quantitatively and qualitatively similar to that of full term infants.11–12,13–14,16 This rapid posnatal fat catch-up is a mechanism of adaptation to extrauterine life and may constitute an additional risk factor for metabolic syndrome in adulthood.13–16
We also studied BC at 6 and 12 months of corrected age in late preterm infants. At 6 months of life, there were no differences in BC between the two groups, although at 12 months, the FFM and FFMI were lower in late preterm infants compared to full term infants. Furthermore, we found that the weight-for-length z-score at 12 months was closely associated with FMI at 12 months after adjusting for covariates, which added to the findings of Villar et al., as they assessed infants at birth, whereas our study made assessments at later time points.17
In respect of other anthropometric variables, late preterm infants had a higher BMI z-score and weight-for-length at 1 month of corrected age and a higher weight increments velocity z-score in the first 6 months of life compared to full term infants. There were no differences between the 2 groups at 12 months of life. There are previous studies reporting an association between late preterm birth and underweight status in the first year of life.22–23 In addition, many studies have described an increase in BW between birth and month 1 post birth characterised by a preferential deposition of FM.11–14 Our findings are different from the previous literature on late preterm infants studies, which could be due to differences in socioeconomic characteristics (samples from different countries and study periods) and in the techniques used to measure body composition.22–23
Although this study is of clinical interest, it has some limitations. First, the number of infants who underwent BC assessment was relatively small, although they were followed up to 12 months. Second, there are no validated equations in preterm infants, and fat has a higher water content in early life. In conclusion, BIA is feasible in late preterm infants, and the weight-for-length z-score at 12 months is closely associated with the FMI at one year of life. Further studies are needed to investigate whether increases in this anthropometric parameter may modulate the risk of chronic diseases.
Conflict of interestThe authors declare that they have no conflict of interest.
