


Pubertal growth pattern differs according to age at pubertal growth spurt onset which occurs over a five years period (girls: 8–13 years, boys: 10–15 years). The need for more than one pubertal reference pattern has been proposed. We aimed to obtain five 1-year-age-interval pubertal patterns.
Subjects and methodsLongitudinal (6 years of age-adult height) growth study of 1,453 healthy children to evaluate height-for-age, growth velocity-for-age and weight-for-age values. According to age at pubertal growth spurt onset girls were considered: very-early matures (8–9 years, n=119), early matures (9–10 years, n=157), intermediate matures (10–11 years, n=238), late matures (11–12 years, n=127) and very-late matures (12–13 years, n=102), and boys: very-early matures (10–11 years, n=110), early matures (11–12 years, n=139), intermediate matures (12–13 years, n=225), late matures (13–14 years, n=133) and very-late matures (14–15 years, n=103). Age at menarche and growth up to adult height were recorded.
ResultsIn both sexes, statistically-significant (p<0.0001) and clinically-pertinent differences in pubertal growth pattern (mean height-for-age, mean growth velocity-for-age and mean pubertal height gain, values) were found among the five pubertal maturity groups and between each group and the whole population, despite similar adult height values. The same occurred for age at menarche and growth from menarche to adult height (p<0.05).
ConclusionsIn both sexes, pubertal growth spurt onset is a critical milestone determining pubertal growth and sexual development. The contribution of our data to better clinical evaluation of growth according to the pubertal maturity tempo of each child will obviate the mistakes made when only one pubertal growth reference is used.
El patrón de crecimiento puberal varía según la edad de inicio del brote de crecimiento puberal, que ocurre dentro de un período de 5 años (mujeres: 8-13 años; varones: 10-15 años). Se ha propuesto la necesidad de utilizar más de un patrón de referencia puberal. Nuestro objetivo fue obtener 5 patrones puberales a intervalos de un año.
Sujetos y métodosEstudio longitudinal (6 años de edad-talla adulta) de crecimiento en 1.453 niños sanos con evaluación de valores de talla, velocidad de crecimiento y peso para la edad. Según la edad de inicio del brote de crecimiento puberal, las mujeres se consideraron: maduradoras muy tempranas (8-9 años, n=119), maduradoras tempranas (9-10 años, n=157), maduradoras intermedias (10-11 años, n=238), maduradoras tardías (11-12 años, n=127) y maduradoras muy tardías (12-13 años, n=102); los varones se consideraron: maduradores muy tempranos (10-11 años, n=110), maduradores tempranos (11-12 años, n=139), maduradores intermedios (12-13 años, n=225), maduradores tardíos (13-14 años, n=133) y maduradores muy tardíos (14-15 años, n=103). Se registró la edad de la menarquia y el crecimiento desde esta hasta alcanzar la talla adulta.
ResultadosEn ambos sexos se observaron diferencias estadísticamente significativas (p<0,0001) y clínicamente relevantes en el patrón de crecimiento puberal (valores medios de talla para la edad, velocidad de crecimiento para la edad y ganancia de talla puberal) entre los 5 grupos maduradores y entre cada uno de ellos y la población total, a pesar de que los valores de la talla adulta fueron similares en todos los grupos. Se observó la misma tendencia en relación con la edad de la menarquia y la ganancia de talla desde la menarquia hasta la talla adulta (p<0,05).
ConclusionesEn ambos sexos, el inicio del brote de crecimiento puberal es un hito crítico que determina el crecimiento puberal y el desarrollo sexual. Nuestros datos contribuyen a una mejor evaluación clínica del crecimiento de acuerdo con el tempus madurativo de cada niño, obviando los errores que se cometen con el uso de un único patrón de referencia puberal.
Height, growth velocity, weight and body mass index (BMI) are biomarkers of child health and society's wellbeing.1–3 After birth, growth velocity declines progressively until pubertal growth spurt onset (PGSO) which occurs over a five-year period in both sexes (girls: 8–13 years of age, boys: 10–15 years of age).4,5
Longitudinal growth studies clearly define age at PGSO. However, due to the low number of children included, they tend to present data on pubertal growth as for a single group, without taking into account the different pubertal maturity tempo of each child.6,7 Errors made when a single pubertal reference group is used to evaluate pubertal growth show up in clinical practice; consequently, the need for more than one pubertal reference group has been proposed.4,5,8–10
Our previous longitudinal growth study (1978–2000) presented pubertal growth data of 259 girls and 281 boys allocated to one of five 1-year-age-interval pubertal maturity groups (very-early, early, intermediate, late and very-late) according to their age at PGSO.5 Owing to the low number of children in each group, we started in 1995 a new longitudinal study aimed at recruiting a minimum of 100 healthy non-obese children in each of the five groups for each sex, to confirm or deny clinical significant differences in the pubertal growth pattern among the five pubertal maturity groups.
Subjects and methodsThe study group comprised 1,908 healthy children of the middle-to-upper socioeconomic district of Barcelona. Children with chronic diseases, chronic drug therapies or BMI values<−2.0 SDS (age- and sex-matched controls11) were not included. Over the study period (January 1995 to March 2017), 132 children were ruled out for obesity (physical examination and BMI>2.0 SDS of age- and sex-matched controls11) and 323 were lost. Thus, 1,453 (743 girls, 710 boys) who reached adult height between January 2012 and March 2017 completed the study and data from their height and weight measurements (girls 6–18 years of age, boys 6–19 years of age) were analyzed. Population A (239 girls, 238 boys) was followed at four pediatric practices and population B (504 girls; 472 boys) at four schools. In population A, all were born at term with appropriate weight and length12; these data were not collected for population B.
Height and weight were recorded every 6–12 months by four researchers in population A and once a year by one of the four in population B. Height was measured with rigid wall-mounted stadiometers in population A and with the same portable rigid stadiometer in population B. Stadiometers were calibrated similarly throughout the study. Weight was recorded with digital floor scales (population A in underwear; population B in T-shirt and skirt/trousers, the estimated weight of the T-shirt and skirt/trousers was subtracted from the overall weight). Measurements were taken to the nearest 0.1centimeter (cm) for height and 0.1kilogram (kg) for weight. Tanner's pubertal stages and testicular volume were recorded every six months in population A but not in B for ethical reasons. Age at menarche was recorded in both populations.
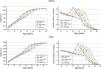
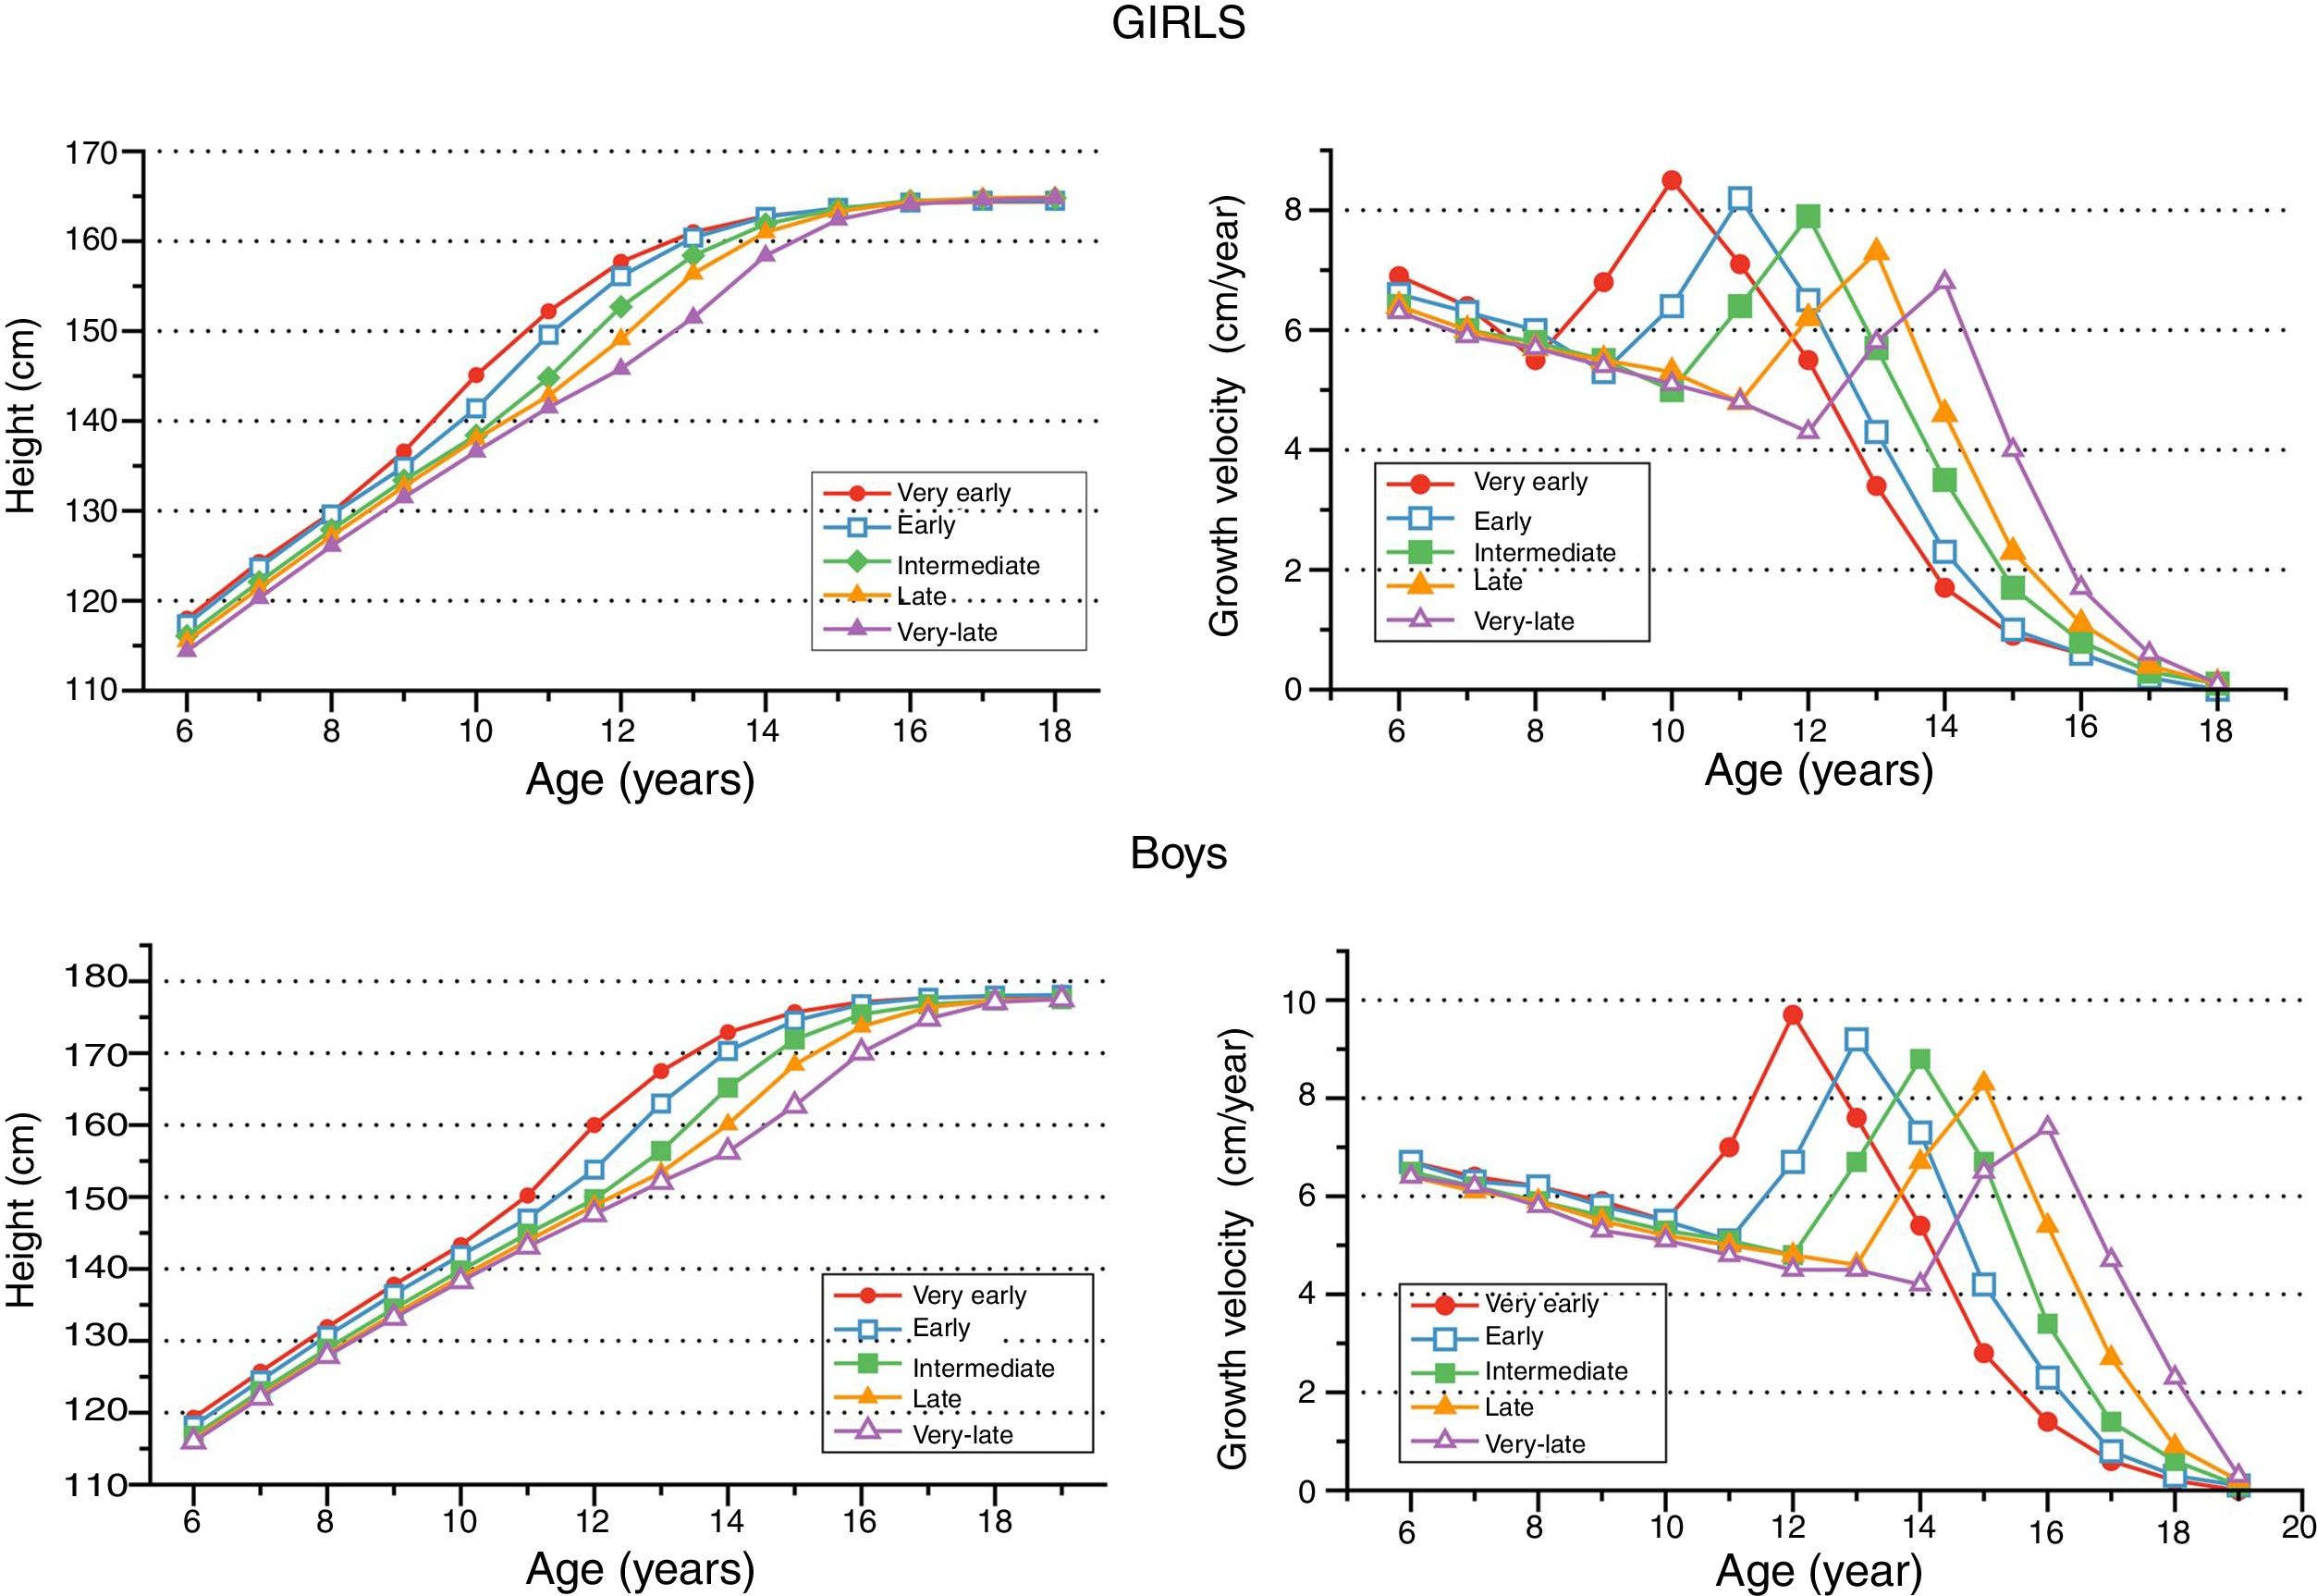
The anthropometric growth program “Auxolog” based on data from our previous longitudinal growth study5,13 was used to construct height-for-age, growth-velocity-for-age and weight-for-age growth charts for each child. PGSO was evaluated by Tanner's criteria6,7 and according to age at PGSO5 children were considered very-early (girls 8–9 years, boys 10–11 years), early (girls 9–10 years, boys 11–12 years), intermediate (girls 10–11years, boys 12–13 years), late (girls 11–12 years, boys 13–14 years) and very-late (girls 12–13 years, boys 14–15 years) matures (Fig. 1). Mean values for height for age (cm), growth velocity for age (cm/year), weight for age (kg), adult height (growth velocity <1cm/year in two consecutive 6–12-month intervals), pubertal height gain (cm) (PGSO to adult height), age at menarche (years) and growth (cm) from menarche to adult height were calculated for each of the five pubertal maturity groups and for the whole population (Tables 1–3).
Height for age (cm), pubertal height gain (cm) and, in girls, age at menarche (years) and height gain (cm) from menarche to adult height in the five pubertal maturity groups and in the whole population (mean±SD).
| Girls | Age (years) | Boys | ||||||||||
|---|---|---|---|---|---|---|---|---|---|---|---|---|
| Very-early n=119 | Early n=157 | Intermediate n=238 | Late n=127 | Very-late n=102 | aWhole population n=743 | Very-early n=110 | Early n=139 | Intermediate n=225 | Late n=133 | Very-late n=103 | aWhole population n=710 | |
| 118.0±3.7 | 117.4±3.7 | 116.1±4.0 | 115.5±4.1 | 114.4±3.8 | 116.3±4.0 | 6 | 119.3±4.8 | 118.2±4.7 | 116.8±4.0 | 116.3±4.5 | 116.0±3.7 | 117.2±4.4 |
| 124.3±4.0 | 123.7±3.9 | 122.1±4.2 | 121.4±4.3 | 120.3±4.0 | 122.4±4.3 | 7 | 125.7±5.1 | 124.5±4.9 | 123.0±4.2 | 122.4±4.7 | 122.1±3.9 | 123.5±4.6 |
| 129.8±4.2 | 129.6±4.1 | 127.9±4.5 | 127.2±4.5 | 126.1±4.2 | 128.2±4.5 | 8 | 131.9±5.4 | 130.7±5.2 | 128.9±4.4 | 128.2±5.0 | 127.9±4.2 | 129.4±4.9 |
| 136.6±4.4 | 134.9±4.3 | 133.4±4.8 | 132.7±4.8 | 131.5±4.3 | 133.9±4.8 | 9 | 137.8±5.7 | 136.5±5.4 | 134.5±4.7 | 133.7±5.1 | 133.2±4.4 | 135.1±5.2 |
| 145.1±4.7 | 141.4±4.4 | 138.4±5.0 | 138.0±5.0 | 136.6±4.4 | 139.8±5.5 | 10 | 143.3±6.0 | 141.9±5.6 | 139.8±4.9 | 138.9±5.3 | 138.3±4.6 | 140.4±5.4 |
| 152.2±4.8 | 149.6±4.6 | 144.8±5.2 | 142.8±5.2 | 141.5±4.5 | 146.2±6.2 | 11 | 150.2±6.2 | 147.0±5.8 | 144.9±5.1 | 143.9±5.5 | 143.1±4.8 | 145.7±5.8 |
| 157.7±4.8 | 156.1±4.8 | 152.7±5.2 | 149.1±5.4 | 145.8±4.7 | 152.6±6.4 | 12 | 160.0±6.4 | 153.8±5.9 | 149.7±5.3 | 148.8±5.6 | 147.6±5.1 | 151.6±6.9 |
| 161.0±4.9 | 160.4±4.9 | 158.4±5.3 | 156.4±5.7 | 151.5±4.8 | 158.0±6.0 | 13 | 167.5±6.4 | 163.0±6.2 | 156.4±5.6 | 153.4±5.8 | 152.1±5.3 | 158.2±7.9 |
| 162.8±4.8 | 162.7±5.1 | 161.9±5.4 | 161.0±6.0 | 158.4±4.8 | 161.6±5.5 | 14 | 172.9±6.4 | 170.3±6.3 | 165.2±5.9 | 160.1±5.8 | 156.3±5.5 | 165.1±8.1 |
| 163.6±4.9 | 163.7±5.2 | 163.6±5.5 | 163.3±6.1 | 162.4±4.7 | 163.4±5.3 | 15 | 175.7±6.3 | 174.5±6.3 | 171.9±5.9 | 168.4±5.9 | 162.7±5.6 | 171.0±7.2 |
| 164.2±4.9 | 164.3±5.3 | 164.5±5.5 | 164.4±6.2 | 164.1±4.7 | 164.3±5.4 | 16 | 177.1±6.3 | 176.8±6.3 | 175.4±5.8 | 173.7±6.0 | 170.1±5.5 | 174.9±6.3 |
| 164.4±4.9 | 164.5±5.3 | 164.7±5.6 | 164.8±6.3 | 164.6±4.8 | 164.6±5.4 | 17 | 177.7±6.3 | 177.7±6.4 | 176.8±5.8 | 176.4±6.2 | 174.8±5.4 | 176.7±6.0 |
| 164.4±4.9 | 164.5±5.3 | 164.8±5.6 | 164.9±6.3 | 164.8±4.8 | 164.7±5.4 | 18 | 177.9±6.3 | 178.0±6.4 | 177.3±5.7 | 177.3±6.2 | 177.1±5.4 | 177.5±5.9 |
| 19 | 177.9±6.3 | 178.1±6.4 | 177.5±5.7 | 177.5±6.2 | 177.5±5.4 | 177.7±5.9 | ||||||
| 34.6±2.4 | 29.6±2.5 | 26.4±2.4 | 22.1±2.4 | 18.9±2.1 | – | bPubertal height gain (adult height minus height at PGSO) | 34.6±2.3 | 31.1±2.5 | 27.8±2.0 | 24.1±2.2 | 21.2±1.3 | – |
| 11.4±0.4 | 12.3±0.3 | 12.9±0.3 | 13.6±0.3 | 14.9±0.5 | 12.9±1.1 | bAge at menarche (years) | – | – | – | – | – | – |
| 10.2±1.8 | 7.4±1.6 | 6.9±1.3 | 5.8±1.5 | 4.3±1.4 | 7.0±2.3 | bHeight gain from menarche to adult height | – | – | – | – | – | – |
In bold, heights at pubertal growth spurt onset (PGSO).
Linear trend analysis of mean height-for-age values among the five pubertal maturity groups: p<0.0001 from 6 to 15 years in girls and from 6 to 18 years in boys.
Girls: whole population vs very-early, early and very-late groups from 6 to 14 years and late group from 7 to 14 years: p=0.0104 to p<0.0001; vs intermediate group at 10 and 11 years: p<0.0001.
Boys: whole population vs very-early group from 6 to 16 years, vs early group from 7 to 16 years, vs late group from 7 to 15 years and vs very-late group from 6 to 17 years: p=0.0081 to p<0.0001; vs intermediate group at 12 and 13 years: p<0.0001.
Growth velocity for age (cm/year) in the five pubertal maturity groups and in the whole population (mean±SD).
| Girls | Age (years) | Boys | ||||||||||
|---|---|---|---|---|---|---|---|---|---|---|---|---|
| Very-early n=119 | Early n=157 | Intermediate n=238 | Late n=127 | Very-late n=102 | aWhole population n=743 | Very-early n=110 | Early n=139 | Intermediate n=225 | Late n=133 | Very-late n=103 | aWhole population n=710 | |
| 6.4±0.6 | 6.3±0.5 | 6.0±0.5 | 6.0±0.5 | 5.9±0.4 | 6.1±0.5 | 6–7 | 6.4±0.5 | 6.3±0.5 | 6.2±0.5 | 6.1±0.4 | 6.2±0.4 | 6.2±0.5 |
| 5.5±0.6 | 6.0±0.5 | 5.8±0.5 | 5.7±0.6 | 5.7±0.4 | 5.8±0.6 | 7–8 | 6.2±0.5 | 6.2±0.5 | 5.9±0.5 | 5.9±0.6 | 5.8±0.5 | 6.0±0.5 |
| 6.8±0.5 | 5.3±0.6 | 5.5±0.5 | 5.5±0.5 | 5.4±0.4 | 5.7±0.7 | 8–9 | 5.9±0.6 | 5.8±0.5 | 5.6±0.5 | 5.5±0.5 | 5.3±0.4 | 5.6±0.5 |
| 8.5±0.9 | 6.4±0.5 | 5.0±0.6 | 5.3±0.5 | 5.1±0.4 | 5.9±1.4 | 9–10 | 5.5±0.6 | 5.5±0.5 | 5.3±0.4 | 5.2±0.5 | 5.1±0.4 | 5.3±0.5 |
| 7.1±0.7 | 8.2±0.8 | 6.4±0.6 | 4.8±0.6 | 4.8±0.4 | 6.4±1.4 | 10–11 | 7.0±0.7 | 5.1±0.5 | 5.1±0.5 | 5.0±0.5 | 4.8±0.4 | 5.3±0.9 |
| 5.5±0.7 | 6.5±0.7 | 7.9±0.7 | 6.2±0.6 | 4.3±0.4 | 6.4±1.4 | 11–12 | 9.7±1.0 | 6.7±0.7 | 4.8±0.6 | 4.8±0.5 | 4.5±0.5 | 5.9±1.9 |
| 3.4±0.6 | 4.3±0.9 | 5.7±0.8 | 7.3±0.8 | 5.8±0.5 | 5.3±1.5 | 12–13 | 7.6±0.7 | 9.2±1.0 | 6.7±0.8 | 4.6±0.6 | 4.5±0.4 | 6.6±1.9 |
| 1.7±0.5 | 2.3±0.7 | 3.5±0.7 | 4.6±0.8 | 6.8±0.8 | 3.6±1.7 | 13–14 | 5.4±0.7 | 7.3±0.9 | 8.8±0.9 | 6.7±0.7 | 4.2±0.5 | 6.9±1.8 |
| 0.9±0.3 | 1.0±0.4 | 1.7±0.5 | 2.3±0.7 | 4.0±0.7 | 1.8±1.1 | 14–15 | 2.8±0.8 | 4.2±0.7 | 6.7±0.8 | 8.3±0.8 | 6.5±0.6 | 5.9±2.0 |
| 0.6±0.2 | 0.6±0.3 | 0.8±0.4 | 1.1±0.4 | 1.7±0.6 | 0.9±0.5 | 15–16 | 1.4±0.5 | 2.3±0.5 | 3.4±0.6 | 5.4±0.9 | 7.4±0.5 | 3.8±2.0 |
| 0.2±0.1 | 0.2±0.1 | 0.3±0.3 | 0.4±0.3 | 0.6±0.4 | 0.3±0.3 | 16–17 | 0.6±0.3 | 0.8±0.3 | 1.4±0.5 | 2.7±0.6 | 4.7±0.5 | 1.9±1.4 |
| 0.0±0.0 | 0.0±0.0 | 0.1±0.1 | 0.1±0.1 | 0.1±0.2 | 0.1±0.1 | 17–18 | 0.2±0.1 | 0.3±0.2 | 0.6±0.3 | 0.9±0.3 | 2.3±0.4 | 0.8±0.7 |
| 18–19 | 0.0±0.0 | 0.1±0.1 | 0.1±0.1 | 0.2±0.2 | 0.3±0.3 | 0.1±0.2 | ||||||
In bold, ages at pubertal growth spurt onset.
Linear trend analysis of mean growth velocity-for-age values among the five pubertal maturity groups: p<0.0001 at any age in each sex, except for 7–8 years in girls (ns).
Girls: whole population vs very-early, early, late and very-late groups from 6–7 years to 16–17 years: p=0.0197 to p<0.0001 and vs the intermediate group from 8–9 years to 13–14 years: p<0.0001. Boys: whole population vs very-early, early, late and very-late groups from 8–9 years to 18–19 years: p=0.0069 to p<0.0001 and vs the intermediate group from 11–12 years to 17–18 years: p<0.0001.
Weight for age (kg) in the five pubertal maturity groups and in the whole population (mean±SD).
| Girls | Age (y) | Boys | ||||||||||
|---|---|---|---|---|---|---|---|---|---|---|---|---|
| Very-early n=119 | Early n=157 | Intermediate n=238 | Late n=127 | Very-late n=102 | aWhole population n=743 | Very-early n=110 | Early n=139 | Intermediate n=225 | Late n=133 | Very-late n=103 | aWhole population n=710 | |
| 22.8±2.6 | 22.0±2.4 | 21.2±2.7 | 20.6±2.2 | 20.6±2.3 | 21.4±2.6 | 6 | 23.0±3.0 | 22.5±3.4 | 21.7±2.7 | 21.4±2.6 | 21.2±2.4 | 21.9±2.9 |
| 26.1±3.4 | 25.1±3.2 | 24.0±3.4 | 23.2±2.7 | 23.1±3.0 | 24.3±3.4 | 7 | 26.2±3.8 | 25.5±3.9 | 24.5±3.2 | 24.2±3.2 | 24.0±3.0 | 24.8±3.5 |
| 29.8±4.0 | 28.6±3.9 | 27.1±4.1 | 26.2±3.4 | 25.9±3.6 | 27.5±4.1 | 8 | 29.7±4.5 | 28.7±4.6 | 27.7±3.8 | 27.3±3.9 | 27.1±3.6 | 28.0±4.2 |
| 34.1±4.6 | 32.2±4.6 | 30.3±4.8 | 29.3±4.1 | 28.7±4.0 | 30.9±4.8 | 9 | 33.9±5.5 | 32.5±5.4 | 31.1±4.6 | 30.6±4.7 | 30.4±4.3 | 31.6±5.0 |
| 39.2±5.4 | 36.2±5.1 | 33.9±5.5 | 32.7±4.8 | 32.0±4.9 | 34.8±5.7 | 10 | 38.3±6.3 | 36.4±6.2 | 34.7±5.3 | 34.0±5.3 | 33.9±4.9 | 35.3±5.8 |
| 44.7±6.4 | 41.3±6.1 | 38.1±6.4 | 36.4±5.6 | 35.5±5.8 | 39.2±6.8 | 11 | 43.3±7.1 | 40.3±7.2 | 38.4±6.0 | 37.6±6.0 | 37.3±5.7 | 39.2±6.7 |
| 49.2±6.6 | 46.5±6.3 | 43.0±6.6 | 40.7±6.1 | 39.0±6.3 | 43.8±7.2 | 12 | 49.1±7.9 | 45.2±7.6 | 42.3±6.6 | 41.4±6.9 | 41.0±6.4 | 43.6±7.5 |
| 53.1±6.4 | 51.0±6.5 | 47.9±6.8 | 45.7±6.5 | 43.4±6.9 | 48.4±7.3 | 13 | 55.1±8.4 | 51.3±8.2 | 47.5±7.3 | 45.6±8.0 | 45.1±7.2 | 48.7±8.5 |
| 55.3±6.0 | 53.9±6.5 | 51.2±6.9 | 49.7±6.5 | 48.2±7.0 | 51.7±7.0 | 14 | 60.6±8.6 | 57.7±8.7 | 54.3±8.0 | 50.9±8.4 | 49.2±7.6 | 54.6±9.0 |
| 56.6±6.1 | 55.7±6.4 | 53.3±6.5 | 52.6±6.3 | 51.5±6.7 | 54.0±6.6 | 15 | 64.4±8.6 | 62.1±8.9 | 59.7±7.8 | 57.1±8.7 | 54.4±7.5 | 59.6±8.8 |
| 57.4±6.2 | 56.5±6.3 | 54.5±6.6 | 54.1±6.5 | 53.5±6.6 | 55.2±6.6 | 16 | 66.6±8.5 | 65.1±8.5 | 63.5±7.8 | 61.8±8.5 | 60.1±7.5 | 63.5±8.4 |
| 57.9±6.0 | 56.9±6.3 | 55.1±6.6 | 54.7±6.5 | 54.6±6.5 | 55.8±6.5 | 17 | 68.2±8.2 | 67.1±8.5 | 65.8±7.7 | 64.8±8.4 | 64.2±7.6 | 66.0±8.1 |
| 58.1±6.0 | 57.1±6.1 | 55.4±6.5 | 55.0±6.6 | 54.9±6.5 | 56.0±6.5 | 18 | 69.3±7.9 | 68.2±8.4 | 66.9±7.4 | 66.3±8.3 | 66.7±7.5 | 67.4±7.9 |
| 19 | 70.0±7.7 | 69.0±8.3 | 67.8±7.3 | 67.2±8.2 | 68.3±7.6 | 68.3±7.8 | ||||||
In bold, ages at pubertal growth spurt onset.
Linear trend analysis of mean weight-for-age values among the five pubertal maturity groups: p=0.0168 to p<0.0001 from 6 to 18 years in girls and 6 to 19 years in boys.
Girls: whole population vs very-early group from 6 to 18 years and vs early, late and very-late groups from 6 to 16 years: p=0.0374 to p<0.0001. Boys: whole population vs very-early group from 6 to 18 years, vs early group from 12 to 14 years, vs late group from 10 to 16 years and vs very-late group from 10 to 17 years: p=0.0126 to p<0.0001.
The study was approved by the Ethics Committee of the University Children's Hospital Vall d’Hebron, Barcelona. Informed consent was obtained from children and their parents or legal guardians.
Statistical analysisResults are expressed as mean±SD. The linear trend for mean anthropometric-for-age values among the pubertal maturity groups was evaluated by linear regression. One-sample Student's t-test was used for comparisons of mean anthropometric-for-age values of the whole population with each of the five pubertal maturity groups. Differences in mean pubertal height gain, age at menarche and height gain from menarche to adult height among the pubertal maturity groups were evaluated by one-way analysis of variance; pair-wise comparison of subgroups was made by the Bonferroni test. SAS® 9.3 software (SAS Institute Inc., Cary, NC, USA) was used to analyze the data.
ResultsAmong the 743 girls, age at PGSO was between 8–9 years in 119, 9–10 years in 157, 10–11 years in 238, 11–12 years in 127 and 12–13 years in 102, and girls were considered very-early, early, intermediate, late and very-late matures, respectively. Among the 710 boys, age at PGSO was between 10–11 years in 110, 11–12 years in 139, 12–13 years in 225, 13–14 years in 133 and 14–15 years in 103, and boys were considered very-early, early, intermediate, late and very-late matures, respectively (Tables 1–3).
For both sexes, in each of the five pubertal maturity groups and in the whole population, mean values for any anthropometric variable at any age (6 years to adult height) were similar and did not differ statistically between populations A and B. Thus, for each sex, joint data of both populations were analyzed as a single population.
HeightMean height-for-age values for the five pubertal maturity groups and for the whole population are shown in Table 1 and Fig. 1. Although these values were similar at birth (population A, data not shown) and at adult height for both sexes, a statistically-significant linear trend (p<0.0001) among the five pubertal maturity groups was observed from 6 to 15 years in girls and from 6 to 18 years in boys. Differences were minor when, in each of the five groups, all girls (age<8 years) or all boys (age<10 years) were prepubertal, increased substantially from then on in accordance with age at PGSO and disappeared at adult height. The greatest differences arose between the very-early and very-late groups (11.9cm at 12 years in girls; 16.6cm at 14 years in boys). Mean pubertal height gain in both sexes, age at menarche and growth from menarche to adult height, differed significantly (p<0.05) between each pubertal maturity group and each of the other four (Table 1).
In girls, mean height-for-age values for the whole population differed significantly with those of very-early, early and very-late groups from 6 to 15 years, with late group from 7 to14 years (p=0.0189 to p<0.0001) and with the intermediate group at 10 and 11 years (p<0.0001). In boys, these differences were observed from 6 to 16 years with the very-early, 7 to 16 years with the early, 7 to 15 years with the late, 6 to 17 years with the very-late (p=0.0081 to p<0.0001) and at 12 and 13 years with the intermediate (p<0.0001) groups. Differences increased substantially according to PGSO and decreased at adult height.
For the same pubertal maturity group, girls and boys had similar mean height-for-age values until the age of 8, although these values tended to be higher in boys than in girls. From then on, differences increased according to age at PGSO and at adult height ranged from 13.5cm to 12.6cm, being 13.0cm for the whole populations (Table 1).
Growth velocityMean growth velocity-for-age values for the five pubertal maturity groups and for the whole population are shown in Table 2 and Fig. 1. A statistically-significant (p<0.0001) linear trend among the five pubertal maturity groups was observed in both sexes, except for 7–8 years in girls (ns). Differences were minor when, in each of the five groups, all girls or all boys were prepubertal, increased substantially from then on in accordance with age at PGSO and tended to disappear at adult height. The greatest differences were observed between the very-early and very-late groups (5.1cm/year for 13–14 years in girls and 6.0cm/year for 15–16 years in boys).
In girls, mean growth velocity-for-age values for the whole population differed significantly (p=0.0197 to p<0.0001) with those of the very-early, early, late and very-late groups from 6–7 years to 16–17 years, and with the intermediate group (p<0.0001) from 8–9 years to 13–14 years. In boys, these differences (p=0.0069 to p<0.0001) were observed with the very-early, early, late and very-late groups from 8–9 years to 18–19 years, and with the intermediate group (p<0.0001) from 11–12 years to 17–18 years. Differences increased substantially according to PGSO and decreased at adult height.
WeightMean weight-for-age values for the five pubertal maturity groups and the whole population are shown in Table 3. Although these values were similar at birth (population A, data not shown), a statistically-significant (p=0.0168 to p<0.0001) linear trend was observed among the five groups from 6 to 18 years in girls and 6 to 19 years in boys. Differences increased substantially according to PGSO and decreased at adult height. The greatest differences were observed between the very-early and very-late groups (10.2kg at 12 years in girls and 11.4kg at 14 years in boys).
In girls, mean weight-for-age values for the whole population differed significantly (p=0.0374 to p<0.0001) with those of the very-early group from 6 to 18 years and with those of the early, late and very-late groups from 6 to 16 years. In boys, these differences (p=0.0126 to p<0.0001) were observed with very-early group from 6 to 18 years 17.5±2.0, with early group from 12 to 14 years, with late group from 10 to 16 years and with very-late group from 10 to 17 years. Differences increased substantially according to PGSO and decreased at adult height.
Pubertal developmentIn girls, mean BMI values at PGSO were 17.5±2.0, 17.7±2.1, 17.6±2.2, 17.8±2.3 and 18.4±2.5 for the very-early, early, intermediate, late and very-late pubertal maturity groups, respectively, with no statistically significant differences among them. Tanner breast stage II was observed 4–6 months after PGSO and Tanner breast stages IV or V at adult height. Growth velocity peak was reached between Tanner breast stages II–III. Mean age at menarche differed significantly (p<0.05) between each pubertal maturity group and each of the other four (Table 1). BMI values at menarche were 19.2±2.3, 19.3±2.1, 19.0±2.2, 19.0±2.1 and 19.6±2.2 for the very-early, early, intermediate, late and very-late pubertal maturity groups, respectively, with no statistically significant differences among them.
In boys, mean BMI values at PGSO were 18.6±2.3, 18.6±2.5, 18.9±2.5, 19.3±2.6 and 20.1±2.4 for the very-early, early, intermediate, late and very-late pubertal maturity groups, respectively, with no statistically significant differences among very-early, early, intermediate and late groups; values of very-late group differ significantly (p<0.05) from those of the very-early, early and intermediate groups. Testicular volumes of 4–6ml and 20ml were observed at PGSO and at adult height, respectively. Growth velocity peak was reached between Tanner stages III–IV, and Tanner V stage at adult height.
DiscussionLongitudinal growth studies provide reference values for pubertal growth evaluation. As pubertal growth differs depending on age at PGSO the need for more than one pubertal reference has been proposed.4,5,8–10
Herein, we report from 6 years of age to adult height, height-for-age, growth velocity-for-age, and weight-for-age values of 1453 healthy non-obese children of the middle-to-upper socioeconomic district of Barcelona, in whom the anthropometric measurements were taken by only four researchers using similarly adjusted equipment. The study was designed with the aim to reduce the anthropometric values dispersion observed in growth studies owing to the heterogeneity of the populations studied, the number of researchers involved and the equipment used. Children were allocated to one of the five 1-year-age-interval pubertal maturity groups (very-early, early, intermediate, late and very-late) according to their age at PGSO.
In each sex, mean birth length (population A, data not shown), mean birth weight (population A, data not shown), mean adult height, and mean adult weight values were similar among the five pubertal maturity groups. However, mean height-for-age, mean growth velocity-for-age and mean weight-for-age values differed from 6 years of age onwards. Differences were discrete and of poor clinical significance when all girls (age<8 years) and all boys (age<10 years) were prepubertal. However, they did increase and became clinically pertinent from this age onwards, according to PGSO, disappearing at adult height age.
In both sexes, PGSO is a critical milestone determining growth rate (height and weight gains) of puberty, Tanner's stage development and, in girls, age at menarche and growth from menarche to adult height. Each pubertal maturity group has its own pubertal development pattern, which also differs from those of the whole population. In clinical practice, individual pubertal growth (height, growth velocity and weight) and sexual development evaluation with their corresponding pubertal maturity group pattern (very-early, early, intermediate, late, and very-late) may help to avoid the errors currently made when only the pubertal maturity group of the whole population is used.
Although a bias in our results can completely not be rule out, in both sexes, prepubertal height-for age (girls age<8 years, boys age<10 years) and adult height values were similar to those reported in recent Spanish,11 European14–20 (except for Dutch population which was 5.9cm taller for both sexes at adult height) and American21,22 cross-sectional studies, which suggests that our data of the five pubertal maturity groups may also be useful for evaluating pubertal growth in these populations.
In girls, BMI values were not statistically different among the five pubertal maturity groups at PGSO, and at the age of menarche. The same occurred in boys at PGSO, except for values between very-late group and very-early, early and intermediate groups, although these differences were of poor clinical significance. These data suggest that a similar body mass is necessary to start puberty in both sexes and in girls, to have menarche, regardless of the age at what they occurred. Moreover, age at menarche for the whole population was similar to those reported recently by others, which concur with the secular acceleration observed in recent years.23–25
In summary, anthropometric data (height, growth velocity, and weight, all for age) during pubertal growth were obtained for both sexes from a longitudinal growth study including 1453 healthy non-obese millennial children classified in five different pubertal maturity groups according to age at PGSO. These data might contribute to better clinical evaluation of growth according to the pubertal maturity tempo of each child and to avoidance the mistakes currently made when only one pubertal reference group are used. Data on sexual development and, in girls, age at menarche are also reported.
AddendumCharts for height, growth velocity, weight and BMI, all for age, calculated by the LMS method will be available (centiles and SDS values) and downloaded free of charge from the web site: http://www.millennialsgrowth.com (available February 2018) (Cole TJ. The LMS method for constructing normalized growth standards. Eur J Clin Nutr 1990;44:45–60).
Conflict of interestThe authors declare no conflict of interest.
We would like to thank the children, parents, schools and teachers who made this study possible. We would also like to thank the Scientific Societies (Spanish and Catalan Pediatric Societies, Spanish Pediatric Endocrinology Society) and Institutions which back this work. Juan Bosch-Castañé MD† and Ariadna Campos PhD are acknowledged for their contribution to the work. Christine O’Hara and Fidelma Greaves are acknowledged for useful help with the English version of the manuscript.
Please cite this article as: Carrascosa A, Yeste D, Moreno-Galdó A, Gussinyé M, Ferrández Á, Clemente M, et al. Crecimiento puberal de 1.453 niños sanos según la edad de inicio de la pubertad. Estudio longitudinal de Barcelona. An Pediatr (Barc). 2018;89:144–152.
