To determine, by the creamatocrit measurement, the effect on fat content of freezing raw and pasteurised donor milk at −20°C for 3 months.
MethodsThe evolution of the creamatocrit measurement (following Lucas technique) on frozen (−20°C), raw and pasteurised human milk, was analysed during 3 months.
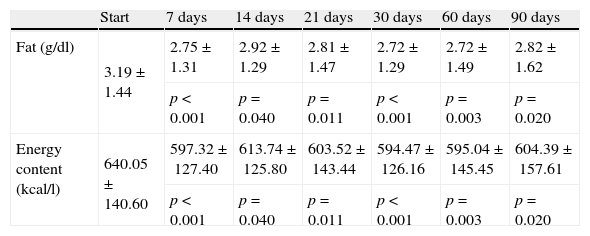
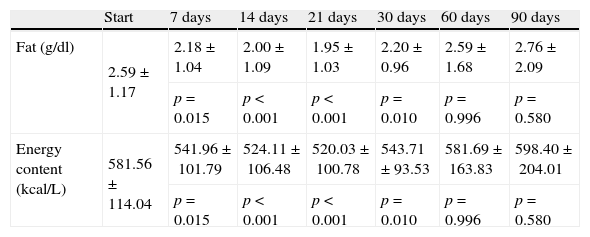
ResultsThe fat content of raw milk (n=44) was 3.19g/dl at the beginning and 2.86g/dl after 3 months frozen (p=0.02). In pasteurised milk (n=36) fat content at the first determination was 2.59g/dl and 2.20g/dl after 1 month frozen (p=0.01). Afterwards there were no significant changes up to 3 months frozen. Variability was observed in the intermediate values.
ConclusionsA reduction on the fat content measurement of raw and pasteurised donor human milk after freezing was observed. Freezing does not inactivate the milk lipase but does destroy the fat globule. Creamatocrit measurement may not be the best method to determine the fat content of processed human milk.
Determinar, mediante crematocrito, las modificaciones del contenido graso de la leche materna cruda y pasteurizada a lo largo de 3 meses de congelación.
MétodoSe analizó la evolución del crematocrito (fórmula de Lucas) en leche cruda y pasteurizada a lo largo de 3 meses de congelación a −20°C.
ResultadosLa grasa en leche cruda (n=44) fue 3,19g/dl al inicio y 2,86g/dl a los 3meses de congelación (p=0,02). En leche pasteurizada (n=36), al inicio fue 2,59g/dl y 2,20g/dl al mes de congelación (p=0,01), posteriormente, hasta los 3 meses, no hubo cambios significativos. Se observó variabilidad en los valores intermedios.
ConclusionesSe observó una disminución en la medida de la grasa tras congelación en leche cruda y pasteurizada. La congelación no impide la acción de la lipasa y también afecta al glóbulo de grasa. Probablemente, el crematocrito no sea el método óptimo para cuantificar la grasa en leche ya procesada.
Human milk is the ideal food for newborns, especially if they are premature or ill,1–4 but its properties may alter during its manipulation and storage.
Freezing human milk at −20°C guarantees its microbiological quality, but its effects on nutritional quality have not been researched thoroughly. Some studies have observed a decrease in the bactericidal and antioxidant activities of breast milk5–7 and a reduction in the energy and fat content over the freezing time.8
At times, the nutritional content of breastmilk does not meet the requirements of preterm and low-birth-weight infants,9 so it is important that we learn its nutritional value. Lipids constitute the main source of energy, but they are the component that shows the highest degree of variation.10 The creamatocrit method is a simple and inexpensive means to calculate the fat and energy content of breast milk. It was described by Lucas et al.11 in 1978. Several authors have observed a good correlation between the energy content of milk and the creamatocrit.12–14
The purpose of our study was to determine, by means of the creamatocrit method, the variations in the fat content of raw and pasteurised human milk throughout 3 months of freezing at −20°C.
Materials and methodsWe performed an experimental study. We obtained the samples from women who donate to the Milk Bank, and gave informed consent. The samples were expressed manually or with a breast pump, and stored in sterilised glass containers.
The samples of raw (unpasteurised) milk were refrigerated at 4–5°C following extraction for a maximum of 24h. In those first 24h the samples were homogenised by rocking them in an arc-like fashion 10 times and then were divided in 7 aliquots. We analysed the first aliquot (time 0) and the 6 remaining aliquots were frozen at −20°C.
The samples of pasteurised milk were homogenised immediately following Holder pasteurisation by rocking them in an arc-like fashion 10 times, after which they were divided into 7 aliquots. We analysed the first aliquot after pasteurisation, and the 6 remaining aliquots were frozen at −20°C.
The raw and pasteurised milk aliquots were stored in polypropylene tubes and were labelled based on freezing time (7, 14, 21, 30, 60, or 90 days).
To analyse the aliquots, they were thawed in a 40°C water bath until a frozen pellet remained in the middle, and moved to a refrigerator to complete the thawing at 4–5°C.
Creamatocrit analysisWe used the Lucas method.11 Each aliquot was heated in a 40°C water bath for 10min and homogenised with a Vortex® mixer. Three 75μl capillary tubes were drawn from each aliquot for the creamatocrit. The capillary tubes were sealed at one end and centrifuged for 15min at 12000rpm in a Hettich® haematocrit centrifuge.
The cream and aqueous fraction layers were measured with callipers. The creamatocrit was expressed as the percentage of cream relative to the length of the entire milk column. We calculated the mean value of the 3 creamatocrits, and applied the Lucas formula to determine the fat content (%cream – 0.59)/0.146=g/l and energy content (%cream×66.8×290=kcal/l).
Statistical methodsSample size: we conducted a pilot study beforehand. We found a difference in fat content of 0.7g in raw milk and 0.5g in pasteurised milk. The sample size required to detect this difference with a power of 80% and a confidence interval of 95% was of 39 raw milk samples and 34 pasteurised milk samples.
We have used the mean±standard deviation to describe continuous variables. The proportion of samples analysed by means of 1, 2, or 3 creamatocrits was expressed in percentages. To evaluate the differences in fat and energy content at the initial time point and the different freezing times, we used Student's t-test for paired samples. We tested the normality of the data distribution by means of the Kolmogorov–Smirnov test.
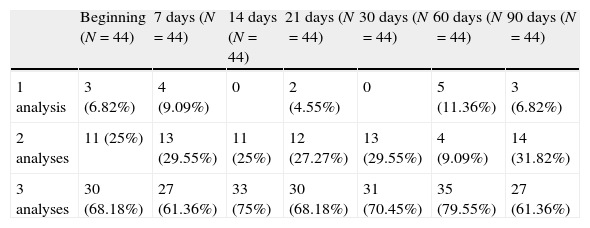
ResultsWe collected 44 samples of raw donated breastmilk. Table 1 shows the number and percentage of raw milk aliquots on which 1, 2, and 3 creamatocrits were performed.
Number and percentage of raw milk aliquots on which 1, 2, or 3 creamatocrit analyses were made at each time point in the study.
| Beginning (N=44) | 7 days (N=44) | 14 days (N=44) | 21 days (N=44) | 30 days (N=44) | 60 days (N=44) | 90 days (N=44) | |
| 1 analysis | 3 (6.82%) | 4 (9.09%) | 0 | 2 (4.55%) | 0 | 5 (11.36%) | 3 (6.82%) |
| 2 analyses | 11 (25%) | 13 (29.55%) | 11 (25%) | 12 (27.27%) | 13 (29.55%) | 4 (9.09%) | 14 (31.82%) |
| 3 analyses | 30 (68.18%) | 27 (61.36%) | 33 (75%) | 30 (68.18%) | 31 (70.45%) | 35 (79.55%) | 27 (61.36%) |
The mean±standard deviation of the fat content at the initial time point was 3.19±1.44g/dl, and for the energy content it was 640.05±140.60kcal/l. We observed a significant decrease in the fat and energy content measurements after freezing at −20°C at all times of analysis (7, 14, 21, 30, 60, and 90 days) (Table 2).
Comparison of the fat and energy content in raw milk (N=44) by amount of time frozen at −20°C.
| Start | 7 days | 14 days | 21 days | 30 days | 60 days | 90 days | |
| Fat (g/dl) | 3.19±1.44 | 2.75±1.31 | 2.92±1.29 | 2.81±1.47 | 2.72±1.29 | 2.72±1.49 | 2.82±1.62 |
| p<0.001 | p=0.040 | p=0.011 | p<0.001 | p=0.003 | p=0.020 | ||
| Energy content (kcal/l) | 640.05±140.60 | 597.32±127.40 | 613.74±125.80 | 603.52±143.44 | 594.47±126.16 | 595.04±145.45 | 604.39±157.61 |
| p<0.001 | p=0.040 | p=0.011 | p<0.001 | p=0.003 | p=0.020 |
Shows the mean±standard deviation and analysis using Student's t-test for paired samples.
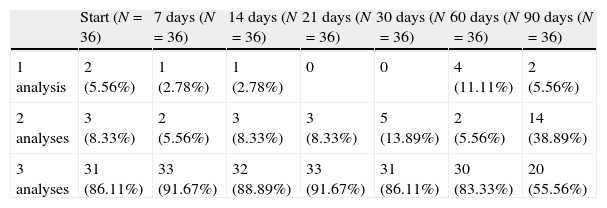
We collected 36 samples of pasteurised donated milk. Table 3 shows the aliquots on which 1, 2, and 3 creamatocrits were performed.
Number and percentage of pasteurised milk aliquots on which 1, 2, or 3 creamatocrit analyses were made at each time point in the study.
| Start (N=36) | 7 days (N=36) | 14 days (N=36) | 21 days (N=36) | 30 days (N=36) | 60 days (N=36) | 90 days (N=36) | |
| 1 analysis | 2 (5.56%) | 1 (2.78%) | 1 (2.78%) | 0 | 0 | 4 (11.11%) | 2 (5.56%) |
| 2 analyses | 3 (8.33%) | 2 (5.56%) | 3 (8.33%) | 3 (8.33%) | 5 (13.89%) | 2 (5.56%) | 14 (38.89%) |
| 3 analyses | 31 (86.11%) | 33 (91.67%) | 32 (88.89%) | 33 (91.67%) | 31 (86.11%) | 30 (83.33%) | 20 (55.56%) |
The mean fat content at the beginning of the study was 2.59±1.17g/dl, and the mean energy content was 581.56±114.04kcal/l. We observed a significant reduction in the mean fat and energy content after freezing at −20°C during the first month of the study (7, 14, 21, and 30 days) (Table 4).
Comparison of the fat and energy content in pasteurised milk (N=36) by amount of time frozen at −20°C.
| Start | 7 days | 14 days | 21 days | 30 days | 60 days | 90 days | |
| Fat (g/dl) | 2.59±1.17 | 2.18±1.04 | 2.00±1.09 | 1.95±1.03 | 2.20±0.96 | 2.59±1.68 | 2.76±2.09 |
| p=0.015 | p<0.001 | p<0.001 | p=0.010 | p=0.996 | p=0.580 | ||
| Energy content (kcal/L) | 581.56±114.04 | 541.96±101.79 | 524.11±106.48 | 520.03±100.78 | 543.71±93.53 | 581.69±163.83 | 598.40±204.01 |
| p=0.015 | p<0.001 | p<0.001 | p=0.010 | p=0.996 | p=0.580 |
Shows the mean±standard deviation and analysis using Student's t-test for paired samples.
Our study showed a reduction in the fat and energy content measured by the creamatocrit method in raw and pasteurised breastmilk following freezing at −20°C. This reduction was significant for the first three months of the study in raw milk, and only for the first month in pasteurised milk. Until now, no previous study has assessed the changes in crematocrit values in either raw or pasteurised milk during 3 months of freezing.
Several studies describe an increase in milk lipase activity during freezing at −20°C.15–17 Lipolysis hydrolises triglycerides, increasing the level of free fatty acids in milk and reducing the size of the cream layer. This would account for the findings pertaining to the reduction in fat and energy content measured by the creamatocrit method in raw milk from the initial time point to 3 months of freezing. In our study, we also saw that the reduction in the measured fat content of pasteurised milk only occurred during the first month. It has been reported that pasteurisation reduces the levels of lipase activity,18 and a lower rate of triglyceride hydrolysis could explain why the reduction in the cream layer is smaller in pasteurised milk than in raw milk.
Therefore, while it is likely that the total fat content does not change during freezing, changes in the fat globule affect the creamatocrit value. Lucas et al.11 previously described that the breakdown of fat globules could produce a false decrease in the creamatocrit, although their study did not find significant changes in the creamatocrit after freezing for 2 months. In contrast, other authors14 described a decrease in the creamatocrit after 7 days of freezing at −20°C; in this study, the correlation between the creamatocrit and the lipid and energy content remained strong, but they expressed the need to develop a new formula to calculate the energy content of frozen milk more accurately.
The intermediate values that we observed in our study, both in raw and pasteurised milk, cannot be readily explained, and evince the limitations of the creamatocrit to measure the fat content of processed milk.
The main limitation of this study is that, due to technical problems, we could not make three creamatocrit measurements for each sample, as indicated by the Lucas method,11 although other studies have used duplicate creamatocrit measurements with good results.19,20
For all of the above, we believe that the creamatocrit, while being a method that is easily available in neonatal units, is not the optimal way to measure fat content in previously processed milk. One alternative would be to modify Lucas’ formula11 for its use in frozen or pasteurised milk, or other more valid measurement methods can be used.
Conflicts of interestThe authors have no conflicts of interest to declare.
Please cite this article as: Vázquez-Román S, Alonso-Díaz C, García-Lara NR, Escuder-Vieco D, Pallás-Alonso CR. Medida por crematocrito del contenido calórico de la leche materna donada congelada. An Pediatr (Barc). 2014;81:185–188.
Previous presentation: sent as a paper from a member to the XXIV Congreso de Neonatología y Medicina Perinatal, scheduled to be held in Barcelona in October 2013.


