


Short stature is a family concern, and is a common reason for consultations in paediatrics. Growth charts are an essential diagnostic tool. The objective of this study is to evaluate the impact of changing reference charts in the diagnosis of short stature in a health area.
Subjects and methodsA population-based-cross-sectional-descriptive-study was performed in which the height of children of 4, 6, 10 and 13 years-old were compared with the growth charts of the Fundación Orbegozo 2004 Longitudinal and 2011. The prevalence of short stature and the 3rd percentile of the study sample were calculated.
ResultsThere were 12,256 valid records (89% of the population). The prevalence of short stature increased at all ages with the change in the growth charts, with differences of prevalence of 3.6% (95% CI: 2.8–4.5) at 4 years; 1.8% (95% CI: 1.3–2.3) at 6 years; 2.8% (95% CI: 2.2–3.4) at 10 years, and 1.4% (95% CI: 0.8–1.9) at 13 years. In absolute numbers, it went from 58 diagnoses of short stature with the 2004 Longitudinal charts (34 boys and 24 girls) to 352 with the 2011 (155 boys and 197 girls).
ConclusionsThe change in reference growth charts has increased by 6-fold the number of diagnoses of short stature. The pathological condition found in the cases diagnosed with the 2011 growth charts that had not been diagnosed with the previous charts will allow us to evaluate the suitability of the change.
La talla baja es motivo de preocupación familiar y constituye una consulta frecuente en pediatría. Para su diagnóstico las gráficas de crecimiento son una herramienta imprescindible. El objetivo de este estudio es evaluar el impacto del cambio de gráficas de referencia en el diagnóstico de talla baja en nuestra área de salud.
Sujetos y métodosEstudio descriptivo transversal de base poblacional. Los valores de la talla de los niños y niñas de 4, 6, 10 y 13 años se compararon con las tablas de la Fundación Orbegozo 2004 Longitudinal y 2011. Se calcularon las prevalencias de talla baja y el percentil 3 de la muestra del estudio para realizar las comparaciones.
ResultadosSe obtuvieron 12.256 registros válidos (89% de la población). La prevalencia de talla baja aumentó en todas las edades con el cambio de las gráficas: diferencia de prevalencias del 3,6% (IC95%: 2,8 a 4,5) a los 4 años; 1,8% (IC95%: 1,3 a 2,3) a los 6 años; 2,8% (IC95%: 2,2 a 3,4) a los 10 años y 1,4% (IC95%: 0,8 a 1,9) a los 13 años. En números absolutos, se pasó de 58 diagnósticos de talla baja con las gráficas 2004 (34 niños y 24 niñas) a 352 con las 2011 (155 niños y 197 niñas).
ConclusionesEl cambio de referencia ha multiplicado por 6 el número de diagnósticos de talla baja. La patología hallada en los casos diagnosticados con las gráficas 2011 que no se hubieran diagnosticado con las gráficas anteriores nos permitirá evaluar la idoneidad del cambio realizado.
Short stature in childhood is a source of anxiety for the family and a frequent reason for consultation in primary care and paediatric endocrinology clinics. Growth charts allow the diagnosis of abnormalities in height and are an indispensable tool for monitoring the growth of children.1 However, in recent years the selection of the appropriate growth standard to be used as reference has become a subject of debate in many countries.2–5
Since the mid-19th century, the body size of the population of developed countries has been increasing progressively, especially in some countries in Northern Europe. This is what is known as a secular trend. Although this trend seems to have stabilised in recent decades in countries such as Denmark, Sweden, Norway or Italy, it is still ongoing in other countries like Spain.6 This fact has inspired a movement in favour of developing growth charts based on local populations and evinced the need to update these standards periodically to adapt them to changes in the population and secular trends.7–9 On the other hand, since the World Health Organization (WHO) published its child growth standards in 2006, other debates have emerged regarding the superiority of international growth charts compared to local ones and of growth standards over growth reference data.5,10–12
In the Basque country, the growth charts of the Fundación Orbegozo have been used as reference since their first edition in 1985.13 For many years, the percentile curves of the 2004 longitudinal study of the Fundación Orbegozo (FO04_L) have been included in the electronic health records and primary care well-child notebooks for assessment of children in the Basque Country.14 Recently, the 2004 charts have been replaced by the charts published in 2011 (FO11).15
The main objective of our study was to assess the impact of replacing the FO04_L charts for the FO11 charts in the prevalence of the diagnosis of short stature in children aged 4, 6, 10 and 13 years in our health district. The secondary objectives included calculating the prevalence of short stature using the growth charts of the WHO,16,17 the Cross-Sectional Study in Spain of 2010 (Estudio Transversal Español, ETE10),18 the charts of Fundación Orbegozo published in 1988 (FO88), and the cross-sectional Fundación Orbegozo charts of 2004 (FO04_CS) and the 3rd percentile (P3) in the sample of children under study.
Participants and methodsWe conducted a population-based cross-sectional descriptive study.
Study universe and data collection: children in the integrated health system district of Donostialdea that turned 4, 6, 10 or 13 years of age in 2015. The Donostialdea district includes the city of Donostia-San Sebastian and 16 neighbouring towns. The growth of children of the selected ages was evaluated in the corresponding primary care centre or in school during the 2015–2016 academic year. Assessments in public schools were carried out by school nurses employed by the City Council of Donostia-San Sebastian and assessments in publicly funded private schools by nurses employed by the public health system of the Basque Country (Osakidetza).
We collected anonymised data for height and sex by mining the electronic health records in the primary care database (Osabide AP, built using Oracle Business Intelligence Enterprise Edition). We also anonymised the health data collected from public schools for the purpose of the study. We excluded data of health checkups performed in children that had been held up one or more academic years to obtain a more homogeneous sample.
We calculated the age in years in months based on the recorded dates of the evaluations and the date of birth. We grouped the data in 6-month age intervals to compare results obtained with the 1988, 2004 and 2011 charts of the Fundación Orbegozo, which published data using these age intervals. Although the WHO has published growth data with intervals of 1 month, we also grouped these results in 6-month intervals to facilitate comparisons with the Fundación Orbegozo charts.
We defined short stature as a height below the 3rd percentile.
We used the FO04_L and FO11 charts for the purpose of our primary objective. For the secondary objective of the study, we also used the FO88, ETE10, FO04_CS growth charts and the WHO child growth standards for children aged 4 years and the WHO height-for-age references for ages 5–19 years for all other children in the sample.
Statistical analysis: we present the prevalence of short stature by age and sex calculated using each of the aforementioned growth charts. In addition, we made comparisons to assess for significant differences based on sex using the χ2 test. We also calculated the height z-scores of children given a diagnosis of short stature based on the FO11 charts and the P3 threshold in the sample under study. Lastly, we assessed the degree of agreement between the classification of boys and girls using the reference standard (FO11) and the other growth charts by means of the kappa coefficient, defining poor agreement as a value of 0–0.2; fair agreement as a value of 0.21–0.4; moderate agreement as a value of 0.41–0.60; good agreement as a value of 0.61–0.80; and excellent agreement as a value of 0.81–1.
We performed the statistical analyses with the software R version 3.1.1.
The study was approved by the Clinical Research Ethics Committee of the Health Area of Gipuzkoa.
ResultsWe found valid records for 12256 of the 13739 children registered in the county census in 2015 (89%), corresponding to 88% of children aged 4 years, 92% of children aged 6 years, 90% of children aged 10 years and 87% of children aged 13 years. The sex distribution of the sample was 51% male and 49% female, with no significant differences compared to the sex distribution in the population of the census for the total population or by age group (Table 1).
The prevalence of short stature in our sample based on the FO04_L charts was the lowest for every age group compared to the one obtained with all the other growth charts, with values of 1.1% at age 4 years (95% confidence interval [CI], 0.7–1.5), 0.2% at age 6 years (95% CI, 0.08–0.4), 0.1% at age 10 years (95% CI, 0.04–0.3) and 0.5% (95% CI, 0.3–0.9) at age 13 years (Table 2). Using the FO11 growth charts, the prevalence was 4.7% at age 4 years (95% CI, 4–5.6), 2% at age 6 years (95% CI, 1.6–2.6), 2.9% at age 10 years (95% CI, 2.4–3.6) and 1.9% at age 13 years (95% CI, 1.4–2.4). Therefore, the switch from the FO04_L to the FO11 charts has resulted in an increase in the proportion of children given a diagnosis of short stature, with differences in the estimated prevalence of 3.6% at age 4 years (95% CI, 2.8–4.5), 1.8% at age 6 years (95% CI, 1.3–2.3), 2.8% at age 10 years (95% CI, 2.2–3.4) and 1.4% at age 13 years (95% CI, 0.8–1.9). Table 3 presents the height z-scores of children considered to have short stature using the FO11 charts by age and sex. In absolute terms, there has been an increase from 58 diagnoses of short stature using the FO04_L charts (34 boys and 24 girls) to 352 using the FO11 charts (155 boys and 197 girls). When it came to sex, we found significant differences between boys and girls using the FO11 charts at age 10 years and values nearing statistical significance at ages 4 and 6 years. The calculated prevalences were higher in girls at ages 4 and 10 years. These differences did not occur using the FO04_L charts (Fig. 1).
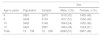
Prevalence of short stature based on the growth chart used for assessment.
| Short stature | |||
|---|---|---|---|
| Age in years | Male, n (%) | Female, n (%) | Total, n (%) |
| FO11 | |||
| 4 | 61 (4.03) | 79 (5.43) | 140 (4.71)** |
| 6 | 40 (2.47) | 24 (1.56) | 64 (2.03)** |
| 10 | 29 (1.71) | 63 (4.34) | 92 (2.92)* |
| 13 | 25 (1.71) | 31 (2.03) | 56 (1.91) |
| FO04_longitudinal | |||
| 4 | 16 (1.06) | 16 (1.1) | 32 (1.08) |
| 6 | 4 (0.25) | 2 (0.13) | 6 (0.19) |
| 10 | 2 (0.12) | 2 (0.14) | 4 (0.13) |
| 13 | 12 (0.8) | 4 (0.26) | 16 (0.54)** |
| FO04_cross-sectional | |||
| 4 | 56 (3.7) | 108 (7.42) | 164 (5.52)* |
| 6 | 26 (1.61) | 39 (2.54) | 65 (2.06)** |
| 10 | 30 (1.77) | 54 (3.72) | 84 (2.67)* |
| 13 | 18 (1.23) | 31 (2.03) | 49 (1.64) |
| FO88 | |||
| 4 | 25 (1.65) | 29 (1.99) | 54 (1.82) |
| 6 | 7 (0.43) | 9 (0.59) | 16 (0.51) |
| 10 | 13 (0.77) | 8 (0.55) | 21 (0.67) |
| 13 | 13 (0.89) | 11 (0.72) | 24 (0.8) |
| ETE10 | |||
| 4 | 35 (2.31) | 50 (3.44) | 85 (2.86) |
| 6 | 20 (1.95) | 26 (1.69) | 46 (1.80) |
| 10 | 34 (2.01) | 26 (1.79) | 60 (1.91) |
| 13 | 25 (1.71) | 32 (2.10) | 57 (1.91) |
| WHO | |||
| 4 | 25 (1.65) | 38 (2.61) | 63 (2.12)** |
| 6 | 11 (0.68) | 10 (0.65) | 21 (0.67) |
| 10 | 11 (0.65) | 17 (1.17) | 28 (0.89) |
| 13 | 23 (1.57) | 21 (1.38) | 44 (1.47) |
We made comparisons to assess differences in prevalence based on sex.
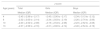
Z-scores of girls and boys with a short stature diagnosis based on the FO11 charts.
| z-score | |||
|---|---|---|---|
| Age (years) | Total | Girls | Boys |
| Median (IQR) | Median (IQR) | Median (IQR) | |
| 4 | −2.45 (−2.99 to −2.17) | −2.45 (−2.90 to −2.17) | −2.34 (−3.13 to −2.12) |
| 6 | −2.32 (−2.63 to −2.14) | −2.34 (−2.63 to −2.19) | −2.26 (−2.74 to −2.06) |
| 10 | −2.20 (−2.52 to −2.08) | −2.19 (−2.54 to −2.08) | −2.23 (−2.52 to −2.08) |
| 13 | −2.37 (−2.56 to −2.16) | −2.31 (−2.60 to −2.14) | −2.46 (−2.54 to −2.19) |
IQR, interquartile range.

Overall, use of the WHO and FO88 charts resulted in low prevalence estimates, although somewhat higher compared to the FO04_L charts, while use of the ETE10, FO04_CS and FO11 charts led to higher estimates, especially with the latter 2 at ages 4 and 10 years (Fig. 2).

The assessment of the agreement between each growth standard and the FO11 charts used as reference found excellent agreement only with the FO04_CS charts (kappa=0.85). The agreement with the ETE10, WHO and FO88 charts was moderate (kappa=0.52, 0.51 and 0.49, respectively) and the agreement with the FO04_L charts was weak (kappa=0.28).
On the other hand, we calculated the values corresponding to the P3 in our sample (study) to compare them with the P3 in the FO04_L and FO11 charts. The P3 in study participants was clearly above the P3 of the FO04_L charts in all age groups, especially at age 6 years and up. Compared to the FO11 charts, the P3 values in our sample were quite similar, slightly lower at age 4 years for girls and up to age 6 years for boys. At older ages, the values in our sample were higher, with the exception of girls at age 10.5 years (Tables 4 and 5; Fig. 3). Fig. 3 also presents the comparison of the P3 values for weight to better describe the growth of children in our sample.
Comparison of P3 values for height in girls.
| Age (years) | n | Sample | FO11 (difference in cm) | FO04_L (difference in cm) |
|---|---|---|---|---|
| 4 | 1.258 | 95 | 96.28 (−1.28) | 92.65 (2.35) |
| 4.5 | 54 | 101 | 99.24 (1.76) | 95.48 (5.52) |
| 6 | 760 | 108 | 107.3 (0.7) | 103.07 (4.93) |
| 6.5 | 539 | 111.5 | 109.95 (1.55) | 105.5 (6) |
| 10 | 536 | 130.5 | 129.83 (0.67) | 123.64 (6.86) |
| 10.5 | 610 | 131.4 | 132.71 (−1.31) | 125.47 (5.93) |
| 13 | 617 | 145.7 | 145.05 (0.65) | 138.34 (7.36) |
| 13.5 | 632 | 149.5 | 146.87 (2.63) | 140.52 (8.98) |
Comparison of P3 values for height in boys.
| Age (years) | n | Sample | FO11 (difference in cm) | FO04_L (difference in cm) |
|---|---|---|---|---|
| 4 | 1285 | 96.5 | 97.01 (−0.51) | 92.95 (3.55) |
| 4.5 | 77 | 98.3 | 100.23 (−1.93) | 95.97 (2.33) |
| 6 | 799 | 108.5 | 108.85 (−0.35) | 103.63 (4.87) |
| 6.5 | 600 | 113 | 111.43 (1.57) | 105.46 (7.54) |
| 10 | 601 | 129 | 127.84 (1.16) | 122.33 (6.67) |
| 10.5 | 758 | 132 | 130.23 (1.77) | 124.66 (7.34) |
| 13 | 557 | 143.9 | 143.27 (0.63) | 137.07 (6.83) |
| 13.5 | 651 | 148.5 | 146.06 (2.44) | 140.85 (7.65) |

Our study reveals that the proportion of children given a diagnosis of short stature varies significantly depending on the growth charts that are used as reference. The prevalence values calculated with the FO04_L charts were very low for all ages: 1.1% at 4 years; 0.2% at 6 years; 0.1% at 10 years and 0.5% at 13 years. With the FO11 charts, these values rose to 4.7% at 4 years; 2% at 6 years; 2.9% at 10 years and 1.9% at 13 years. Therefore, the switch from the FO04_L to the FO11 charts has resulted in a significant increase in the frequency of short stature diagnoses in boys and girls of all ages in our study. Unlike the FO04_L charts, the FO11 charts also resulted in differences in prevalence between the sexes. In boys, the prevalence was highest at age 4 years and gradually decreased with age until reaching the lowest values at ages 10 and 13 years, whereas the pattern in girls oscillated, with a higher prevalence at ages 4 and 10 years and decreases in prevalence at ages 6 and 13 years (Fig. 1).
As a secondary objective, we calculated the prevalence using the WHO, ETE10, FO88 and FO04_CS charts. The prevalence was low using the WHO and FO88 charts, although slightly higher compared to the prevalence obtained with the FO04_L charts. Use of the ETE10, FO04_CS and FO11 chars resulted in higher prevalence values, especially with the latter two at ages 4 and 10 years.
Several factors need to be taken into account to explain the findings of our study: the definition of short stature, secular growth trends and the growth charts employed. The diagnosis of short stature in paediatrics is made based on a statistical perspective.19 Thus, abnormally short stature is defined as a height corresponding to the lowest 2.5–3% of the population distribution (values more than 2 standard deviations below the mean or below the P3, respectively). In this sense, if the population under study was similar to the reference population from which the chart used for diagnosis was developed, we would expect to find a proportion of children with a diagnosis of short stature of about 2.5–3%.
On the other hand, the secular growth acceleration described in Spain shows that height and weight have increased progressively in recent decades, a change that is reflected in the latest growth charts.20–22 Successive studies on growth conducted in different regions, including studies by the Fundación Orbegozo, are proof of this secular growth acceleration in Spain. The FO04_L charts, which were developed from data collected in a longitudinal study with a followup period of 18 years starting in 1978, and the FO88 charts, developed based on a mixed longitudinal study conducted between 1978 and 1985, give lower values for the prevalence of short stature compared to the more recent FO04-CS and FO11 charts. The latter were developed from data obtained in a cross-sectional study with a sample of 6443 individuals aged 0–18 years representative of the population of Bizkaia between years 2000 and 2001. These data were published independently and also integrated in the Spanish Growth Study of 201018 along with data from other cross-sectional and longitudinal studies conducted between 2000 and 2010 in Andalucía, Aragon, Catalonia and Madrid. Lastly, the WHO growth reference data for children aged 5–19 years, while published in 2007, are a reconstruction of the 1977 National Center for Health Statistics/WHO with exclusion of obesity cases,23,24 so they do not take into account secular changes in growth in recent decades.
Taking into account the time differences between the reference charts and the secular increase in growth and height, it is to be expected that the current paediatric population is taller compared to the populations represented in the FO04_L, WHO or FO88 charts, and similar to the populations represented in the FO11 and FO04_CS charts. Along the same lines, we found that the P3 values in our sample were similar to those in the FO11 charts and clearly higher compared to the FO04_L charts (Fig. 3).
In the last decade, several studies conducted in Europe have been published on the subject of growth charts and short stature. Some compare national charts over time, although most compare national charts with the WHO charts.20,25–27 In 2013 a systematic review was published that analysed data from 55 countries and ethnic groups.28 Its conclusions were similar: the use of older charts and the WHO charts resulted in lower prevalence values compared to more recent charts, as they do not take into account secular trends.
In our study, we succeeded in collecting data for 98% of the paediatric population in our health district. Anthropometric measurements were taken in primary care centres and schools, public and private, of San Sebastian. We consider the large sample size and the diversity of data sources strengths of our study. Among the limitations of our study, we ought to mention our inability to collect information on the ethnicity and stage of pubertal development of participants and the use of different stadiometers by the many professionals that carried out the measurements, which may have an impact on the accuracy of the collected data.29
As a consequence of the change in the growth charts used for assessment, there has been a 6-fold increase in the diagnosis of short stature, going from 58 cases with the FO04_L charts (34 boys and 24 girls) to 352 with the FO11 charts (155 boys and 197 girls). The purpose of labelling children as having short stature is to detect potential health problems that are hindering growth. With this in mind, we should consider whether we are underdiagnosing disease using the FO04_L charts or overdiagnosing disease in healthy children using the FO11 charts.
The results at age 4 years are particularly striking, as the prevalence of short stature is highest at this age independently of the chart used (Fig. 2). Although it is possible that this outcome is due to the charts themselves, we cannot rule out the possible influence of technical difficulties with the measurement of height (which requires standing) in younger children on the recorded results.30 In the future longitudinal followup of these children, it will be interesting to see whether these proportions of short stature remain unchanged at age 6 years. Another finding worth highlighting is the high prevalence of short stature detected in girls aged 10 years, double that of boys, using the FO11 chars. Although differences in the pattern of physical maturation between sexes could account for the observed difference, this difference does not occur using the FO04-L, FO88 or WHO charts.
The ultimate purpose of monitoring growth at the primary care level is to ensure adequate weight and height gain during childhood with the aim of achieving a normal height and a healthy weight in adulthood. In our study, we evaluated boys and girls at different timepoints in the growth process (4, 6, 10 and 13 years). The values of the P3 for height and especially of the P3 for weight found in our sample were higher even compared with the FO11 charts in some of the age groups under study (Tables 4 and 5; Fig. 3). It is known that increased weight gain can lead to premature acceleration of growth without leading to a higher final height,31–35 as described in studies in populations with a high prevalence of childhood overweight and obesity.27 Other studies in Northern Europe, however, have found increases in height that were not associated with significant increases in weight.8 Our study does not allow us to predict how the growth of these children will unfold or whether their adult height will be higher compared to the FO11 charts, as the cross-sectional design of the study does not allow calculation of the growth velocity of participants and we do not have data on their pubertal development. This is a limitation of our study in the analysis of results in boys and girls aged 10 and 13 years. The assessment of height in girls and boys that are very early, early, late and very late maturers in comparison to data obtained from the general population as opposed to specific charts for different types of maturers (such as those included among the ETE10 charts or made with data from the 1995–2017 Barcelona longitudinal growth study18,36) may lead to error if these children are growing around the P3.
Being tall is generally considered a desirable trait in our society. Labelling a child as having short stature, in addition to the negative social connotations that it carries, indicates a suspicion of possible disease and leads to performance of tests for aetiological diagnosis at the primary care level and eventually referral to a paediatric endocrinology specialist. It is important to remember that there is no growth chart that can be considered the gold standard for diagnosis of short stature, and therefore that other factors need to be taken into account, such as birth length and weight for gestational age, growth velocity, parental height, stage of pubertal development, intercurrent disease, emotional deprivation and other factors that would allow a more accurate diagnosis.37
ConclusionsThe change in growth charts has resulted in a 6-fold increase in the diagnosis of short stature. The assessment of pathology in cases diagnosed with the FO11 charts that would not have been diagnosed with previously used growth charts will allow us to assess the appropriateness of this change in the standard used for diagnosis.
FundingNone.
Conflict of interestThe authors have no conflicts of interest to declare.
We thank the Unit of Primary Care Research-Integrated Care Network of Gipuzkoa de Gipuzkoa for their support in designing the study, the Donostialdea Health District for its support in the management of the project and the City Council of Donostia-San Sebastian for granting us access to its data.
Please cite this article as: Galdeano PA, Abad MM, Alonso ÁA, Irureta SJ, Goikoetxea BC, Ruiz SG, et al. Efecto del cambio de gráficas de crecimiento de referencia en la prevalencia de talla baja. An Pediatr (Barc). 2020;92:28–36.
