


Status epilepticus (SE) is the most frequent neurologic emergency in the paediatric age group, with an incidence of 18–23 cases per 100000 children per year.1 These patients need to be monitored in the paediatric intensive care unit (PICU), which frequently requires strong sedation. On the other hand, bispectral index (BIS) monitoring is a quantitative method based on electroencephalogram (EEG) signals used to assess the depth of anaesthesia.2 The bilateral BIS system allows the use of four EEG channels, adding new variables to those already in use. One of them is the density spectral array (DSA), a colour display that represents the frequencies and amplitudes of brain waves through time, with the colour spectrum ranging from blue (minimum amplitude) to dark red (maximum amplitude).
We present the cases of two patients in which the use of the DSA was useful in the detection and monitoring of SE.
Case 1Boy aged 5 months admitted for head trauma. At admission, he had a partial seizure with clonic movements in the left leg that did not respond to antiepileptic treatment and progressed to a secondary generalised tonic-clonic SE. The patient was intubated and an EEG requested that showed focal epileptiform discharges in the right frontal region and slow waves in the left temporo-occipital region (Fig. 1A). The epileptiform activity disappeared with administration of midazolam, and we placed a bilateral BIS sensor to adjust the depth of anaesthesia. At 40min the DSA showed an abrupt change, shifting from orange, yellow and green colours in the low-frequency bands to dark red tones (Fig. 1B), with no clinical evidence of ictus. The BIS electroencephalographic signal showed epileptiform discharges similar to those seen in conventional EEG, which were interpreted as recurrent epileptic activity. Since continuous video-EEG monitoring (cEEG) was not available, we administered thiopental, after which the discharges no longer appeared in the display and green and yellow tones reappeared in the DSA. The following day, a new EEG confirmed the absence of epileptiform activity.
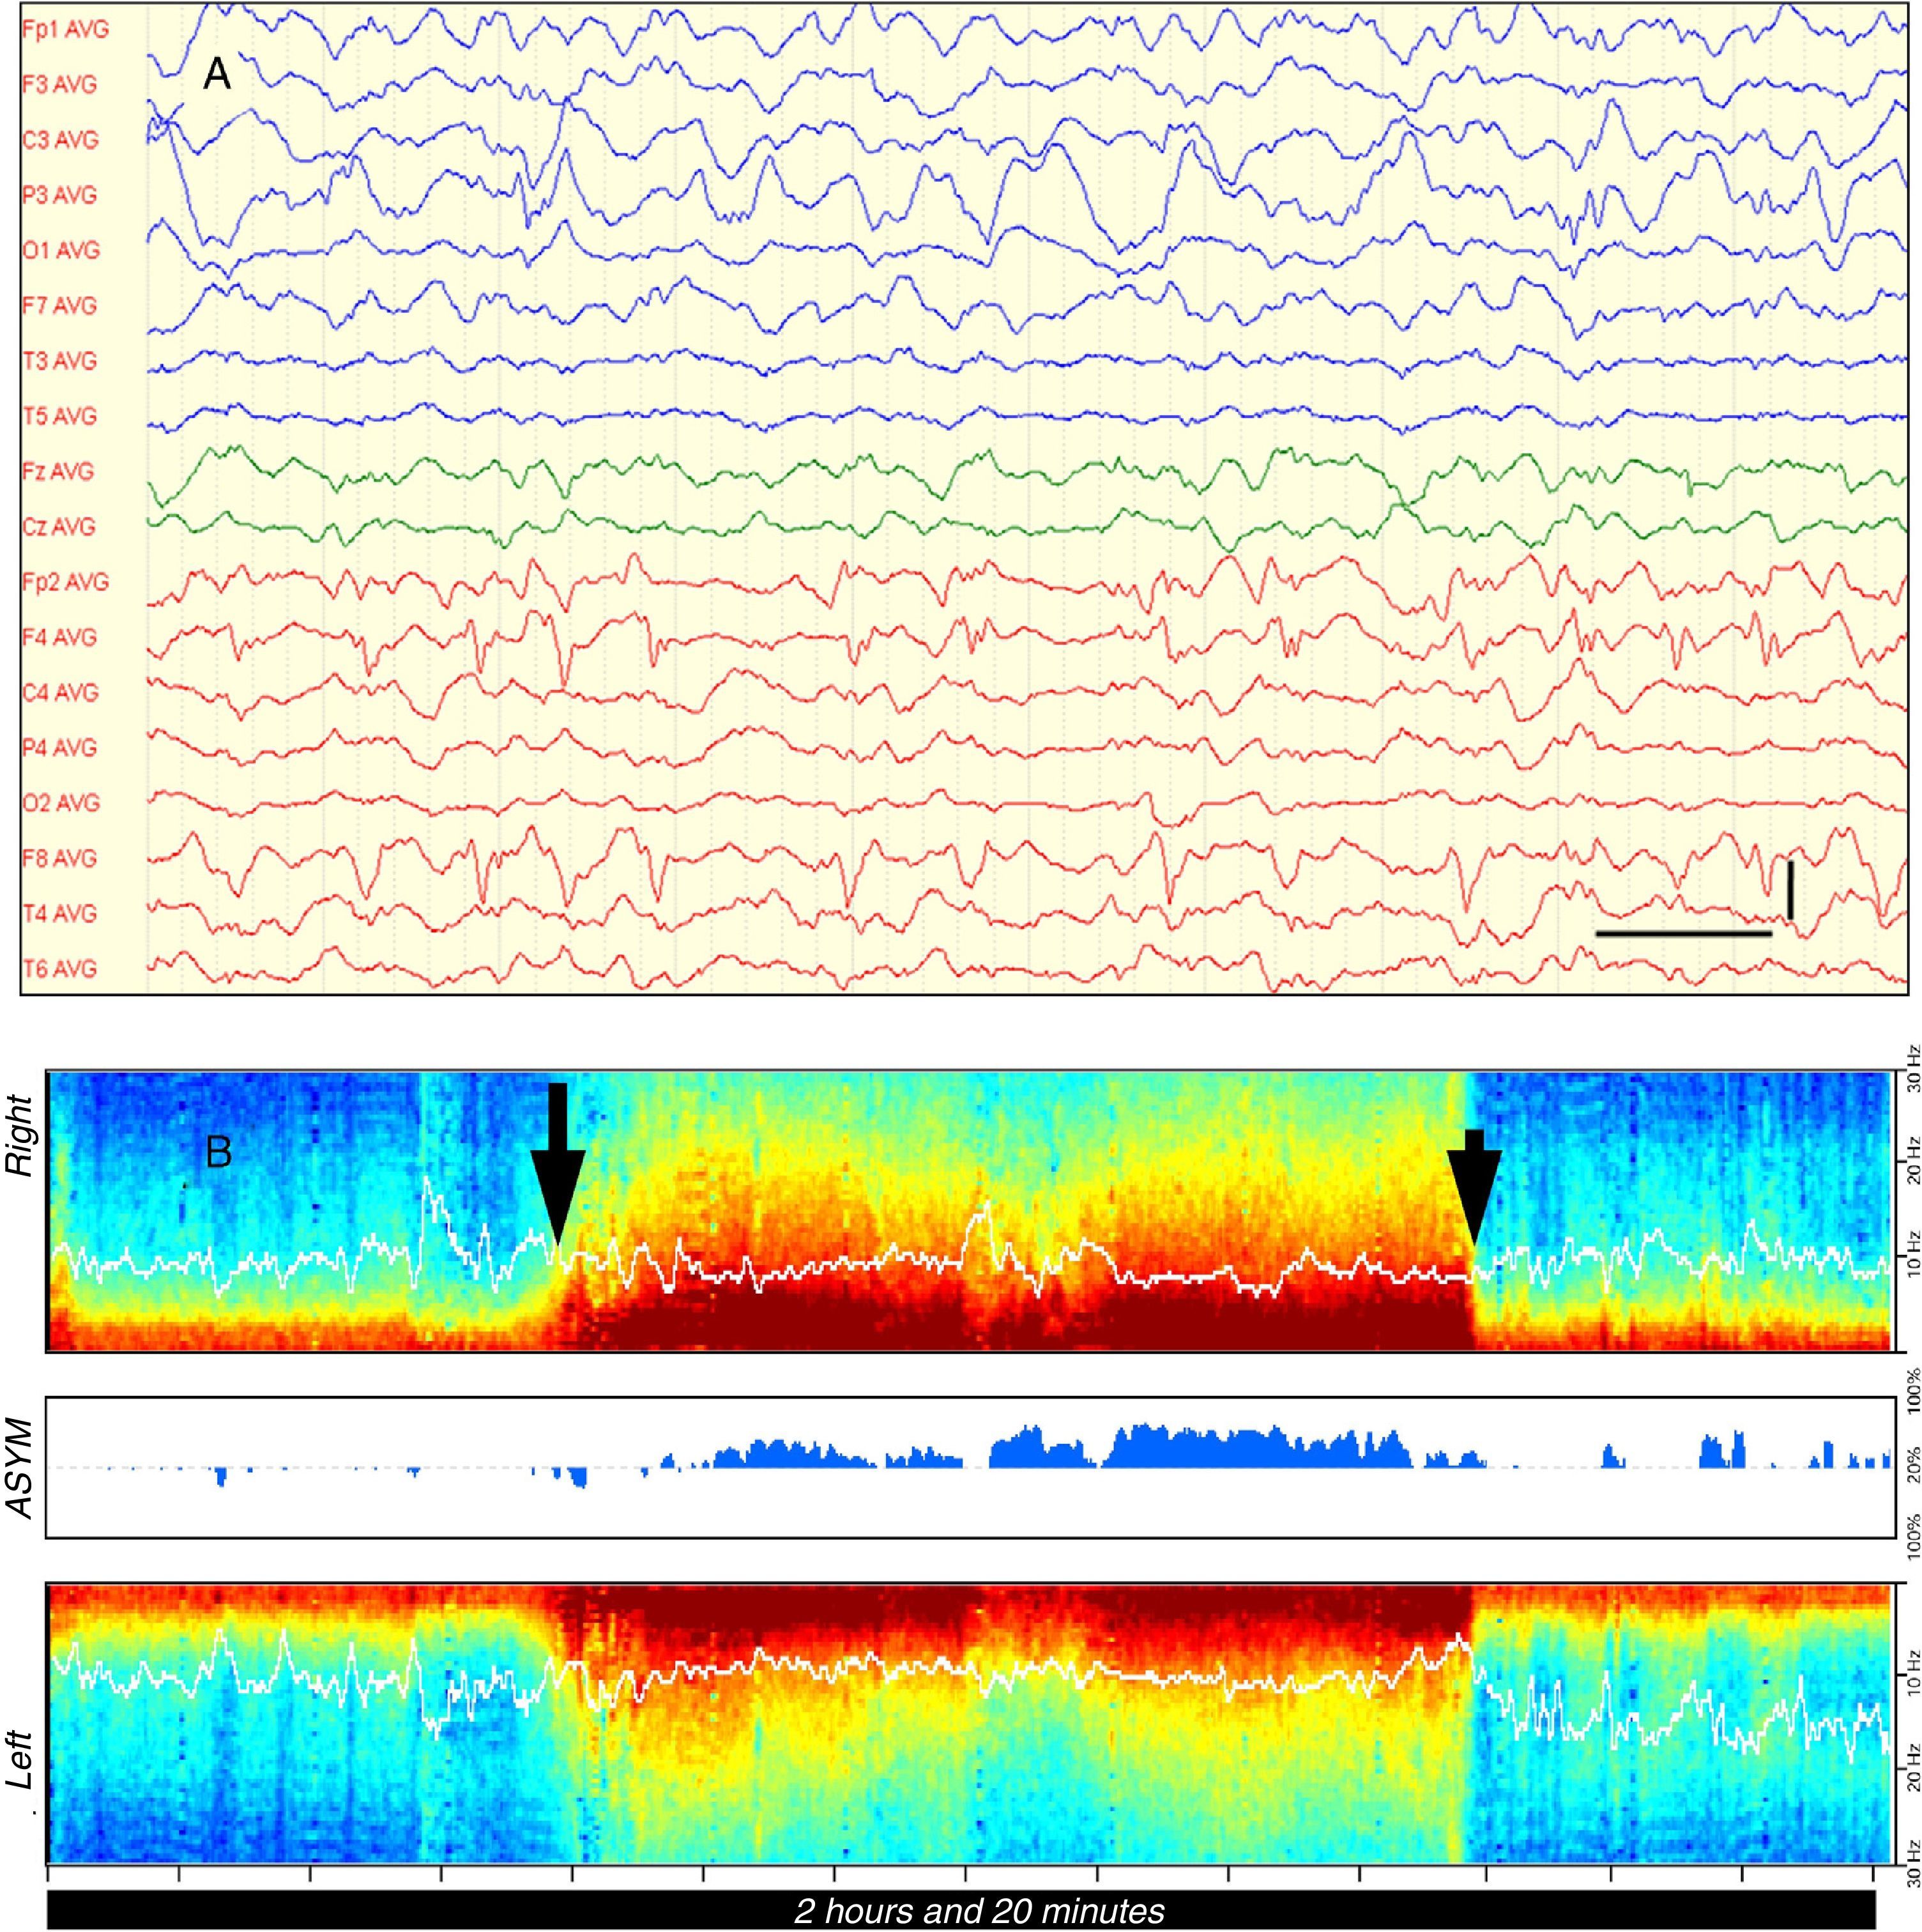
Case 1 (A) EEG showing frequent focal epileptiform discharges involving the entire right frontal lobe (Fp2, F4, F8) and increased slow waves in the left temporo-occipital region; low-frequency filter: 0.53Hz; high-frequency filter: 30Hz; notch filter: 50Hz. Vertical bar: 100μV, horizontal bar: 1s; (B) DSA showing an abrupt change in colour (long arrow) from orange, yellow and green tones to dark red tones in the low-frequency band (<10Hz), suggestive of recurrent epileptic activity. After a little over one hour, the DSA returned to its previous features concurrently with the administration of thiopental (short arrow). The white line in the DSA represents the spectral edge frequency (SEF), which is the frequency in Hertz below which 95% of the power of the brain resides. (In the black and white printout, the dark red in the low-frequency band appears as dark grey tones that are nearly black.)
Girl aged 7 years admitted for suspected meningoencephalitis. She had a partial seizure with clonic movements in the left shoulder that did not respond to antiepileptic treatment and progressed to a secondary generalised tonic-clonic SE. The patient was intubated and given midazolam intravenously, which achieved control of the clonic movements. However, the EEG showed continuous bilateral asymmetrical epileptiform discharges of spike-and-wave complexes with maximum amplitudes in the right temporo-occipital and temporal regions (Fig. 2A). We administered thiopental intravenously and placed a bilateral BIS sensor to titrate the barbiturate sedation. At first, we observed epileptiform discharges in the BIS EEG channels associated to a spike pattern with predominance of dark red tones in the DSA, which gradually changed to blue colours with a BIS value of 10 that served as the therapeutic target for maintaining a burst-suppression pattern (Fig. 2B). At 48h, a new conventional EEG confirmed the absence of seizures.
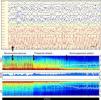
![Case 2 (A) EEG with evidence of bilateral epileptiform discharges with spike-and-wave complexes between 2 and 3Hz and up to 300μV in amplitude, with maximum amplitude in the temporal lobe and parieto-occipital regions of the right hemisphere (F8, T4, T6, O2). Low-frequency filter: 0.53Hz; high-frequency filter: 30Hz; notch filter: 50Hz. Vertical bar: 200μV, horizontal bar: 1s; (B) DSA initially characterised by a dark red spike pattern with predominance of the right hemisphere due to the high amplitude of the epileptic discharges on this side. Following initiation of IV thiopental, the DSA shows a progressive change until blue tones become predominant, which indicates a drop in brain wave amplitude consistent with a burst-suppression pattern. (In the black and white printout, the dark red in the low-frequency band appears as dark grey tones that are nearly black. Following initiation of thiopental, these tones lighten progressively under the white line [SEF] until they disappear.)](https://static.elsevier.es/multimedia/23412879/0000008500000001/v1_201606240044/S2341287916300801/v1_201606240044/en/main.assets/gr2.jpeg?xkr=ue/ImdikoIMrsJoerZ+w9/qVHBXBqbSQ7FNUvNof+6+l4v03CmyaR9Rm+q8TRfDEOS68CZK9bYY3KxU3zGztanhQ4PEHDvUjlqTDXqPm4BZHTJ0xMGNcLK6QqsRopTe/kpEuCaKc6gwg3m6CkxKrEqQqiFQbtr0HjweYaONhVCta3xMOko7eVfuFeSqyEZxanjG9KgjutOSTwvGznHOg30B59WvC9rc2nl4d1DKFRELles7ooiuBdc8eTa6RB92aQjhk1CBQgo9eQKnotDCRRWR/Ss4x3E36G+AWNEIYmQA=)
Case 2 (A) EEG with evidence of bilateral epileptiform discharges with spike-and-wave complexes between 2 and 3Hz and up to 300μV in amplitude, with maximum amplitude in the temporal lobe and parieto-occipital regions of the right hemisphere (F8, T4, T6, O2). Low-frequency filter: 0.53Hz; high-frequency filter: 30Hz; notch filter: 50Hz. Vertical bar: 200μV, horizontal bar: 1s; (B) DSA initially characterised by a dark red spike pattern with predominance of the right hemisphere due to the high amplitude of the epileptic discharges on this side. Following initiation of IV thiopental, the DSA shows a progressive change until blue tones become predominant, which indicates a drop in brain wave amplitude consistent with a burst-suppression pattern. (In the black and white printout, the dark red in the low-frequency band appears as dark grey tones that are nearly black. Following initiation of thiopental, these tones lighten progressively under the white line [SEF] until they disappear.)
In cases of convulsive SE, the disappearance of clinical seizures does not always correspond to control of the SE, and persisting epileptic discharges have been described in up to 48% of patients without motor manifestations (nonconvulsive SE).3 For this reason, cEEG monitoring is recommended to verify the effectiveness of treatment, although it is not widely available in Spanish PICUs yet.
On the other hand, the complexity of the interpretation of cEEG monitoring tracings has led to the development of algorithms based on the quantitative analysis of the signal, such as amplitude-integrated EEG or colour DSA, with the purpose of simplifying the review of long-term EEG data. In this regard, Pensirikul et al.4 evaluated DSA in the detection of epileptic seizures in 21 critical children, and obtained favourable results.
Our group has previously described the use of the bilateral BIS DSA in adults with SE,5,6 finding that the presence of dark red tones in the low-frequency bands is suggestive of SE. However, variations in the amplitude, frequency and rhythm of epileptiform discharges in each patient require the comparison of the SDA with the findings of a conventional EEG interpreted by an expert neurophysiologist in order to establish the patterns displayed by the DSA during seizures and periods of seizure control.
Keeping in mind the limitations of BIS monitoring in relation to muscle artefacts and the scarcity of parieto-occipital region data, the described cases show that the bilateral BIS monitoring DSA could be used as a supplementary tool for monitoring SE, especially in facilities where cEEG monitoring is not available.
Please cite this article as: Hernández-Hernández MA, Iglesias-Posadilla D, Ruiz-Ruiz A, Gómez-Marcos V, Fernández-Torre JL. Matriz de densidad espectral de color del BIS bilateral en estado epiléptico. An Pediatr (Barc). 2016;85:44–47.
