


Adjusted morbidity groups (AMG) are being used in the stratification of chronic patients in Primary Care (PC). The aim of this study was to describe the characteristics, prevalence of comorbidities, and use of PC services by chronic paediatric patients as well as to analyse factors associated with the weight of complexity according to AMG.
Patients and methodsA cross-sectional study conducted on patients < 18 years-old from a basic health area, classified as chronic according to the AMG of the Madrid Primary Care computerised clinical records. Sociodemographic and clinical-care variables were collected, as well as the use of services in PC. Univariate, bivariate and linear regression analysis were performed.
ResultsA total of 2961 patients < 18 years were included, of whom 423 (15.7%) were identified as chronic, and 408 (96.5%) were low risk patients. Their mean age was 9.5 (SD = 4.7) years, and 54.1% were male. The mean of chronic diseases was 1.1 (SD = 0.4) and 11.3% had multiple morbidity. The most prevalent diseases were asthma (6.1%), attention deficit hyperactivity disorder (ADHD) (1.8%), and obesity (1.4%). The mean number of visits to the paediatrician was 4.9 (SD = 6.3). Age < 5 years-old (Coefficient B [CB] = 2.6, 95% CI = 2.1, 3.1), number of chronic diseases (CB = 1.6, 95% CI = 1.1; 2.1), and annual contacts with PC (CB = 0.1, 95% CI = 0.06; 0.11) were associated with greater complexity weight.
ConclusionsA significant number of patients with chronic diseases were found in the paediatric population. The most prevalent diseases were asthma, ADHD, and obesity. The use of PC services was high. The greatest complexity corresponded to nursing and pre-school age, multiple morbidity, and higher number of contact with PC.
Los grupos de morbilidad ajustados (GMA) están siendo utilizados en la estratificación de los pacientes crónicos en Atención Primaria (AP). El objetivo del estudio fue describir las características, prevalencia de comorbilidades y utilización de servicios en AP de los pacientes crónicos pediátricos y analizar factores asociados al peso de complejidad según GMA.
Pacientes y MétodosEstudio observacional descriptivo transversal. Se incluyeron los pacientes <18 años de una zona de básica de salud clasificados como crónicos según los GMA de la historia clínica electrónica de AP de la Comunidad de Madrid. Se recogieron variables sociodemográficas, clínico-asistenciales y de uso de servicios en AP. Análisis univariado, bivariado y regresión lineal.
ResultadosDe los 2961 pacientes <18 años, se identificaron como crónicos 423 (15,7%), de los que 408 (96,5%) eran de bajo riesgo. Su edad media fue 9,5 (DE = 4,7) años y 54,1% eran varones. La media de enfermedades crónicas fue 1,1 (DE = 0,4) y 11,3% tenían multimorbilidad. Las patologías más prevalentes fueron: asma (6,1%), trastorno por déficit de atención e hiperactividad (TDAH) (1,8%) y obesidad (1,4%). La media de visitas al pediatra fue 4,9 (DE = 6,3). Se asoció a mayor peso de complejidad la edad <5 años (Coeficiente B[CB] = 2,6; IC95% = 2,1; 3,1), número de enfermedades crónicas (CB = 1,6; IC95% = 1,1; 2,1) y contactos anuales con AP (CB = 0,1; IC95% = 0,06; 0,11).
ConclusionesEn población pediátrica encontramos un número importante de pacientes con enfermedades crónicas siendo asma, TDAH y obesidad las enfermedades más prevalentes. El uso de servicios de AP fue elevado. La mayor complejidad responde a edad lactante y preescolar, multimorbilidad y mayores contactos con A0050.
In recent decades, we have witnessed an increase in the prevalence of chronic disease, isolated or in comorbidity, in the paediatric population.1–3 This increase is due to various factors, such as the increasing prevalence of chronic diseases (asthma, obesity, atopic dermatitis or coeliac disease, among others),3,4 advances in medical care that resulted in an increase in survival5 and the growing awareness and diagnosis of behavioural and developmental disorders.6,7
Previous epidemiological studies suggest that up to 1 in 4 children have a chronic disease,2 with prevalence estimates ranging from 10% to 30%,3,4,6,8 a heterogeneity mainly due to the absence of standardised criteria for the definition of paediatric chronic disease.9 Mokkink et al. define it as a health care problem lasting at least 3 months that involves frequent hospital admissions, at-home medical care and/or other forms of health care.10 Van Cleave et al. added to this definition the sociodemographic aspects of illness and considered a duration of disease of at least 12 months.4
Of these chronic diseases, asthma is the most frequent in the paediatric population, with a prevalence of about 7% to 15% in Spain11 and an increasing prevalence worldwide.12 Obesity also exhibits a global increasing trend in developed countries, and in Europe, it is a particularly serious problem in the southern states, including Spain, with a prevalence that ranges from 7% to 20%.13,14 Atopic dermatitis is the most prevalent chronic skin disease and affects approximately 10%–20% of children at some point in their lives.15 Coeliac disease is also one of the most common chronic diseases in childhood, affecting approximately 1% of the total population, although there is substantial variability in the reported prevalence values.16 As for attention-deficit hyperactivity disorder (ADHD), its prevalence was estimated at 4%–6% only a few years ago, but recent studies have estimated it at 10%–20%.17
One consequence of this increase in the prevalence of chronic diseases is an increased use of health care services, both at the primary care (PC) level, the entry point to the health care system, and in hospital.18,19 Asthma, for example, is one of the most frequent reasons for PC visits12 and the third leading cause of preventable hospital admission,20 and it is associated with substantial health care costs.21
The aim of instruments used to stratify the population based on morbidity and health care service utilization is to guide the development of care models and identify individuals at increased risk to be able to take proactive and specific action in their care.22 In Spain, the instruments commonly used this far were morbidity classification schemes, such as the Clinical Risk Group23 and the Adjusted Clinical Group24 systems, and in recent years, 13 autonomous communities have introduced the use of the Adjusted Morbidity Group (AMG) system in the context of strategies for management of patients with chronic disease.25 Although there are studies on the usefulness of the AMG system and the stratification of chronic patients by risk level in the general population,26–28 the data on the paediatric population, known to behave differently than the adult population, are scarce.29
Since the chronically ill paediatric population differs significantly from the chronically ill adult population both in the causes of morbidity and in health care utilization, it is reasonable to question whether these morbidity classification schemes should be used in the paediatric population and, if so, whether the classification should include 3 levels of risk or only differentiate between complex paediatric patients with chronic disease and the rest of paediatric patients with chronic disease, without an intermediate risk level.30
The aim of our study was to analyse the characteristics, prevalence of comorbidities and PC utilization of chronic patients aged less than 18 years stratified by level of risk using the AMG system and to analyse the factors associated with the level of complexity determined by the AMG.31
Sample and methodsWe conducted a cross-sectional descriptive and analytical study. We included the 423 patients aged less than 18 years identified as chronic among the patients of the Ciudad Jardín Primary Care Centre in the district of Chamartín, Madrid, which has a catchment population of 18,107 inhabitants, of who 2,691 were aged less than 18 years as of June 30, 2015. The total population residing in this district is of 143,424 inhabitants, with a mean age of 45 years (12.7% aged < 15 years), of who 55% are female and 8.9% non-Spanish, and the district has a MEDEA area deprivation index in the first quartile, corresponding to the least deprived neighbourhoods in Madrid.32
The AMG is a group stratification system that has been integrated in the PC electronic health record system of the Community of Madrid (PC-Madrid), where a patient of any age is considered chronically ill if they have at least one of the chronic diseases listed in Appendix B.33 This grouping system based on the diagnostic codes recorded in the PC-Madrid database for each patients by the health care provider in charge of the patient stratifies the population into mutually exclusive groups based on multimorbidity and complexity. The level of complexity is estimated through the analysis of different variables such as mortality, risk of hospital admission, frequency of PC visits and prescriptions associated to the diagnoses. Based on the individual level of complexity, each patient is assigned to one of the risk levels (Fig. 1).29 The use of AMGs only requires diagnostic information about the patient (diagnostic code and date), with the PC electronic health record system as the essential source of data.26

We analysed sociodemographic variables: age and sex; clinical-health care variables: level of risk and level of complexity based on the AMG31 (individual numerical value obtained through qualitative comparative analyses that assessed the health care needs of users based on variables like mortality, risk of hospital admission, PC visits or prescriptions), number and type of chronic diseases, multimorbidity ((≥ 2 chronic diseases), acute intercurrent comorbidity managed at hospital, number and type of drugs based on the Anatomical, Therapeutic Chemical Classification System (ATC); and variables related to PC service utilization: contacts per year, type of contact (administrative, laboratory or clinical care), form of contact (in person, by telephone, home-based) and provider involved in contact (paediatrician, nurse, family physician or odontologist). We collected these data from the records made in the PC-Madrid database by the PC centre providers managing the patients. We collected data on sociodemographic and clinical-health care variables on June 30, 2015 and PC utilization data for the period ranging from June 30, 2015 and May 30, 2016.
We conducted a descriptive analysis of each variable calculating absolute frequencies and percentages for qualitative variables, and the mean (standard deviation) and median (interquartile range) in addition to performing a normality test for quantitative variables. We calculated the frequency of paediatric patients with chronic diseases and their comorbidities in our basic health area and the distribution of patients by risk level (high, intermediate and low) based on the AMG. We conducted a bivariate analysis comparing qualitative data by means of the chi square test or the Fisher exact test as applicable, and quantitative data by means of the Mann–Whitney U test in case of dichotomous variables and the Kruskal–Wallis test in case of polytomous variables. We applied the Bonferroni correction to the results of multivariate analyses.
To analyse the factors associated with complexity, we fitted a linear regression model in which the dependent variable was the level of complexity and the independent variables were those that had exhibited a statistically significant association in the univariate analysis or considered clinically relevant. We defined statistical significance as a p-value of less than 0.05. We performed the statistical analysis with the software IBM SPSS Statistics version 25.
We performed the analysis on anonymised data, safeguarding patient confidentiality and adhering to current law. The study was approved by the Ethics Committee for Research with Pharmaceuticals of the Hospital Universitario de la Princesa and received a favourable assessment by the Local Commission on Research of the Central Health Care Administration of the Community of Madrid.
ResultsWe identified 423 patients with chronic disease aged less than 18 years (15.7%) with a mean age of 9.5 years (standard deviation [SD], 4.7), of who 229 (54.1%) were male. Stratifying the sample based on the AMG, 408 (96.5%) were classified as low risk, 14 (3.3%) as intermediate risk and 1 (0.2%) as high risk. The mean number of chronic diseases was 1.1 (SD, 0.4), with multimorbidity found in 48 patients (11.3%). The mean number of drugs prescribed was 0.23 (SD, 0.6), and none of the patients met the criteria for polypharmacy. The most frequent types of drugs were those corresponding to the ATC groups R (respiratory system) and N (nervous system), which amounted to 10.6% and 5.2% of prescriptions, respectively (Table 1).
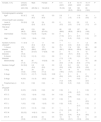
Sociodemographic and clinical-health care-related characteristics of chronic patients aged less than 18 years by sex and age group.
| Variable, n (%) | Chronic patients | Male | Female | P | 0−4 years | 5−9 years | 10−14 years | 15−17 years | P |
|---|---|---|---|---|---|---|---|---|---|
| 423 (100) | 229 (54.1) | 194 (45.9) | 76 (18) | 129 (30.5) | 138 (32.6) | 80 (18.9) | |||
| Sociodemographic variables | |||||||||
| Agea | 9.5 (4.7) | 9.5 (4.5) | 9.5 (4.9) | 0.9 | 2.6 (1) | 7 (1.5) | 11.9 (1.4) | 16 (0.8) | < .01 |
| Clinical-health care variables | |||||||||
| Level of complexitya | 3.6 (2.6) | 3.6 (2.8) | 3.4 (2.3) | 0.9 | 6 (3.5) | 3.6 (2.3) | 2.9 (1.6) | 2.2 (1.3) | < .01 |
| Risk level | |||||||||
| Low | 408 (96.5) | 219 (95.6) | 189 (97.4%) | 66 (86.8) | 125 (96.9) | 137 (99.3) | 80 (100) | ||
| Intermediate | 14 (3.3) | 9 (3.9) | 5 (2.6) | 0.4 | 9 (11.8) | 4 (3.1) | 1 (0.7) | 0 (0) | < .01 |
| High | 1 (0.2) | 1 (0.4) | 0 (0) | 1 (1.3) | 0 (0) | 0 (0) | 0 (0) | ||
| Number of chronic diseasesa | 1.1 (0.4) | 1.1 (0.4) | 1.1 (0.3) | 0.6 | 1 (0.3) | 1.1 (0.4) | 1.1 (0.3) | 1.2 (0.5) | .05 |
| 1 chronic disease | 375 (88.7) | 203 (88.6) | 175 (90.2) | 0.6 | 73 (96.1) | 114 (88.4) | 125 (90.6) | 66 (82.5) | .06 |
| 2 chronic diseases | 43 (10.2) | 23 (10) | 17 (8.8) | 0.6 | 2 (2.6) | 13 (10.1) | 13 (9.4) | 12 (15) | .07 |
| 3 chronic diseases | 5 (1.2) | 3 (1.3) | 2 (1) | 0.8 | 1 (1.3) | 2 (1.6) | 0 (0) | 2 (2.5) | .4 |
| Multimorbidity | 48 (11.3) | 26 (11.4%) | 19 (9.8) | 0.6 | 3 (3.9) | 15 (11.6) | 13 (9.4) | 14 (17.5) | .06 |
| Number of drugsa | 0.2 (0.6) | 0.2 (0.6) | 0.2 (0.6) | 0.9 | 0.3 (0.6) | 0.2 (0.6) | 0.2 (0.5) | 0.2 (0.6) | .6 |
| 1 drug | 56 (13.2) | 34 (14.8) | 22 (11.3) | 0.3 | 14 (18.4) | 19 (14.7) | 15 (10.9) | 8 (10) | .3 |
| 2 drugs | 13 (3.1) | 4 (1.7) | 9 (4.6) | 0.09 | 2 (2.6) | 3 (2.3) | 6 (4.3) | 2 (2.5) | .8 |
| 3 drugs | 4 (0.9) | 3 (1.3) | 1(0.5) | 0.6 | 1 (1.3) | 1 (0.8) | 0 (0) | 2 (2.5) | .3 |
| Polypharmacy (≥ 5) | 0 (0) | 0 (0) | 0 (0) | – | 0 (0) | 0 (0) | 0 (0) | 0 (0) | – |
| Drug type | |||||||||
| ATC B | 2 (0.5) | 2 (0.9) | 0 (0) | 0.2 | 0 (0) | 1 (0.8) | 1 (0.7) | 0 (0) | .7 |
| ATC C | 1 (0.2) | 1 (0.4) | 0 (0) | 0.4 | 0 (0) | 1 (0.8) | 0 (0) | 0 (0) | .5 |
| ATC H | 3 (0.7) | 2 (0.9) | 1 (0.5) | 0.7 | 0 (0) | 1 (0.8) | 0 (0) | 2 (2.5) | .2 |
| ATC L | 1 (0.2) | 0 (0) | 1 (0.5) | 0.3 | 0 (0) | 0 (0) | 1 (0.7) | 0 (0) | .2 |
| ATC M | 3 (0.7) | 3 (1.3) | 0 (0) | 0.1 | 1 (1.3) | 1 (0.8) | 1 (0.7) | 0 (0) | .8 |
| ATC N | 22 (5.2) | 14 (6.1) | 8 (4.1) | 0.4 | 2 (2.6) | 7 (5.4) | 6 (4.3) | 7 (8.8) | .3 |
| ATC R | 45 (10.6) | 22 (9.6) | 23 (11.9) | 0.5 | 14 (18.4) | 13 (10.1) | 15 (10.9) | 3 (3.8) | .03 |
ATC, Anatomical, Therapeutic, Chemical Classification System; ATC B, blood and blood forming organs; ATC C, cardiovascular system; ATC H, hormonal preparations; ATC L, antineoplastic and immunomodulating agents; ATC M, musculoskeletal system; ATC N, nervous system; ATC R, respiratory system.
The most prevalent chronic diseases in our sample were asthma (38.8%), ADHD (1.8%), anaemia (1.7%), obesity (1.4%), thyroid disease (1%), anxiety (0.9%), hyperlipidaemia (0.9%), epilepsy (0.7%) and depression (0.3%). We did not find significant differences based on sex except in thyroid disease, which was more frequent in female patients (P = .02). We found statistically significant differences between age groups in the prevalence of obesity, ADHD, anxiety, depression and neoplasia (Table 2).
Distribution of the most prevalent chronic diseases in the population aged less than 18 years and in the population of patients with chronic diseases aged less than 18 years by sex and age group.
| Chronic disease | Total patients < 18 years total | Chronic patients < 18 years | Male | Female | p | 0−4 years | 5−9 years | 10−14 years | 15−17 years | p |
|---|---|---|---|---|---|---|---|---|---|---|
| n (%) | N = 2,691 | N = 423 (15.7) | 229 (54.1) | 194 (45.9) | 76 (18) | 129 (30.5) | 138 (32.6) | 80 (18.9) | ||
| Asthma | 164 (6.1) | 164 (38.8) | 91 (39.7%) | 73 (37.6) | 0.6 | 31 (40.8%) | 59 (45.7) | 48 (34.8) | 26 (32.5) | .2 |
| ADHD | 48 (1.8) | 48 (11.3) | 30 (13.1) | 18 (9.3) | 0.2 | 0 (0) | 11 (8.5) | 26 (18.8) | 11 (13.8) | < .01 |
| Anaemia | 45 (1.7) | 45 (10.6) | 27 (11.8) | 18 (9.3) | 0.4 | 8 (10.5) | 13 (10.1) | 19 (13.8) | 5 (6.2) | .4 |
| Obesity | 37 (1.4) | 37 (8.7) | 22 (9.6) | 15 (7.7) | 0.5 | 0 (0) | 13 (10.1) | 16 (11.6) | 8 (10) | .03 |
| Thyroid disease | 27 (1.0) | 27 (6.4) | 9 (3.9) | 18 (9.3) | 0.02 | 4 (5.3) | 7 (5.4) | 10 (7.2) | 6 (7.5) | .9 |
| Anxiety | 23 (0.9) | 23 (5.4) | 13 (5.7) | 10 (5.2) | 0.8 | 0 (0) | 4 (3.1) | 5 (3.6) | 14 (17.5) | < .01 |
| Hyperlipidaemia | 23 (0.9) | 23 (5.4) | 14 (6.1) | 9 (4.6) | 0.5 | 0 (0) | 6 (4.7) | 12 (8.7) | 5 (21.7) | .06 |
| Epilepsy | 20 (0.7) | 20 (4.7) | 12 (5.2) | 8 (4.1) | 0.6 | 5 (6.6) | 6 (4.7) | 3 (2.2) | 6 (7.5) | .3 |
| Arthritis | 14 (0.5) | 14 (3.3) | 6 (2.6) | 8 (4.1) | 0.4 | 4 (5.3) | 5 (3.9) | 5 (3.6) | 0 (0) | .3 |
| Depression | 8 (0.3) | 8 (1.9) | 5 (2.2) | 3 (1.5) | 0.6 | 0 (0) | 1 (0.8) | 1 (0.7) | 6 (7.5) | < .01 |
| Stroke | 4 (0.2) | 4 (0.9) | 1 (0.4) | 3 (1.5) | 0.2 | 2 (2.6) | 1 (0.8) | 0 (0) | 1 (1.3) | .3 |
| HTN | 3 (0.1) | 3 (0.7) | 3 (1.3) | 0 (0) | 0.1 | 0 (0) | 3 (2.3) | 0 (0) | 0 (0) | .08 |
| Valve disease | 3 (0.1) | 3 (0.7) | 3 (1.3) | 0 (0) | 0.1 | 1 (1.3) | 1 (0.8) | 0 (0) | 1 (1.2) | .6 |
| Neoplasia | 2 (0.07) | 2 (0.5) | 1 (0.4) | 1 (0.5) | 0.9 | 2 (2.6) | 0 (0) | 0 (0) | 0 (0) | .03 |
| Liver disease | 2 (0.07) | 2 (0.5) | 1 (0.4) | 1 (0.5) | 0.9 | 1 (1.3) | 1 (0.8) | 0 (0) | 0 (0) | .5 |
| Autism | 2 (0.07) | 2 (0.5) | 2 (0.9) | 0 (0) | 0.2 | 0 (0) | 1 (0.8) | 1 (0.7) | 0 (0) | .7 |
| Abnormal heart rhythms | 2 (0.07) | 2 (0.5) | 1 (0.4) | 1 (0.5) | 0.9 | 0 (0) | 1 (0.8) | 1 (0.7) | 0 (0) | .7 |
| Diabetes | 1 (0.03) | 1 (0.2) | 1 (0.4) | 0 (0) | 0.3 | 0 (0) | 0 (0) | 0 (0) | 1 (1.2) | .2 |
| Substance abuse | 1 (0.03) | 1 (0.2) | 1 (0.4) | 0 (0) | 0.3 | 0 (0) | 0 (0) | 0 (0) | 1 (1.2) | .2 |
| IBD | 1 (0.03) | 1 (0.2) | 0 (0) | 1 (0.5) | 0.3 | 0 (0) | 0 (0) | 0 (0) | 1 (1.2) | .2 |
| Psychotic disorder | 1 (0.03) | 1 (0.2) | 1 (0.4) | 0 (0) | 0.3 | 0 (0) | 1 (0.8) | 0 (0) | 0 (0) | .5 |
| Vasculitis | 1 (0.03) | 1 (0.2) | 0 (0) | 1 (0.5) | 0.3 | 0 (0) | 0 (0) | 0 (0) | 1 (1.2) | .2 |
| HIV | 1 (0.03) | 1 (0.2) | 0 (0) | 1 (0.5) | 0.3 | 0 (0) | 1 (0.8) | 0 (0) | 0 (0) | .5 |
We calculated the prevalence of each chronic disease over the total of paediatric users in our catchment area (N = 2691) and over the total of paediatric patients with chronic disease (n = 423).
ADHD, attention-deficit hyperactivity disorder; HIV, human immunodeficiency virus; HTN, hypertension; IBD, inflammatory bowel disease.
In these patients, the most frequent type of acute intercurrent comorbidity managed at the hospital level was infection, predominantly associated with a high and intermediate risk level (pneumonia, 9.9%; recurrent urinary tract infection, 2.1%; central nervous system infection, 1%). Pneumonia was more frequent in children aged less than 5 years (28.9%) compared to all other age groups (5-9, 9.3%; 10–14, 5.8%; 15−17, 0%) (Table 3).
Distribution of acute comorbidities managed at the hospital level in chronically ill patients aged less than 18 years during the 1-year followup.
| Acute comorbidity | Chronic patients < 18 years | Male | Female | P | 0−4 years | 5−9 years | 10−14 years | 15−17 years | P |
|---|---|---|---|---|---|---|---|---|---|
| N (%) | 423 (15.7) | 229 (54.1) | 194 (45.9) | 76 (18) | 129 (30.5) | 138 (32.6) | 80 (18.9) | ||
| Pneumonia | 42 (9.9) | 22 (9.6) | 20 (10.3) | 0.8 | 22 (28.9) | 12 (9.3) | 8 (5.8) | 0 (0) | < .01 |
| Recurrent urinary tract infection | 9 (2.1) | 3 (1.3) | 6 (3.1) | 0.2 | 4 (5.3) | 3 (2.3) | 2 (1.4) | 0 (0) | .1 |
| Central nervous system infection | 2 (0.5) | 2 (0.9) | 0 (0) | 0.2 | 1 (1.2) | 1 (0.8) | 0 (0) | 0 (0) | .5 |
| Paralysis | 2 (0.5) | 2 (0.9) | 0 (0) | 0.2 | 1 (1.2) | 0 (0) | 0 (0) | 1 (1.2) | .3 |
| Gastrointestinal haemorrhage | 1 (0.2) | 0 (0) | 1 (0.5) | 0.3 | 0 (0) | 0 (0) | 0 (0) | 1 (1.2) | .2 |
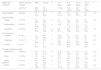
When it came to health care utilization, the mean number of total contacts with PC in the year after study was 8.3 (SD, 8.4). The most frequent type of contact was the clinical care contact, with a mean of 7.8 contacts (SD, 7.9), and the most frequent form of contact was in person, with 8.2 contacts (SD, 8.1). The mean number of visits to the PC paediatrician was 4.9 (SD, 6.3) and the mean number of nurse visits was 1.9 (SD, 2.9). The mean number of visits to the PC physician was 0.7 (SD, 1.9) (Table 4). The level of complexity and the number of contacts per year were greater in children aged less than 5 years and patients with multimorbidity compared to other age groups and patients without multimorbidity, respectively.
Primary care services utilization in a 1-year period in chronically ill patients aged less than 18 years by sex and age group.
| Health care utilizationa | Chronic patients < 18 years | Male | Female | P | 0−4 years | 5−9 years | 10−14 years | 15−17 years | P |
|---|---|---|---|---|---|---|---|---|---|
| 423 (15.7) | 229 (54.1) | 194 (45.9) | 76 (18) | 129 (30.5) | 138 (32.6) | 80 (18.9) | |||
| Total contactsa | 8.3 (8.4) | 7.6 (7.4) | 9.1 (9.3) | .1 | 13.2 (11.2) | 8.1 (7.2) | 6.6 (6.5) | 6.7 (8) | <.01 |
| Type of contact | |||||||||
| Clinical | 7.8 (7.9) | 7.3 (6.9) | 8.4 (8.9) | .2 | 13 (11.1) | 7.6 (6.4) | 6.3 (6.1) | 6.1 (7.6) | <.01 |
| Administrative | 0.2 (0.6) | 0.1 (0.8) | 0.2 (0.9) | .8 | 0 (0) | 0.3 (1.4) | 0.1 (0.6) | 0.1 (0.4) | .1 |
| Laboratory | 0.2 (0.6) | 0.1 (0.4) | 0.3 (0.8) | < .01 | 0.2 (0.7) | 0.2 (0.6) | 0.2 (0.4) | 0.4 (0.7) | <.01 |
| Form of contact | |||||||||
| In person | 8.2 (8.1) | 7.5 (7.3) | 8.9 (8.9) | .1 | 12.8 (10.2) | 8.1 (7.1) | 6.6 (6.5) | 6.7 (8) | <.01 |
| Telephone | 0.1 (0.7) | 0.1 (0.4) | 0.2 (1) | .7 | 0.4 (1.6) | 0.1 (0.4) | 0.1 (0.2) | 0.1 (0.2) | <.01 |
| At home | 0 (0.1) | 0 (0.1) | 0 (0.1) | .9 | 0 (0) | 0.01 (0.1) | 0 (0) | 0.01 (0.1) | .5 |
| Provider involved in contact | |||||||||
| Paediatrician | 4.9 (6.3) | 4.5 (5.1) | 5.3 (7.4) | .9 | 10.3 (8.9) | 5.2 (4.4) | 3.5 (3.4) | 1.5 (6.5) | <.01 |
| Nurse | 1.9 (2.9) | 1.9 (3) | 2 (2.8) | .2 | 2.5 (2.7) | 1.8 (3.1) | 2.1 (3.3) | 1.3 (1.9) | <.01 |
| Family physician | 0.7 (1.9) | 0.5 (1.5) | 0.9 (2.3) | .2 | 0.1 (0.3) | 0.1 (0.4) | 0.2 (0.8) | 3 (3.4) | <.01 |
| Dentist | 0.3 (0.8) | 0.4 (0.9) | 0.3 (0.7) | .1 | 0. 1(0.3) | 0.5 (1) | 0.4 (0.9) | 0.2 (0.5) | <.01 |
The only patient categorised as high risk was a boy aged 2 years with cancer, corresponding to the highest level of complexity, who had visited the paediatrician once. The mean age of patients with low risk was 9.7 years (SD, 4.6), compared to 3.8 (SD, 2.7) in patients with intermediate risk (P < .01). The mean number of chronic diseases in low-risk patients was 1.1 (SD, 0.3) compared to 1.6 in intermediate-risk patients (SD, 0.8) (P < .01), and 9.8% of low-risk patients had multimorbidity compared to 35% of intermediate-risk patients. Attention-deficit hyperactivity disorder (11.3%) and obesity (9.1%) only occurred in low-risk patients. Asthma and epilepsy were more common in intermediate-risk patients (71.4% and 21.4% respectively) compared to low-risk patients (37.7% and 4.2%) (P < .05). The mean total number of PC contacts was 7,8 (SD, 7.3) in the low risk group compared to 24.1 (SD = 17.9) in the intermediate risk group (P < .01). Health care contacts, in person visits and visits to the paediatrician were more frequent in patients with intermediate risk compared to those with low risk (23.4 [18.2], 22.9 [15.3] and 18.4 [13.7] vs 7.5 [6.9], 7.8[6.2] and 4.4 [5.4]; P < .01) (Table 5).
Sociodemographic characteristics, clinical-health care variables and utilization of primary care services in a 1-year period in chronically ill patients aged less than 18 years, overall and by risk level.
| Characteristics | Chronic patients < 18 years | Low risk | Intermediate risk | High risk | P |
|---|---|---|---|---|---|
| n (%) | 423 (15.7) | 408 (96.5) | 14 (3.3) | 1 (0.2) | |
| Sociodemographic variables | |||||
| Female sex | 194 (45.9) | 189 (46.3) | 5 (37.5) | 0 (0) | .5 |
| Mean age | 9.5 (4.7) | 9.7 (4.6) | 3.8 (2.7) | 2 (-) | <.01 |
| Age 0−4 | 76 (18) | 66 (16.2) | 9 (64.3) | 1 (100) | <.01 |
| Age 5−9 | 129 (30.5) | 125 (30.6) | 4 (3.1) | 0 (0) | |
| Age 10−14 | 138 (32.6) | 137 (33.6) | 1 (7.1) | 0 (0) | |
| Age 15−17 | 80 (18.9) | 80 (19.6) | 0 (0) | 0 (0) | |
| Clinical-health care variables | |||||
| Level of complexitya | 3.6 (2.6) | 3.2(1.9) | 11.9 (2.7) | 23.6 (-) | <.01 |
| Number of chronic diseasesa | 1.1 (0.4) | 1.1 (0.3) | 1.6 (0.8) | 1 (-) | <.01 |
| Had 1 chronic disease | 375 (88.7) | 368 (90.2) | 9 (64.3) | 1 (100) | <.01 |
| Asthma | 164 (38.8) | 154 (37.7) | 10 (71.4) | 0 (0) | .03 |
| ADHD | 48 (11.3) | 48 (11.8) | 0 (0) | 0 (0) | .4 |
| Obesity | 37 (8.7) | 37 (9.1) | 0 (0) | 0 (0) | .5 |
| Epilepsy | 20 (4.7) | 17 (4.2) | 3 (21.4) | 0 (0) | .01 |
| Neoplasia | 2 (0.5) | 0 (0) | 1 (7.1) | 1 (100) | <.01 |
| Multimorbidity | 45 (10.6) | 40 (9.8) | 5 (35.7) | 0 (0) | <.01 |
| Acute comorbidities | |||||
| Pneumonia | 42 (1.5) | 40 (9.8) | 2 (14.3) | 0(0) | .8 |
| Recurrent urinary tract infection | 9 (0.3) | 8 (2) | 1 (7.1) | 0 (0) | .4 |
| Number of drugsa | 0.2 (0.6) | 0.2 (0.6) | 0 (0) | 0 (0) | .2 |
| Total contactsa | 8.3 (8.4) | 7.8 (7.3) | 24.1 (18) | 1 (-) | <.01 |
| Type of contact | |||||
| Clinical | 7.8 (7.9) | 7.5 (6.9) | 23.4 (18.2) | 1 (-) | <.01 |
| Administrative | 0.2 (0.6) | 0.1 (0.8) | 0.6 (2.4) | 0 (-) | .2 |
| Laboratory | 0.2 (0.6) | 0.2 (0.6) | 0.1 (0.5) | 0 (-) | .8 |
| Form of contact | |||||
| In person | 8.2 (8.1) | 7.8 (7.2) | 22.9 (15.3) | 1 (-) | <.01 |
| Telephone | 0.1 (0.7) | 0.1 (0.4) | 1.2 (3.4) | 0 (-) | <.01 |
| Home | 0 (0.1) | 0 (0.1) | 0 (0.0) | 0 (-) | .9 |
| Provider involved in contact | |||||
| Paediatrician | 4.9 (6.3) | 4.4 (5.4) | 18.4 (13.7) | 1 (-) | <.01 |
| Nurse | 1.9 (2.9) | 1.8 (2.7) | 4.6 (6.1) | 0 (-) | <.01 |
| Family physician | 0.7 (1.9) | 0.7 (1.9) | 0.1 (0.3) | 0 (-) | .5 |
| Dentist | 0.3 (0.8) | 0.3 (0.8) | 0.2 (0.8) | 0 (-) | .8 |
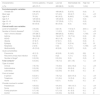
The variables that explained the level of complexity in the multivariate analysis were: age < 5 years (B coefficient [B], 2.6; 95% CI, 2.1–3.1), the number of chronic diseases (B, 1.6; 95% CI, 1.1–2.1) and the total number of PC contacts in the year under study (B, 0.1; 95% CI, 0.06−0.11). The model explained 34% of the variability in the complexity level of paediatric patients with chronic disease (Table 6).
Factors associated to the level of complexity based on the AMG in patients with chronic diseases aged less than 18 years.
| Variables | B coefficient | 95% CI | ||
|---|---|---|---|---|
| Lower bound | Upper bound | P | ||
| Age < 5 years | 2.6 | 2.1 | 3.1 | .000 |
| Number of chronic diseases | 1.6 | 1.1 | 2.1 | .000 |
| Number of PC contacts/year | 0.1 | 0.06 | 0.11 | .000 |
Linear regression analysis. R2 = 0.345.
AMG, adjusted morbidity group; PC, primary care.
We found that 15.7% of the catchment population of the basic health district aged less than 18 years had at least 1 chronic disease, which was consistent with the data in the previous literature.3,4,6,8
More than half of patients with chronic disease were male (54.1%), similar to the proportions found in other studies that describe a slightly higher percentage of boys with chronic diseases compared to girls.5,8,34 We did not find differences in sociodemographic or clinical-health care characteristics based on sex.
When it came to chronic diseases, we found some differences when we compared the prevalence found in our sample with the prevalence found in other studies. The prevalence of asthma of 6.1% was slightly lower compared to the prevalence found in the International Study of Asthma and Allergies in Childhood, of 7%–15%.11 These differences were greater for diseases like obesity, of which we found a prevalence of 1.4% in our patients that was far lower compared to the Aladino study (2015), which found a prevalence of 15.8% in girls and 20.4% in boys, 13 or the report of the Department of Epidemiology of the Community of Madrid, which found a prevalence of obesity in school children aged 6–18 years of 7.4%.14 We observed the same trend in the prevalence of mental health and neurodevelopmental disorders such as anxiety (0.9%), depression (0.3%), autism (0.1%) and psychotic disorder (0.03%), which was much lower compared to the prevalence of psychiatric disorders of 3%–22% found in a review of children and adolescent health in several countries, including Spain.19
On the other hand, we had a prevalence of ADHD and hyperactivity of 1.8%, higher compared to other studies in Spain that have reported a prevalence of 1%, although it was also lower compared to others that report values of up to 14%.35 The meta-analysis of 14 studies published by Catalá-López et al. estimated the prevalence of ADHD in the child and adolescent population in Spain at 6.8%.35
On the other hand, we found a higher prevalence of other diseases, such as anaemia (1.7%) or thyroid disorders (1%) compared to other studies in the reviewed literature, which were not featured in the lists of most frequent chronic diseases in the paediatric age group.
Several aspects could explain the differences in prevalence observed in relation to other studies. One is that the catchment area corresponds to a neighbourhood with a middle-to-high socioeconomic level (MEDEA deprivation index in the first quartile),32 which makes it possible for some of the patients to have additional forms of health insurance, which would entail a decreased utilization of public health services; there could also be gaps or errors in documentation in the PC-Madrid electronic health record database. Among these, errors in the coding of chronic diseases and under-recording of some diseases that are only frequent in children or that are mild or self-limiting in adult patients, which would result in prevalence estimates below the actual prevalence, or recording of acute diseases using codes for chronic diseases, which would result in overestimation of the prevalence of other diseases. On the other hand, we were not able to compare acute comorbidity in relation to patients that did not fulfil the criteria for chronic disease in our primary care centre because we did not have access to those data.
Nevertheless, one of the strengths of our study is that we analysed real world data, and we had access to a considerable volume of information on the population under everyday clinical practice conditions, overcoming the limitations of studies based on surveys or small samples.
Previous studies have concluded that individual characteristics (age, sex, certain diseases and other family-related and social variables) are associated with the utilization of PC paediatrics services.36 Although this association between morbidity and utilization in outpatient paediatric services has been described in numerous studies, their results are difficult to compare because they did not apply a standardised approach to the classification of chronic diseases in the paediatric age group. In our study, the mean number of PC contacts (8 contacts/year, with a greater frequency in children aged < 10 years) was similar to the number found by another study on PC utilization in the chronically ill paediatric population that used the ACG system36 and greater compared to the mean number of contacts per year of the total paediatric population in 2016, both in the catchment area of the Ciudad Jardín Primary Care Centre (3.9 contacts/year) and in the entire Community of Madrid (4.6 contacts/year) based on the PC balance scorecard (eSOAP).37
Low-risk patients made fewer visits to PC compared to intermediate-risk patients, as has been previously observed in the adult population.38 On the other hand, service utilization was lower in the high-risk patient compared to intermediate- and low-risk patients, but this could be due to this patient greater use of hospital-based services over primary care services, a phenomenon already described in the literature.39 However, the fact that only 1 patient was classified as high-risk limits the generalizability of the results. There is no question that the national health system model, which provides universal coverage free of charge has a highly accessible entry point in the primary care system, guarantees the care of paediatric patients with chronic disease, although the high number of contacts per year in low-risk patients could also be explained by a social and cultural context that medicalises mild disease processes, leading to demand of PC services.14,36
Nearly all chronically ill paediatric patients (96.5%) were classified as low risk based on the AMG with a mean of 1 chronic disease per patient, whereas multimorbidity and complexity were more common in intermediate-risk patients. These findings were similar to the data for the paediatric population published in the report on the stratification of the population by AMG of the National Health System of Spain29 and to the findings of Cohen et al., who analysed data for a total of 104,500 chronically ill children and adolescents and found that 95.2% had noncomplex diseases.34
In our population, of paediatric age, the AMG system classified 96.5% of patients as low-risk, 3.3% as intermediate-risk and 0.2% as high-risk, which differed from the distribution of the adult population served in the same facility (76.6% low-risk, 18.7% intermediate-risk and 4.7% high-risk) in which there were 3 discernible levels of risk associated with clear differences in age, disease characteristics, health care utilization and complexity.40 In contrast, when it comes to chronic paediatric patients it might be more useful to stratify into 2 risk groups, as has been observed in other studies30,39 that show that these complex chronically ill patients have diseases that require a greater use of specialised health care resources and may entail functional limitations causing increased vulnerability and more frequent use of health care services compared to non-complex chronic patients.30 This also emerged in our study, in which patients with intermediate and high risk differed from patients with low risk in age, complexity, number and type of diseases and health care utilization.
When it came to the use of AMG in the paediatric population, another aspect deserving of reflection is that we did not find some of the highly prevalent chronic diseases in the paediatric age group among the diseases found in our sample (coeliac disease, atopic dermatitis or eating disorders)2,3 or other, less frequent and more complex diseases (chromosome disorders, congenital heart defects or hypoxic-ischaemic encephalopathy), which the stratifying system does not consider chronic.
In conclusion, a considerable number of patients aged less than 18 years had chronic diseases. Asthma, ADHD and obesity were the most prevalent diseases identified by the stratification system. Health care utilization was high. The distribution by risk level differed compared to the distribution in adults, with a higher complexity in patients aged less than 5 years, with multimorbidity and that used PC services more frequently.
Further studies are required to analyse morbidity and use of paediatric health care services, as well as the usefulness of AMGs for risk stratification of this population, with the purpose of developing a model for intervention adapted to the reality of the paediatric population.
FundingDoctoral dissertation grant from the Fundación para la Investigación e Innovación Biomédica de Atención Primaria (Foundation for Biomedical Research and Innovation in Primary Care) of the Autonomous Community of Madrid (FIIBAP).
Conflicts of interestThe authors have no conflicts of interest to declare.
We thank José Carlos Estévez Muñoz (Technical Support Unit of the Gerencia asistencial de Atención Primaria de Madrid) for his collaboration in data extraction.
We also thank the Research Support Unit of the Gerencia asistencial de Atención Primaria de of Madrid for its methodological support.
The following is Supplementary data to this article:

Please cite this article as: Barrio Cortes J, Suárez Fernández C, Bandeira de Oliveira M, Muñoz Lagos C, Beca Martínez MT, Lozano Hernández C, et al. Enfermedades crónicas en población pediátrica: comorbilidades y uso de servicios en atención primaria. An Pediatr (Barc). 2020;93:183–193.
Previous presentation: This study was presented as a poster with oral presentation at the xxxix Congress of the Sociedad Española de Medicina de Familia (semFYC); May 9, 2019, Malaga, Spain.

Anales de Pediatría (English Edition) follows the Recommendations for the Conduct, Reporting, Editing and Publication of Scholarly Work in Medical Journals