


Based on the European and American Cystic Fibrosis (CF) consensus recommendations, an increase in vitamin D (VD) supplementation in patients with CF and insufficient or defficient levels was proposed. The objective of our study was to determine the safety and efficacy of this new protocol.
Material and methodsMulticentre nonrandomized uncontrolled experimental study. Patients with insufficient levels (<30 ng/mL) received increasing doses of VD (between 800 and 10 000 IU/day). Patients were followed up for 12 months, during which their vitamin and nutritional status, pulmonary function and calcium and phosphate metabolism were assessed. Statistical analysis: t test for paired data and multivariate logistic regression analysis.
ResultsThirty patients aged 1–39 years (median, 9.1) completed the follow-up. Two patients were dropped from the study on account of 25-OH VD levels greater than 100 ng/mL at 3 months without clinical or laboratory signs of hypercalcaemia. At 12 months, we observed an increase of 7.6 ng/mL (95% CI, 4.6−10 ng/mL) in the mean 25-OH VD level and an improvement in vitamin status: 37% achieved levels of 30 ng/mL or greater, 50% levels between 20 and 30 ng/mL and 13% remained with levels of less than 20 ng/mL. We found no association between improved VD levels and pulmonary function.
ConclusionsThe proposed protocol achieved an increase in serum VD levels and a decrease in the percentage of patients with VD insufficiency, although it was still far from reaching the percentages of sufficiency recommended for this entity.
Basándonos en los documentos de consenso europeo y americano de Fibrosis Quística (FQ) se propone un incremento de la suplementación de vitamina D (VD) en pacientes con FQ y niveles insuficientes. El objetivo de nuestro estudio fue conocer la seguridad y la eficacia de este nuevo protocolo.
Material y métodosEstudio multicéntrico, experimental no aleatorizado ni controlado. A los pacientes con niveles insuficientes (<30 ng/mL) se les administró dosis crecientes de VD (entre 800 y 10000 UI/día). Se realizó seguimiento durante 12 meses analizando estatus vitamínico, nutricional, función pulmonar y metabolismo fosfo-cálcico. Análisis estadístico: pruebas t para datos apareados y regresión logística con análisis multivariable.
Resultados30 pacientes entre 1 y 39 años (mediana 9,1) completaron el estudio. Se retiraron 2 por niveles de 25 OH VD > 100 ng/mL a los 3 meses sin encontrarse signos clínicos ni analíticos de hipercalcemia. Tras 12 meses se observó un incremento de 7,6 ng/mL (IC 95% 4,6−10 ng/mL) de los niveles medios de 25 OH VD. El 37% alcanzaron niveles ≥30 ng/mL, un 13% <20 ng/mL y un 50% entre 20 y 30 ng/mL. No se observó asociación de la mejoría de los niveles de VD con la función pulmonar.
ConclusionesCon el protocolo propuesto se consigue un incremento de los niveles séricos de VD y una disminución del porcentaje de pacientes con insuficiencia de la misma, aunque todavía muy lejos de alcanzar los porcentajes de suficiencia recomendados para esta entidad.
Vitamin D (VD) deficiency is frequent in patients with cystic fibrosis (CF). Between 40% and 90% of these patients have serum levels of 25-hydroxyvitamin D (25-OH-D) of less than 30 ng/mL, while approximately 15%–20% have levels under 15 ng/mL.1
Multiple factors explain this phenomenon: an insufficient dietary intake of vitamin D, decreased absorption due to exocrine pancreatic insufficiency, changes in hepatic hydroxylation, decreased levels of vitamin D-binding protein and reduced synthesis due to reduced exposure to sunlight.2,3
Different approaches have been proposed for treatment of vitamin D deficiency. For instance, there are schedules based on weekly doses: 12 000 IU/week for children aged less than 5 years or 50 000 IU/week for older children4; on the other hand, there is what is known as “stoss” therapy, which consists in administering a single high dose of up to 600 000 IU followed by the customary daily dose.5 However, there are no studies comparing the efficacy of these approaches. In recent years, both the Cystic Fibrosis Foundation of the United States6 and the European Society of Cystic Fibrosis7 have published consensus guidelines on the nutritional management of patients with CF that included a review of recommendations on VD supplementation. Both recommend increasing the VD dose in patients with patients with CF. The Cystic Fibrosis Foundation recommends treating vitamin D deficiency with trimestral increases of the daily dose to up to a maximum of 10 000 IU/day.
Few studies have established the effectiveness of these new guidelines. The aim of our study was to assess the safety and efficacy of this new protocol in patients with CF with VD levels in the insufficiency or deficiency range.
Material and methodsWe conducted a prospective multicentre study with the collaboration of 6 hospitals in Spain to assess the response of participants to the proposed intervention, without a control group. The study was approved by the Research Ethics Committee of the principal research hospital (file no 45/15) and all other participating centres.
The sample included patients with a diagnosis of CF, with no age restrictions, who accepted to participate and for which we obtained signed informed consent, who were clinically stable (absence of cough, fever, expectoration, haemoptysis or antibiotherapy in the past 2 weeks) and who had exocrine pancreatic insufficiency (stool elastase <200 µg/g) and levels of 25(OH)D of less than 30 ng/mL.
The exclusion criteria were evidence of abnormal liver function, such as elevation of aminotransferases of at least 3 times the upper limit of normal, elevation of the international normalised index (INR) greater than 1.5; a prothrombin time of less than 50% or signs of severe cholestasis (elevation of direct bilirubin above twice the upper limit of normal for age). We also excluded patients with renal failure (glomerular filtration rate <60 mL/min/1.73 m2 or a glomerular filtration rate z-score for age <1).
The study variables were age, sex, changes in the CFTR gene and administered dose of VD (IU/day).
We recorded the weight (kg), height (cm) and body mass index (BMI) and the corresponding z-scores (z = [value − mean]/standard deviation) using the growth standards of the World Health Organization as reference.
We assessed pulmonary function by means of spirometry: forced expiratory volume in 1 s (FEV1), vital capacity (VC) and forced expiratory flow between 25% and 75% of vital capacity (FEF25−75). We defined obstruction as a FEV1 of less than 80% the predicted FEV1 for the patient’s age, height and weight.8
The laboratory variables were the serum levels of cholesterol, triglycerides, calcium, alkaline phosphatase (AP), parathyroid hormone (PTH) and fat-soluble vitamins (25(OH)D, alpha-tocopherol and retinol). We defined VD deficiency as a serum level below 20 ng/mL and insufficiency as a serum level between 20 and 30 ng/mL.9
Lastly, we assessed exocrine pancreatic function by means of the stool elastase test and 24-h quantitative faecal fat test.
All laboratory variables were measured according to the established protocol of the hospital. Levels of 25(OH)D were measured with competitive chemiluminescence immunoassays, which use proteins that bind VD labelled with ruthenium, acridinium or biotin.
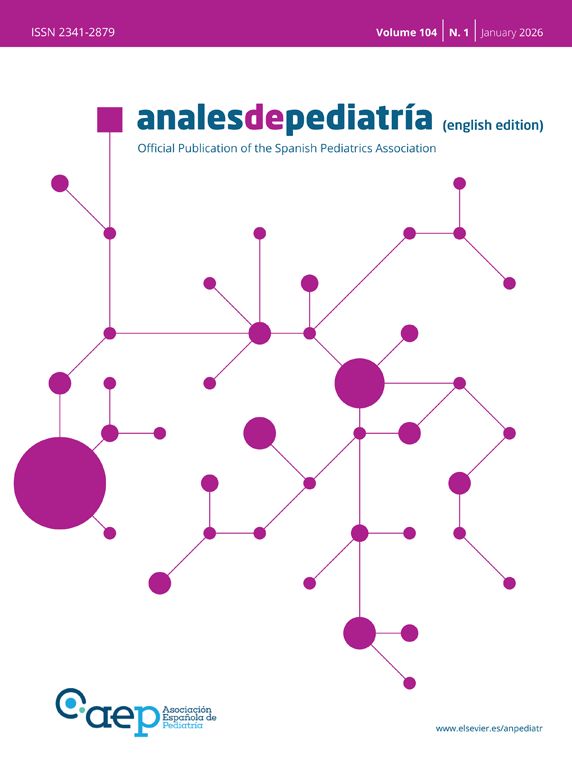
Study processBetween 2014 and 2016, patients were recruited and an initial visit took place for the purpose of selection (V0). Patients who met the inclusion criteria and none of the exclusion criteria received vitamin D3 supplementation according to the consensus guidelines of the Cystic Fibrosis Foundation, and follow-up visits for clinical and laboratory assessments were carried out at 3, 6 and 9 months (V1, V2, V3) during which the dose of VD was adjusted based on measured serum levels with the aim of maintaining 25(OH)D levels in the 30–100 ng/mL range (Fig. 1). At 1 year of follow-up (V4) all patients underwent the same tests performed in the selection visit. Patients with 25(OH)D levels greater than 100 ng/mL or with manifestations compatible with hypercalcemia (weight loss, abdominal pain, vomiting, constipation, polyuria, polydipsia, dehydration…).
Statistical analysis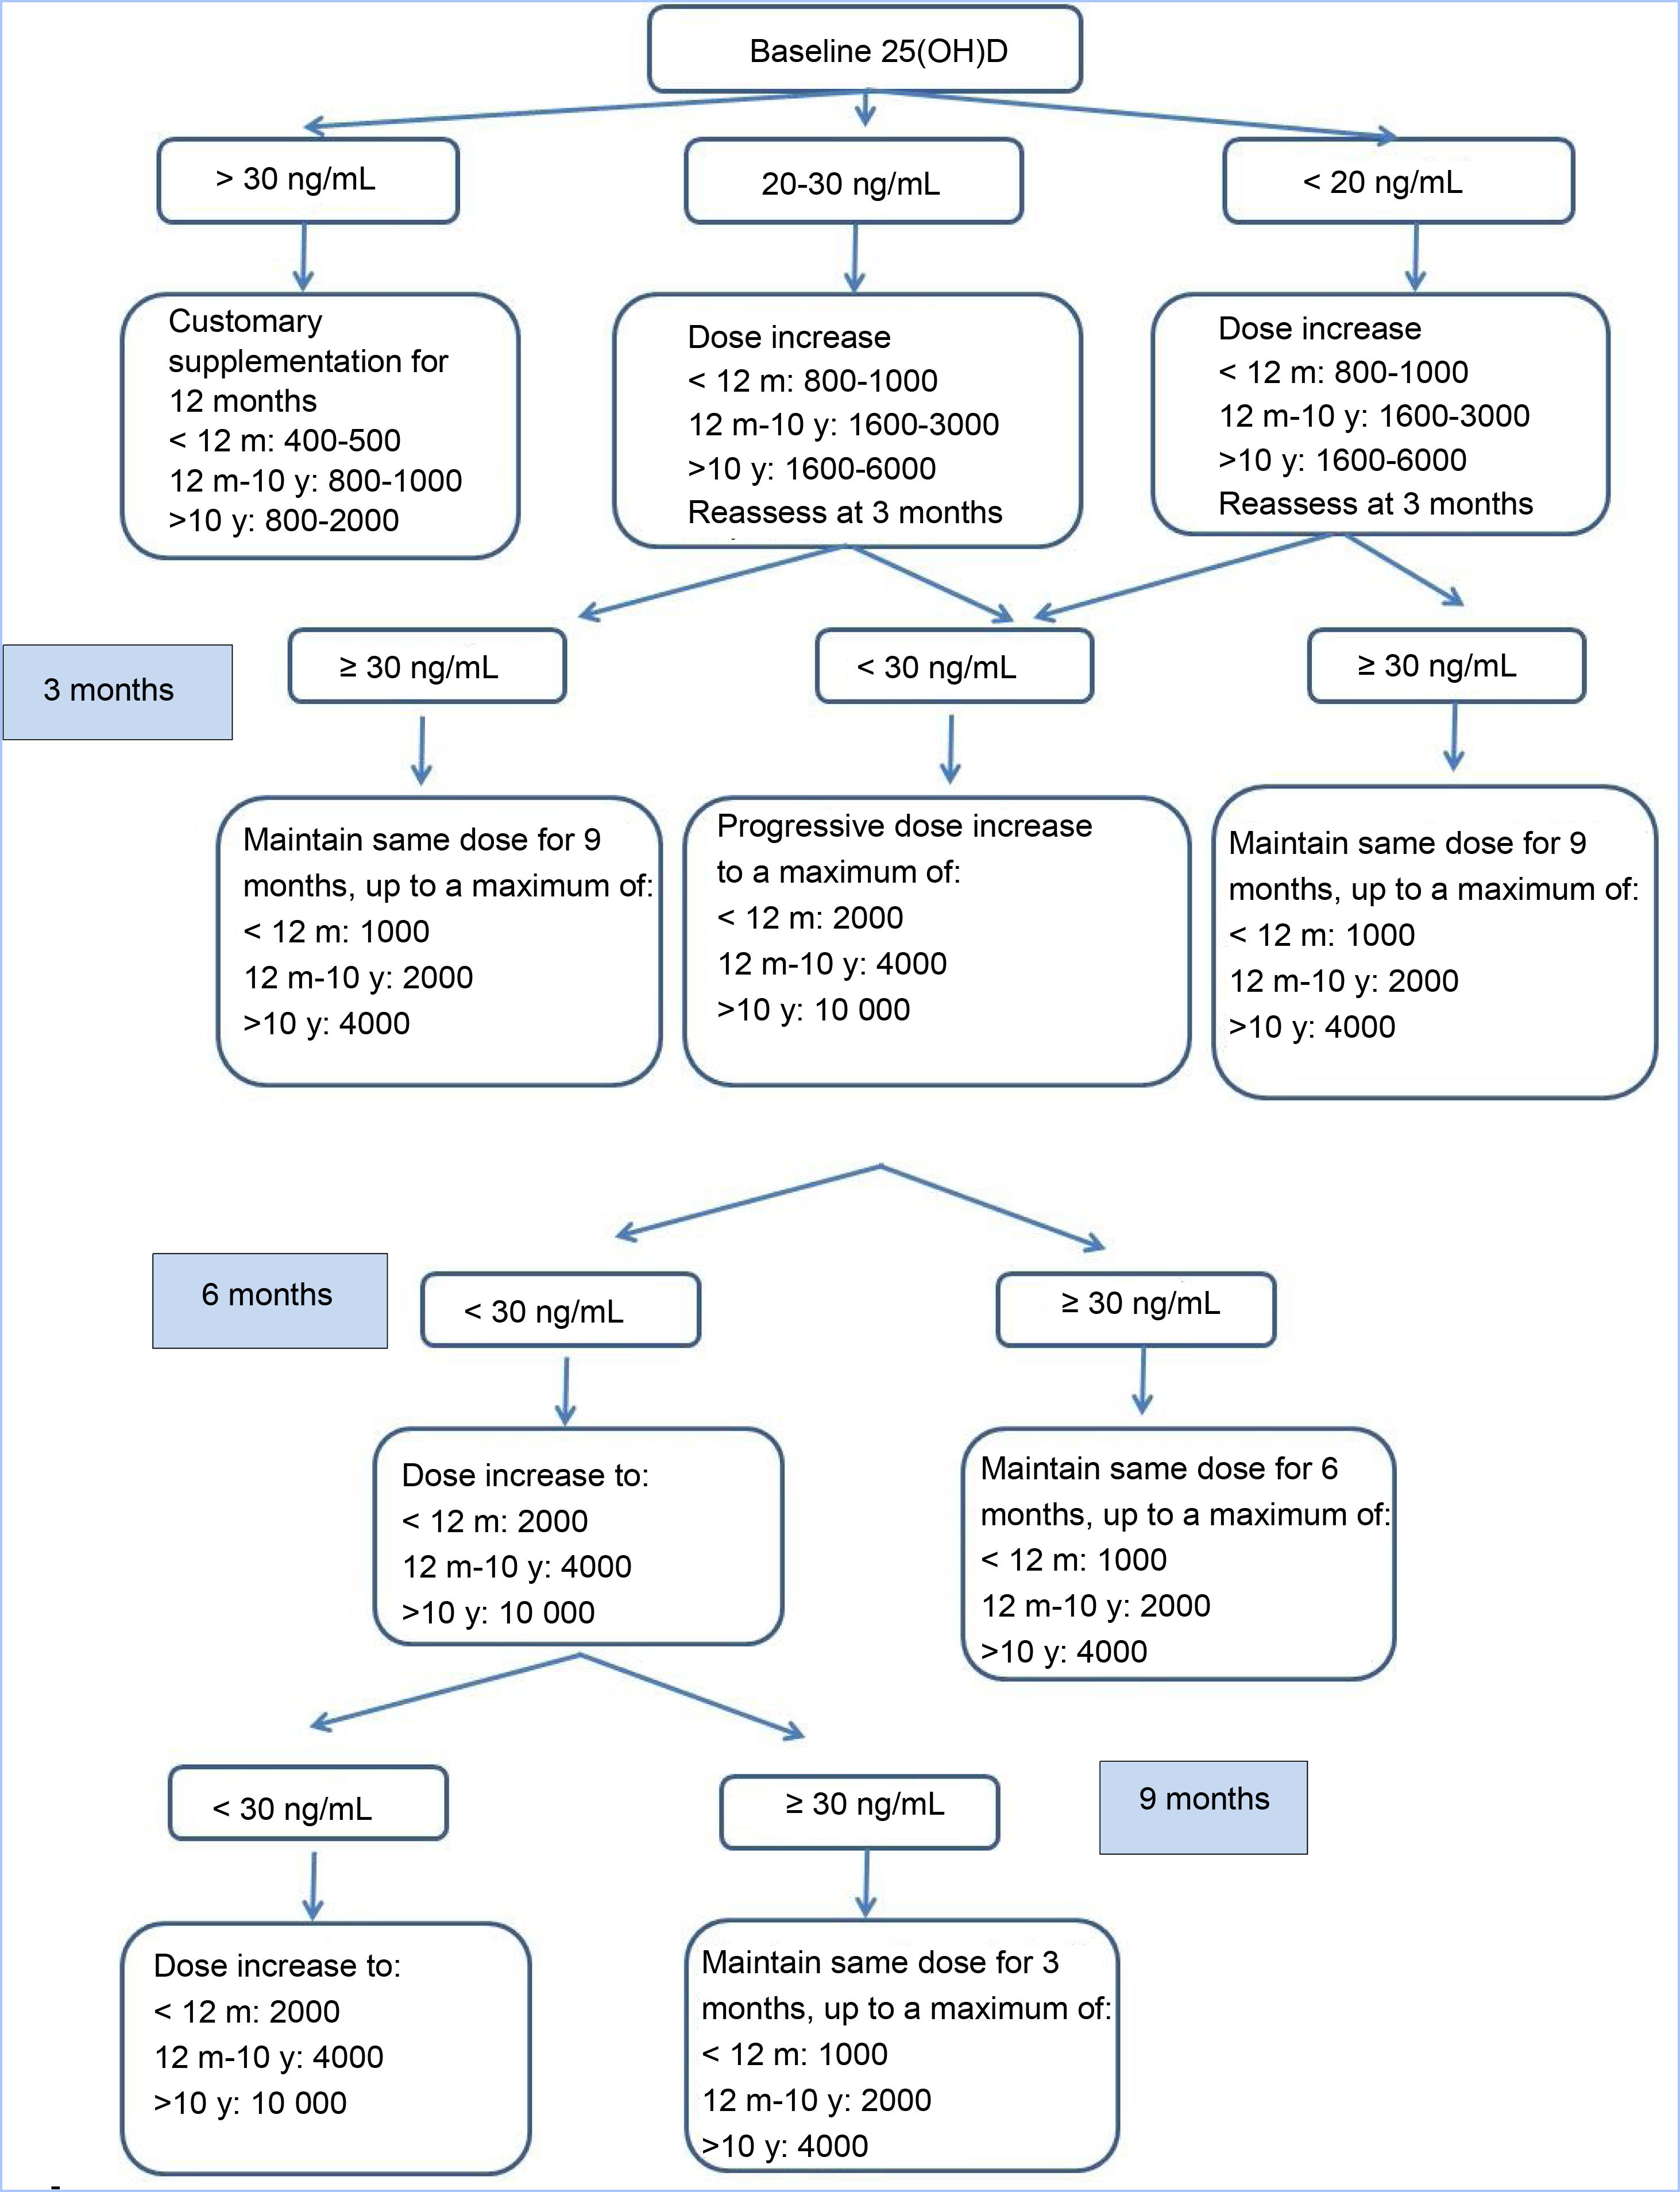
Data were cleansed by means of logic and range constraints for variables such as the weight or the height for age and the dates. We also generated the distributions for the most important variables (VD).
We assessed the normality of distributions by means of the Shapiro-Wilk test. We have expressed variables with a normal distribution as mean and standard deviation (SD) and those that did not as median and interquartile range (IQR).
The means obtained in different visits were compared with the t test for paired samples.
We use the Pearson (r) and the Spearman (ρ) correlation coefficients to assess the combined behaviour of quantitative variables.
Statistical significance was defined as a P value of less than 0.05.
The data base was built with the software Microsoft Access (Microsoft Corporation, Redmond, Washington, EE.UU.) and the statistical analysis performed with Stata, version 13.0 (StataCorp LLC, College Station, Texas, USA).
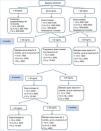
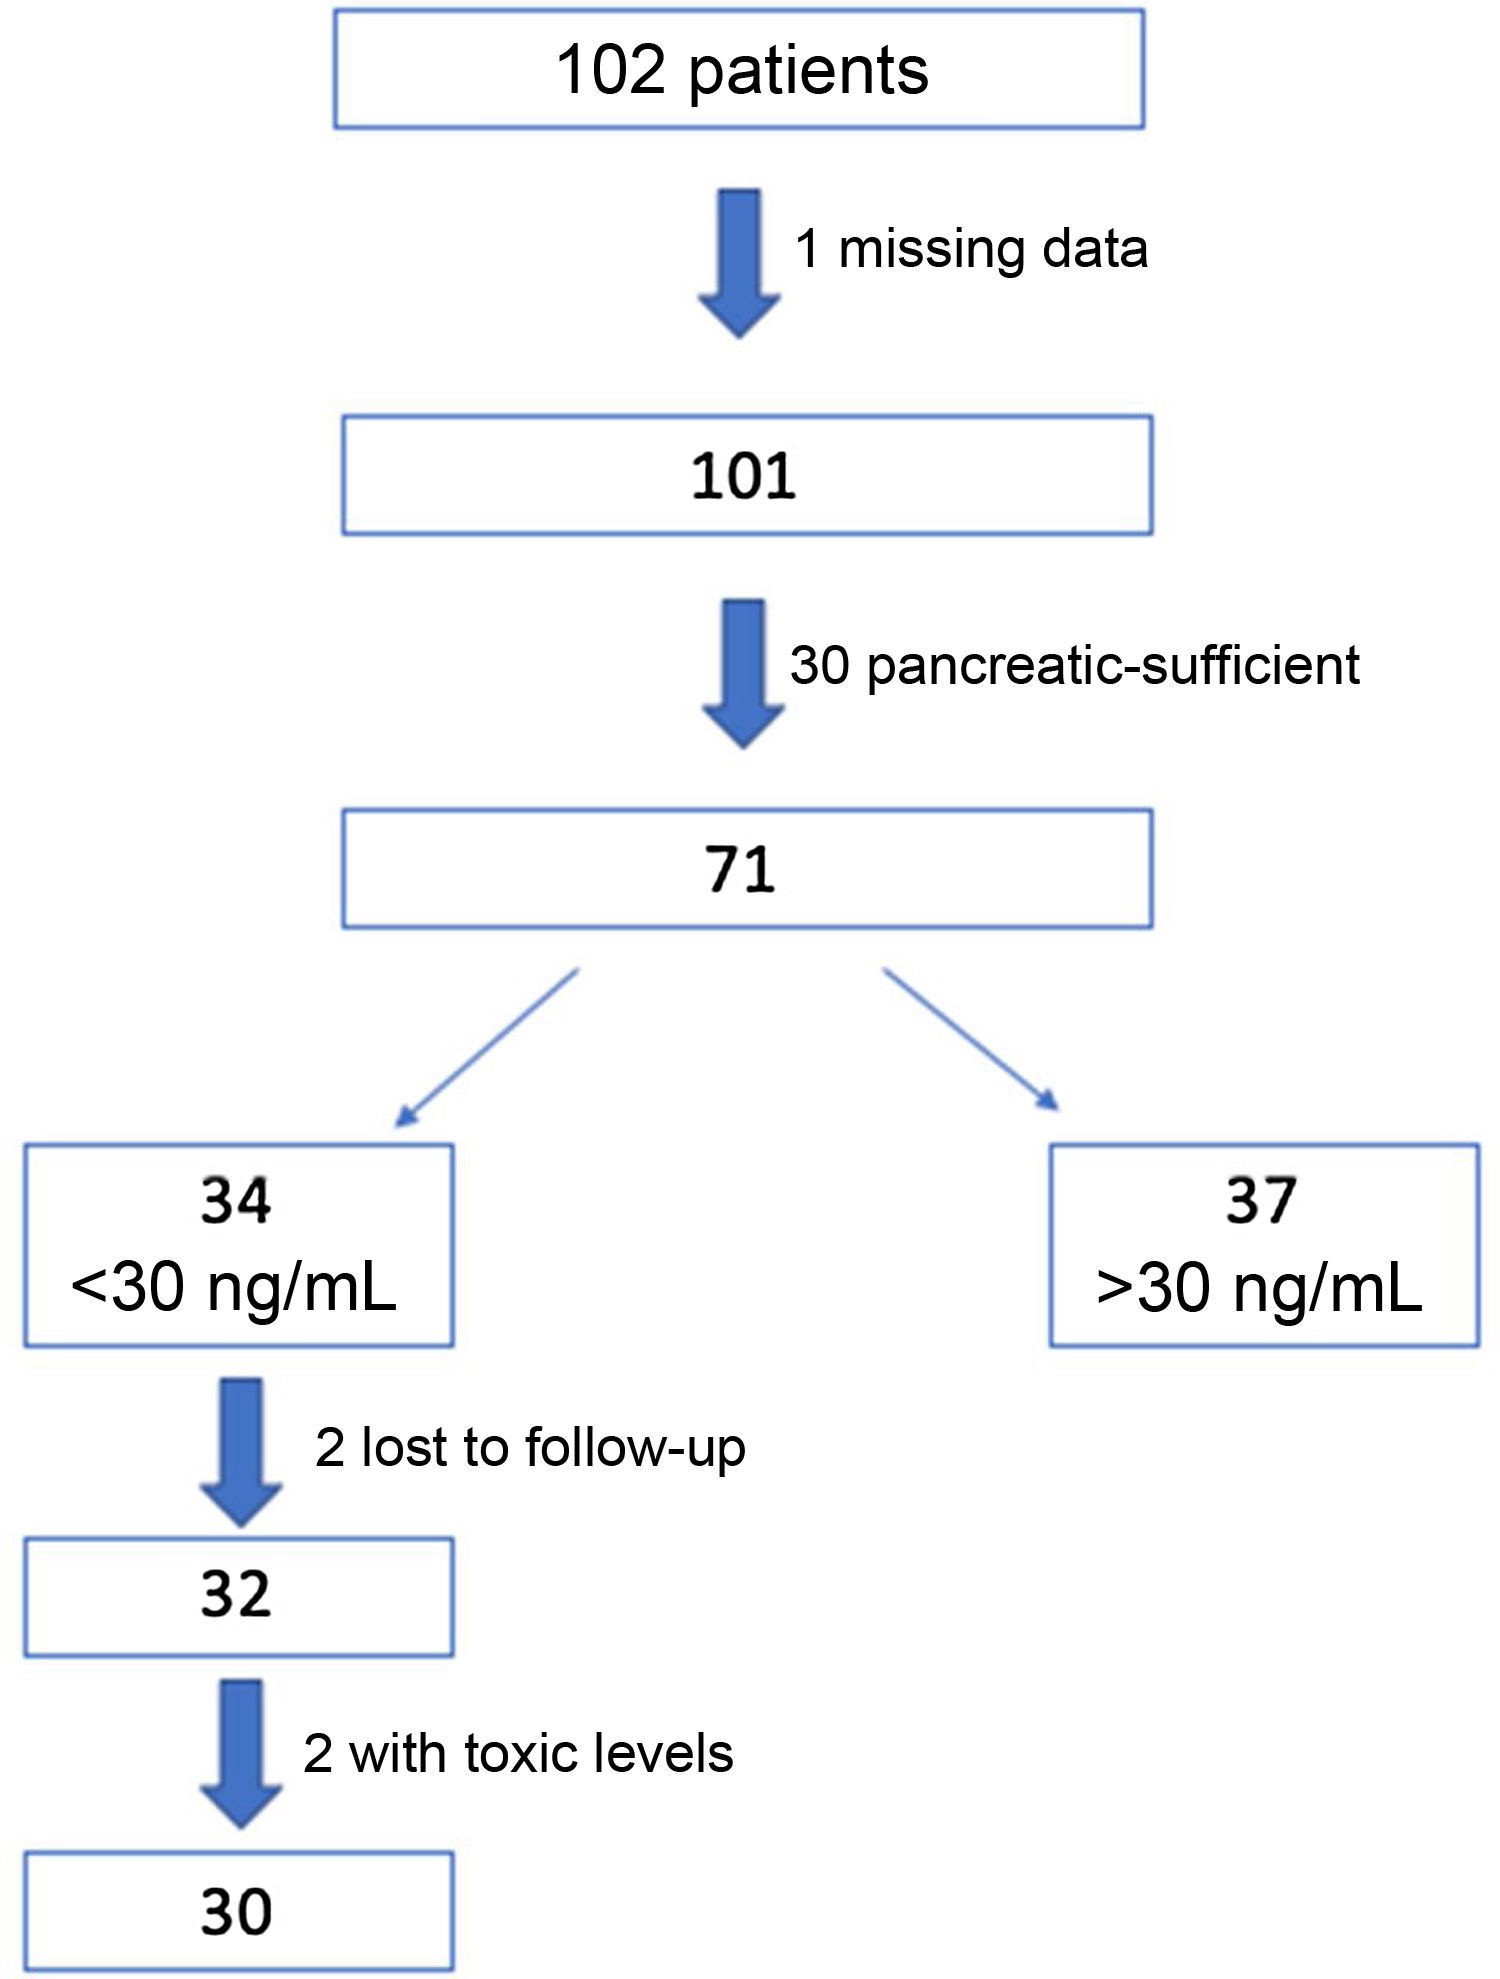
ResultsWe recruited 102 patients, of who 71 were eventually selected for the study: 1 of them was excluded due to missing data and 30 because they were pancreatic sufficient. Out of the total included patients, the intervention protocol was implemented in the 34 (48%) found to have insufficient levels of VD (<30 ng/mL) in the initial visit. Two patients were lost to follow-up and another 2 had levels of 25(OH) D greater than 100 ng/mL at 3 months, and were therefore withdrawn from the study. The final sample on which the analysis was conducted included the 30 remaining patients (Fig. 2).
Fifty percent of the patients were male, and the median age of the sample was 9.05 years (IQR, 3.76–15.62). Table 1 summarises the baseline characteristics of the sample.
Baseline characteristics of the sample.
| Variable | Value |
|---|---|
| Age (median 9.05 years (IQR: 3.76–15.62) | |
| <2 years | 13% |
| 2−10 years | 37% |
| >10 years | 50% |
| Screening diagnosis | 45% |
| Genetic | |
| Homozygous DF508 | 50% |
| Heterozygous DF508 | 43.3% |
| Another mutation | 6.7% |
| Malnutrition (BMI< 18.5 kg/m2/< p10) | 8% |
| BMI z-score, mean ± SD (min-max) | 0.03 ± 0.9 (−1.9 to 1.5) |
| Pulmonary obstruction (FEV1< 80%) | 62% |
| Colonization by Pseudomonas aeruginosa | 19% |
| Colonization by MRSA | 12% |
| FEV1 (%), mean ± SD (min-max) | 75.6 ± 19.0 (40.0–107.0) |
| FEF25−75 (%), mean ± SD (min-max) | 57.6 ± 28.5 (20.0–116.0) |
| VC (%), mean ± SD (min-max) | 80.1 ± 21.2 (33.0–111.0) |
BMI, body mass index; FEF25−75, forced expiratory flow at 25%–75% of vital capacity; FEV1, forced expiratory volume in 1 s; SD, standard deviation; MRSA, methicillin-resistant Staphylococcus aureus; VC, vital capacity.
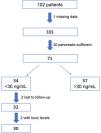
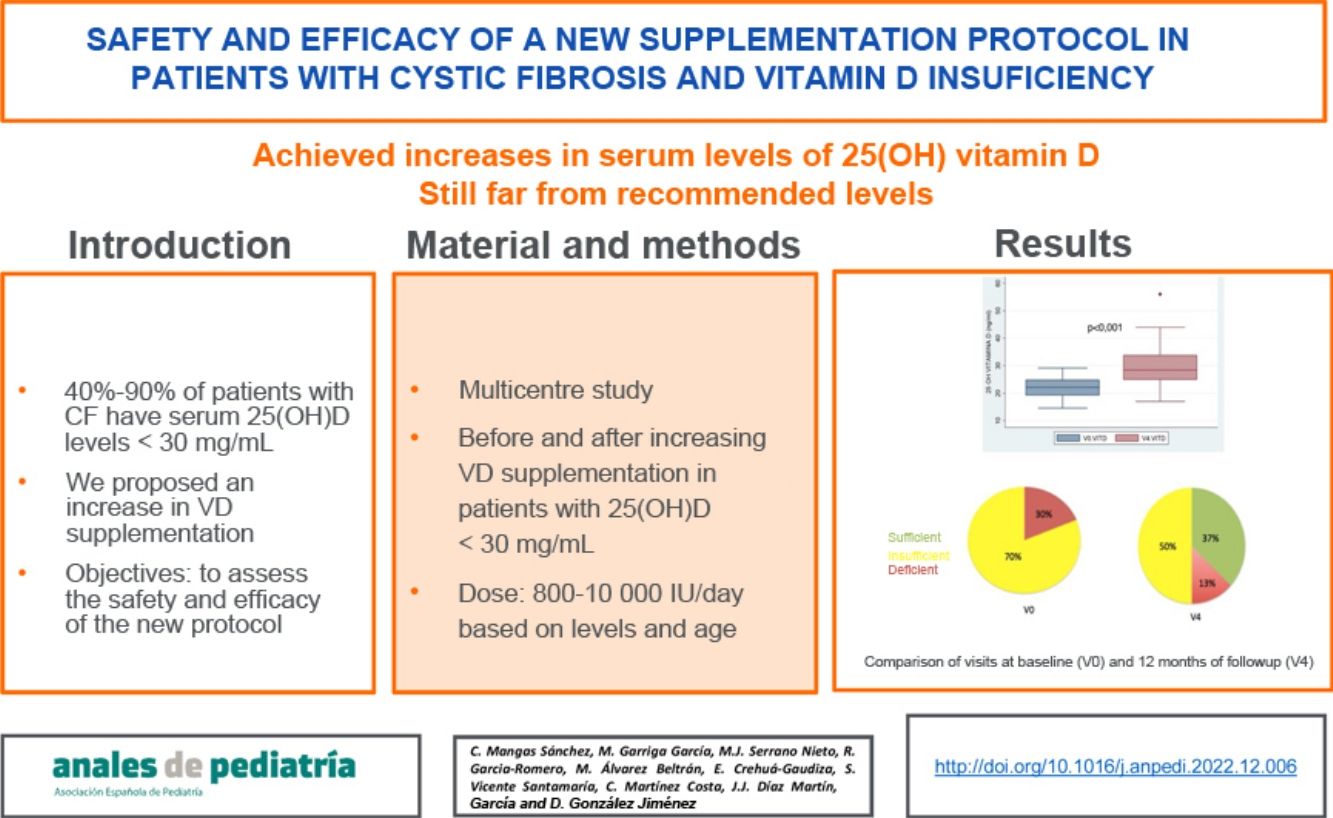
When we compared the mean VD dose patients were receiving at the time of the initial visit (V0) with the mean dose at the last visit, after 12 months of follow-up (V4), we found a significant increase in the dose: 1837 IU/day in V0 versus 3165 IU in V4 (P < .001) (Fig. 3a).
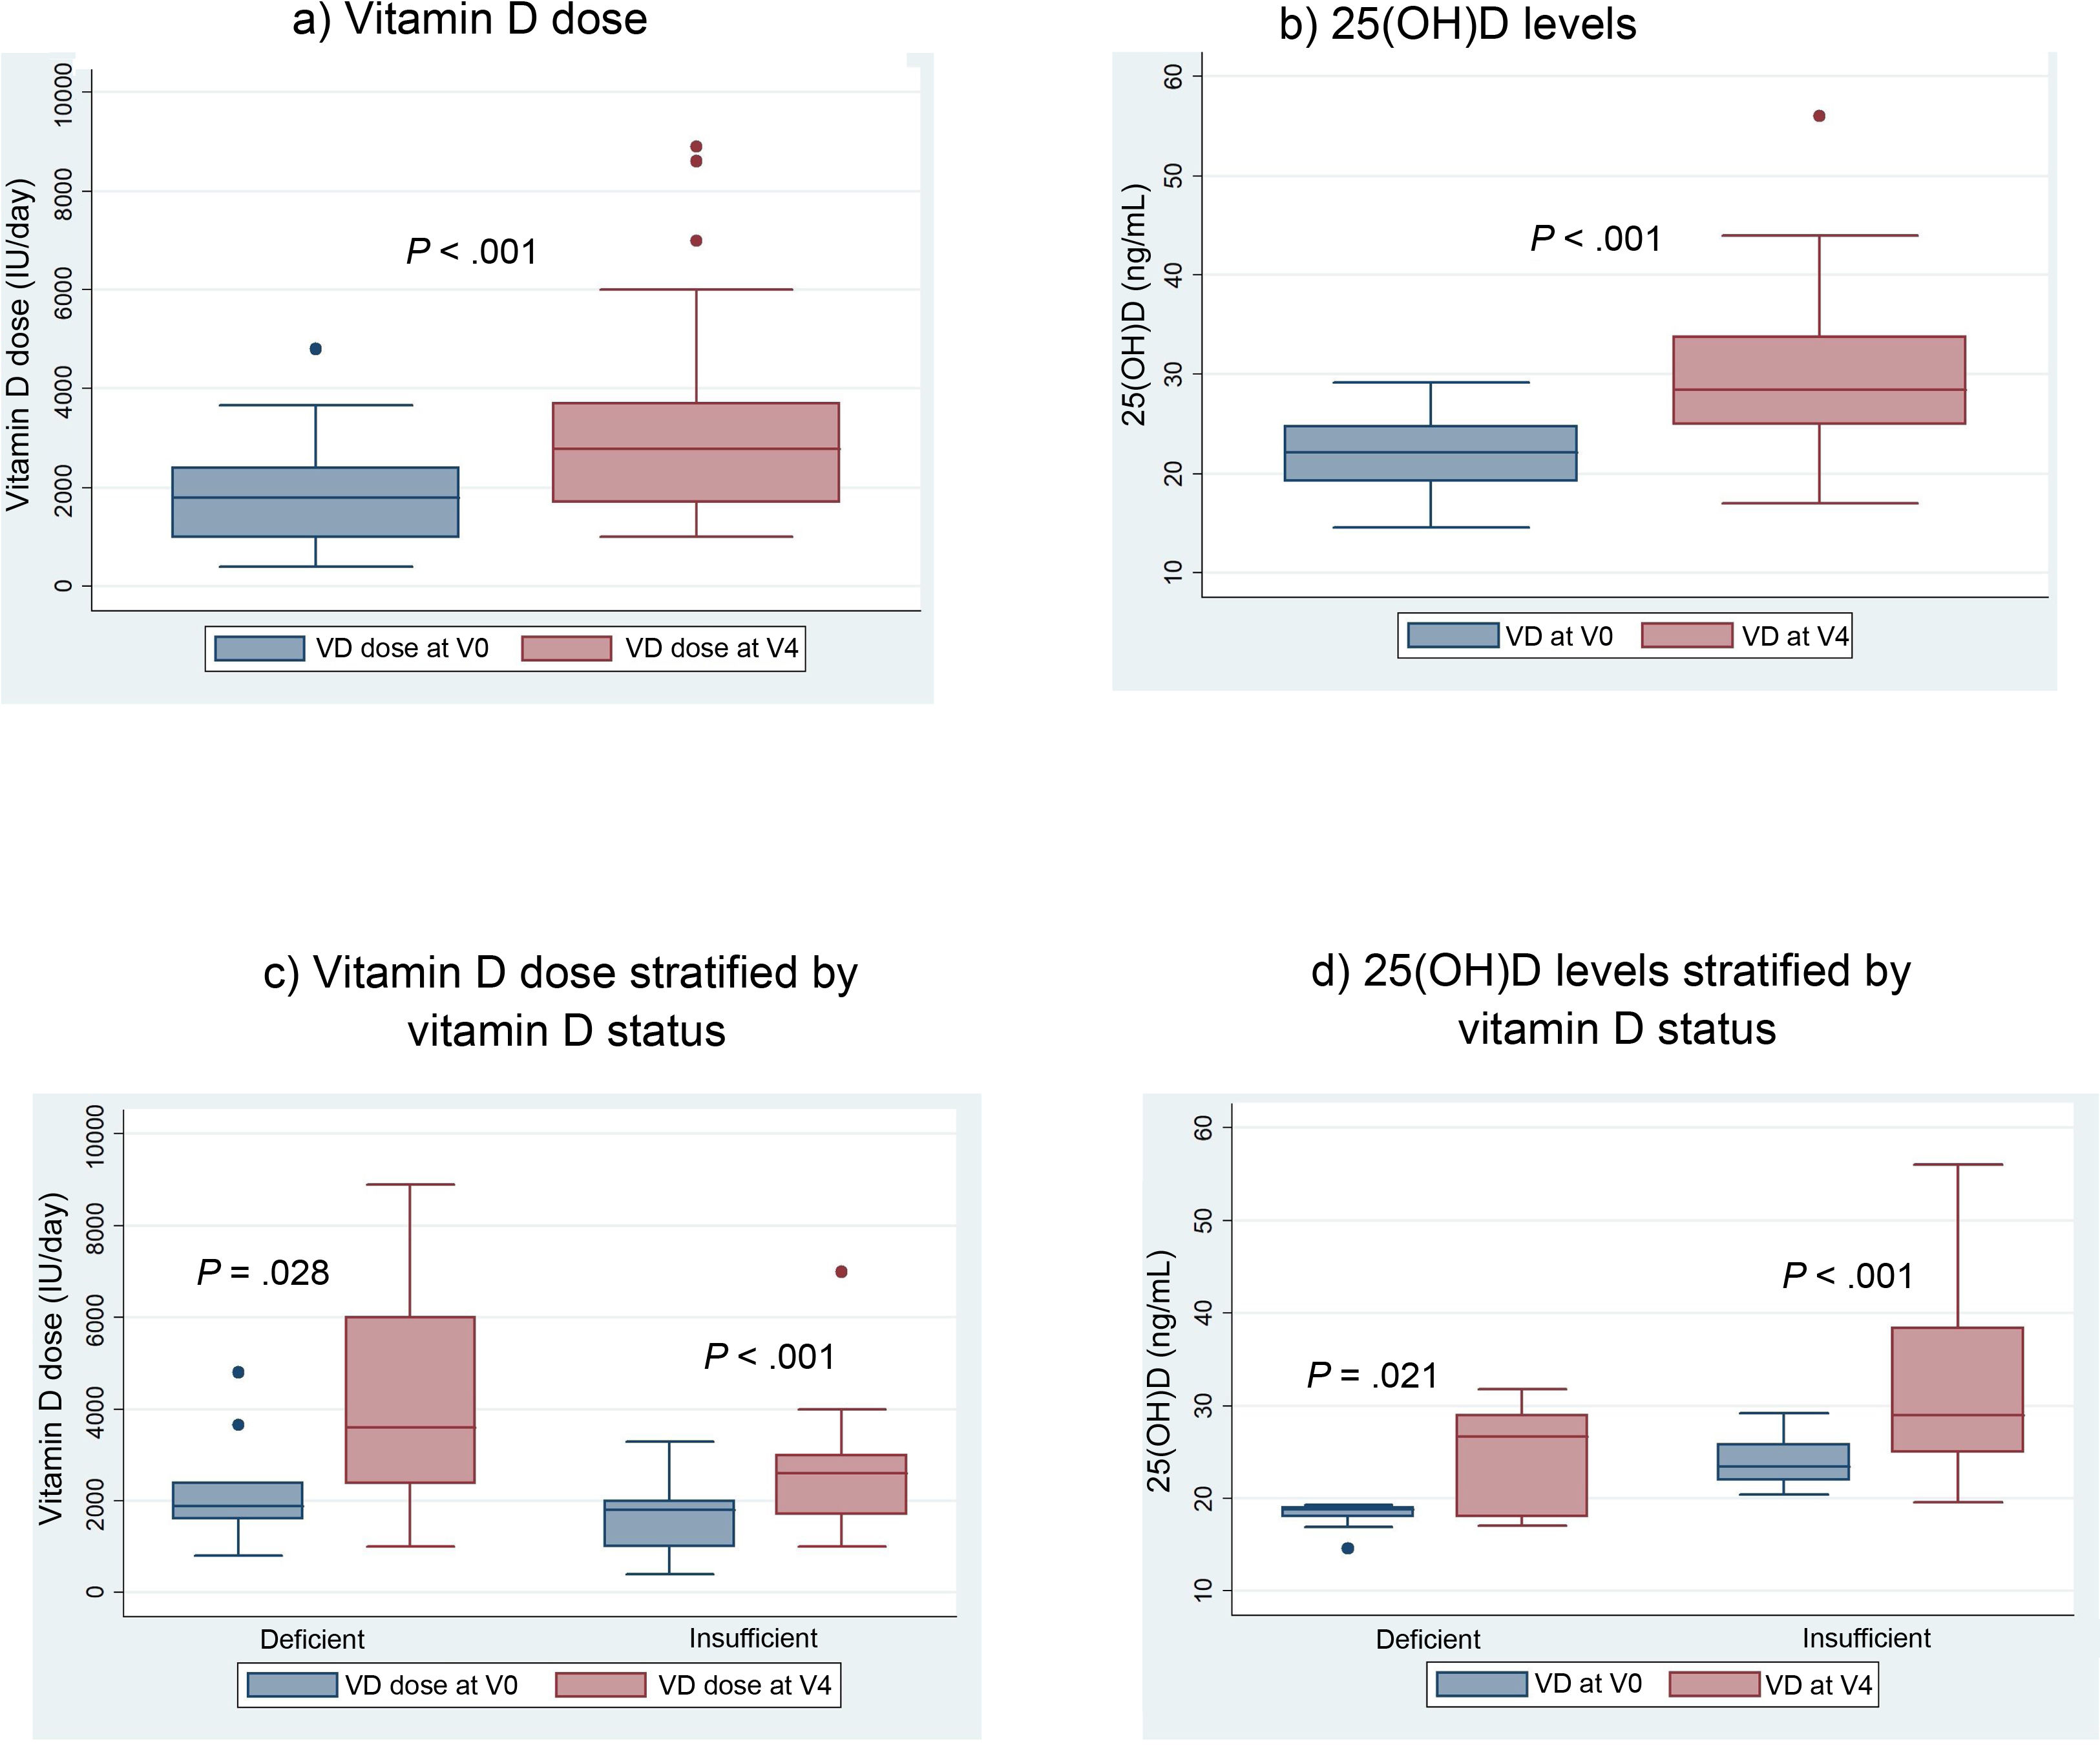
We also found a 7.6 ng/mL increment (95% CI, 4.6−10 ng/mL) in the mean level of 25(OH) D when we compared the initial visit (22.12 ng/mL) and last visit (29.75 ng/mL) in patients that completed the 12 months of follow-up (Fig. 3b).
There was a positive correlation between the increase in the administered dose of VD (between V0 and V4) and the increase in the 25(OH)D levels between the same visits (r, 0.37; P = .045).
With the implementation of the protocol, the percentage of patients with deficient levels decreased from 30% to 13%, and the percentage with insufficient levels from 70% to 50% (P = .044). At 12 months of follow-up, 37% of patients had sufficient levels (>30 ng/mL). Fifty-three percent of patients exhibited improvement in their VD status: 5 went from the deficient to the insufficient range, 1 from the deficient to the sufficient range and 10 from the insufficient to the sufficient range.
When it came to weight status, assessed by means of the BMI, there were no significant differences after the implementation of the protocol in our study (Table 2).
Nutritional status, pancreatic and pulmonary function and phosphorus and calcium metabolism. Comparison of initial and last visits.
| Variable | V0 | V4 | P |
|---|---|---|---|
| Vitamin A (μg/dL), mean (95% CI) | 40.1 (33.8−46.4) | 41.9 (36.9–46.4) | .459 |
| Vitamin E (μg/mL), mean (95% CI) | 977.0 (817.4−1136.5) | 1019.5 (866.4–1172.7) | .623 |
| Vitamin E/cholesterol ratio (mg/g), mean (95% CI) | 7.8 (6.6−9.0) | 8.5 (7.0–10) | .323 |
| BMI z-score, mean (95% CI) | 0.03 (−0.4−0.5) | −0.09 (−0.5–0.3) | .292 |
| Stool fat (g/24 h) Mean (95% CI) | 7.1 (5.2−9.0) | 6.7 (5.2–8.1) | .665 |
| Pancreatic enzymes (lipase units/day) Mean (95% CI) | 122 288.0 (93 563.0–151 013.0) | 120 475.0 (95 086.0–145 864.0) | .874 |
| Cholesterol (mg/dL), mean (95% CI) | 129.6 (117.2–142.0) | 125.9 (116.2–136.0) | .288 |
| Triglycerides (mg/dL), mean (95% CI) | 87.2 (72.9–101.5) | 87.2 (72.4–102.1) | 1 |
| Zinc (µg/mL) Mean (95% CI) | 97.5 (84.9–110.0) | 97.9 (86.9–108.6) | .909 |
| FEV1 (%), mean (95% CI) | 74.2 (65.6–82.9) | 76.2 (66.6–85.8) | .303 |
| FEF25−75 (%), mean (95% CI) | 61.0 (40.2–81.8) | 60.4 (40.9–80.4) | .902 |
| VC (%), mean (95% CI) | 79.3 (69.0–89.6) | 83.8 (73.1–94.4) | .214 |
| Calcium (mg/dL), mean (95% CI) | 10.0 (9.7–10.2) | 9.6 (9.5–9.8) | .008 |
| Phosphorus (mg/dL), mean (95% CI) | 4.6 (4.4–4.8) | 4.5 (4.3–4.7) | .490 |
| Alkaline phosphatase (U/L), mean (95% CI) | 270.0 (230.0–309.0) | 225.0 (187.0–262.0) | .007 |
| Parathormone (pg/mL), mean (95% CI) | 46.0 (34.0–57.0) | 40.0 (32.0–48.0) | .199 |
BMI, body mass index; CI, confidence interval; FEF, forced expiratory flow in the middle of expiration; FEV1, forced expiratory volume in 1 s; SD, standard deviation; VC, vital capacity; V0, initial visit; V4, last visit.
Contrary to VD, we found no differences in the levels of any other fat-soluble vitamins at 1 year of follow-up. As regards exocrine pancreatic function, we found no differences in the stool fat content or any modifications to the pancreatic enzyme replacement therapy prescribed to patients (Table 2).
We assessed pulmonary function in patients through the FEV1, FEF25−75 and VC, and found no significant differences throughout the follow-up (Table 2).
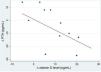
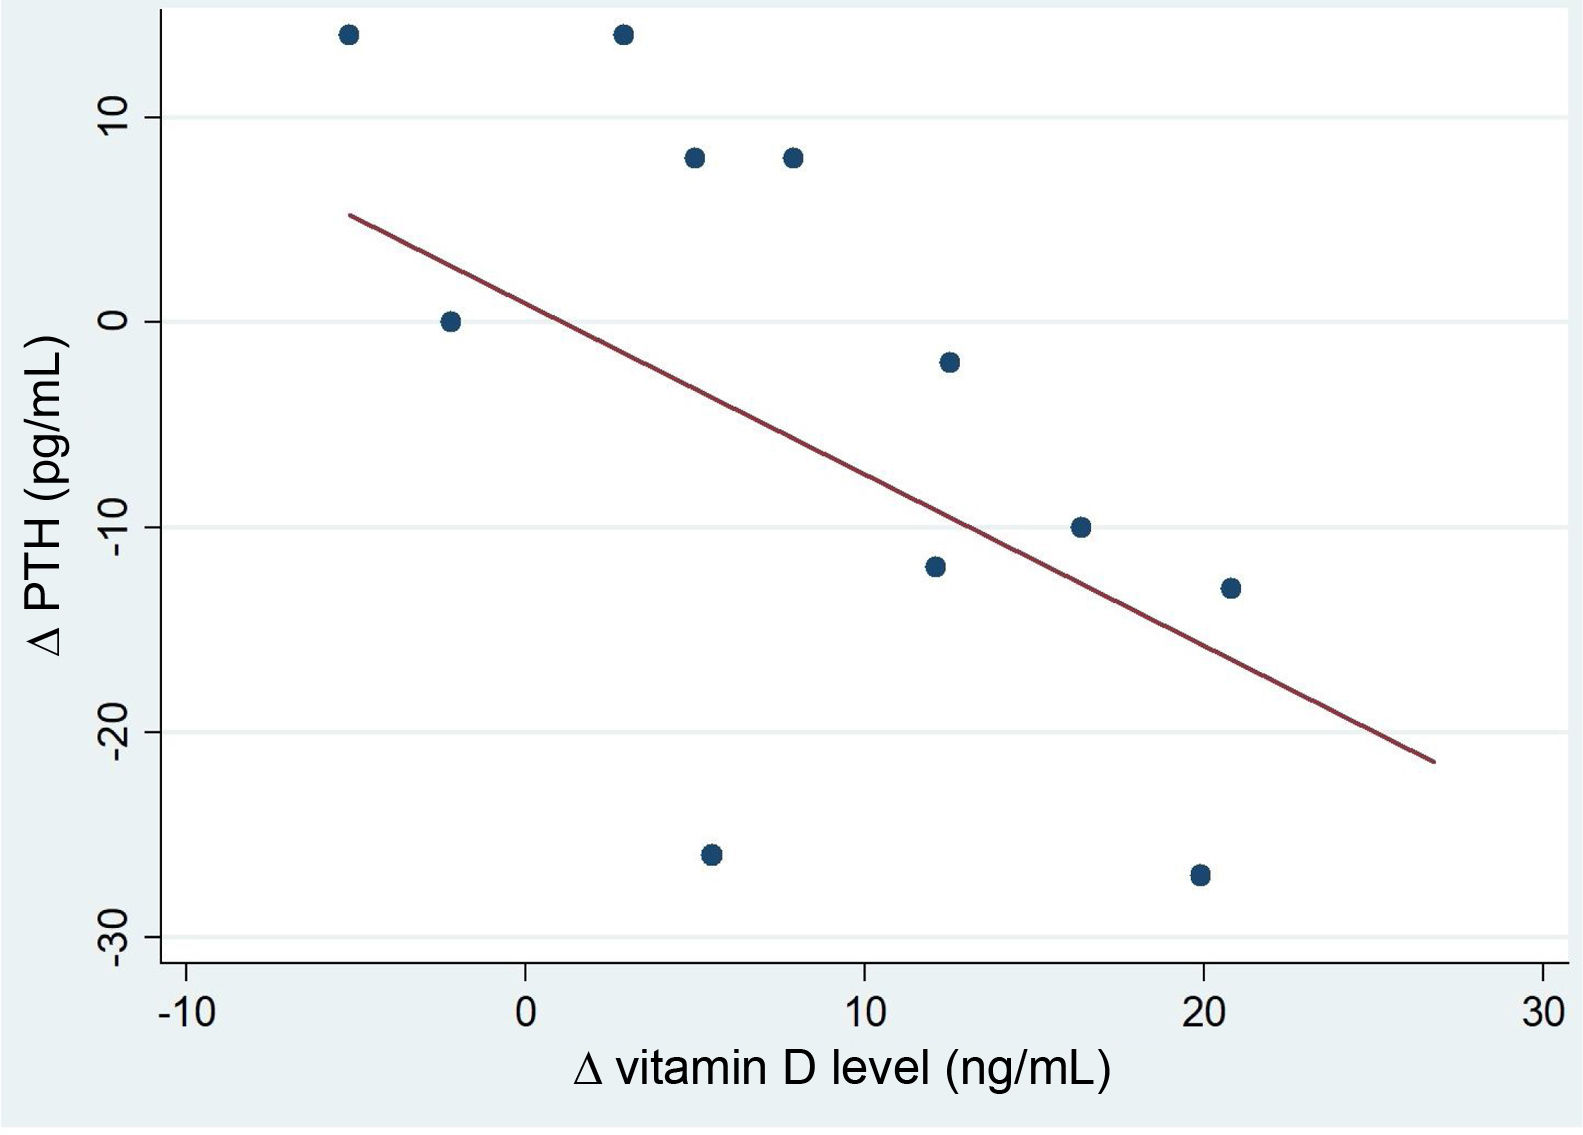
After the intervention, we found a statistically significant decrease in the levels of AP (Table 2). In the analysis stratified by age, we found an inverse correlation between the increase in 25(OH)D levels and increase in the levels of PTH in patients aged more than 10 years (Fig. 4). Table 3 presents the results of the analysis stratified by age group.
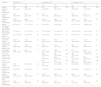
Nutritional status, pancreatic and pulmonary function and phosphorus and calcium metabolism stratified by age group. Comparison of initial and last visits.
| Variable | <2 years (n = 4) | 2−10 years (n = 11) | > 10 years (n = 15) | ||||||
|---|---|---|---|---|---|---|---|---|---|
| V0 | V4 | P | V0 | V4 | P | V0 | V4 | P | |
| 25(OH) vitamin D (ng/mL), median (IQR) | 21.6 (20.1−23.2) | 28.9 (25.5−35.8) | .14 | 23.0 (21.0−26.0) | 26.0 (25.0−32.0) | .037 | 20.4 (18.8−23.7) | 29.0 (19.6−38.4) | .003 |
| Vitamin A (μg/dL), median (IQR) | 44.7 (26.0−65.9) | 34.0 (34.0−43.0) | .59 | 36.4 (34.1−45.0) | 37.3 (36.4−48.0) | 1 | 38.0 (28.0−55.0) | 47.5 (34.0−54.0) | .06 |
| Vitamin E (μg/mL), median (IQR) | 608.0 (330.0−865.5) | 884.0 (736.0−1145.0) | .11 | 1025.0 (779.0−1244.0) | 950.0 (800.0−993.0) | .37 | 1213.0 (644.0−1408.0) | 974.0 (736.0−1306.0) | .83 |
| Vitamin E/cholesterol ratio (mg/g), median (IQR) | 6.0 (3.9−6.7) | 7.4 (7.7−11.3) | .11 | 8.1 (6.3−8.7) | 6.8 (6.1−8.3) | 1 | 8.0 (7.3−10.5) | 8.4 (6.2−12.3) | .7 |
| BMI z-score, median (IQR) | 1.1 (0.4−1.4) | 0.7 (−0.3−1.4) | .27 | −0.1 (−0.6−0.3) | 0.1 (−0.9−0.2) | .24 | −0.2 (−0.4−0.6) | −0.2 (−0.6−0.7) | .61 |
| Fat in stool (g/24 h), median (IQR) | 8.1 (3.3−12.9) | 8.1 (4.5−8.4) | .32 | 6.3 (5.4−6.9) | 6.8 (4.7−8.3) | .35 | 7.8 (6.9−10.7) | 8.3 (7.2−10.2) | .69 |
| Cholesterol (mg/dL), median (IQR) | 130.5 (88.5−156.0) | 128.0 (92.5−150.0) | .71 | 132.0 (126.0−155.0) | 136.5 (129.0−14.04) | .5 | 117.0 (94.0−148.0) | 118.0 (104.0−141.0) | .51 |
| Triglycerides (mg/dL), median (IQR) | 116.5 (95.5−150.5) | 112.5 (85.5−132.0) | .72 | 62.0 (52.0−81.0) | 75.0 (53.0−85.0) | .22 | 73.0 (62.0−88.0) | 65.0 (59.0−110.0) | .51 |
| Zinc (μg/mL), median (IQR) | 93.0 (66.0−119.0) | 93.0 (78.0−126.0) | .17 | 101.0 (81.0−123.0) | 116.5 (92.0−123.5) | .89 | 91.5 (72.0−115.0) | 93.0 (66.0−101.0) | .92 |
| FEV1 (%), median (IQR) | 80.0 (78.0−93.0) | 78.1 (78.0−109.0) | 0.29 | 76.0 (59.4−91.0) | 7.9 (59.0−9.0) | 0.8 | |||
| FEF25−75 (%), median (IQR) | 77.5 (62.5−94.0) | 64.5 (64.0−97.0) | 0.1 | 43.5 (31.0−60.0) | 52.5 (27.0−73.7) | 0.62 | |||
| VC (%), median (IQR) | 83.0 (81.0−100.0) | 81.0 (73.0−108.0) | 0.89 | 79.0 (60.0−97.0) | 83.0 (62.0−102.0) | 0.18 | |||
| Calcium (ng/mL), median (IQR) | 10.8 (9.6−11.0) | 9.7 (9.3−9.9) | .29 | 10.3 (10.2−10.4) | 9.8 (9.3−9.9) | .05 | 9.7 (9.4−9.9) | 9.7 (9.3−9.8) | .75 |
| Phosphorus (ng/mL), median (IQR) | 4.9 (4.7−6) | 5.5 (4.9−5.6) | 1 | 4.7 (4.4−5) | 4.8 (4.4−4.8) | .8 | 4.5 (4.3−4.8) | 4.3 (3.8−4.7) | .6 |
| Alkaline phosphatase (U/L), median (IQR) | 309.5 (241.0−377.0) | 257 (198.5−299.0) | .07 | 263.0 (215.0−372.0) | 226.0 (194.0−351.0) | .29 | 254.0 (190.0−292.0) | 169.5 (111.0−231.5) | .04 |
| Parathormone (pg/mL), median (IQR) | 34.5 (28.0−41.0) | 40.0 (16.0−43.0) | .59 | 42.0 (34.0−60.0) | 43.0 (34.0−55.0) | .21 | 41.0 (31.5−62.0) | 36.0 (30.0−49.5) | .49 |
BMI, body mass index; FEF, forced expiratory flow in the middle of expiration; FEV1, forced expiratory volume in 1 s; IQR, interquartile range; SD, standard deviation; VC, vital capacity. (FEV1), vital capacity (VC); V0, initial visit; V4, last visit.
Our study demonstrated that the implementation of the recommendations of the Cystic Fibrosis Foundation of the United States for vitamin D supplementation achieved an improvement in VD status in 53% of cases. On one hand, there was a progressive and significant increase in the administered dose (by a mean of 3165 IU/day at 1 year of follow-up) and, as a result, an increase in the mean 25(OH)D levels (from 22.12 to 29.75 ng/mL). However, only 37% of patients achieved sufficient VD levels.
The study by Abu-Fraiha et al.10 produced similar results. The protocol was also based on the recommendations of the Cystic Fibrosis Foundation and conducted in a sample of 90 paediatric and adult patients, and found improvement in the mean level of 25(OH)D from 19.5–24.5 ng/mL at 1 year of follow-up. At the end of the study, the percentage of patients with deficient levels had decreased from 50% to 26.7%, and from 27.8% of patients with insufficient levels to 43.3%. Twenty-seven percent of patients achieved sufficient levels greater than 30 ng/mL.
Also, Shepherd et al.5 conducted an experimental study in 142 paediatric patients with CF in which they assessed the impact of implementing a stoss therapy approach, consisting in the administration of a single dose of up to 600 000 IU followed by the customary daily dose. At 1 year of follow-up, the intervention had achieved an increase in the mean level from 19 ng/mL to 25.84 ng/mL, with 70% of patients achieving sufficient levels greater than 30 ng/mL.
Coriati et al.11 conducted a retrospective study in 200 adult patients with CF, increasing the administered VD dose to up to mean of 3403 IU/day. They assessed VD status before and after the intervention, and found that the levels of 25(OH)D increased from 25.9 to 37 ng/mL, and the proportion of patients with levels below 30 ng/mL went from 69% to 25.5%.
Adherence to treatment and the optimization of pancreatic enzyme replacement therapy are two important factors in assessing the efficacy of any intervention with fat-soluble vitamins in patients with CF and pancreatic insufficiency. In our study, we did not find differences in the stool fat, the administered dose of pancreatic enzymes or the vitamin A and E levels at 12 months of follow-up. However, we did find a positive correlation between increasing the dose of VD and increases in the plasma VD levels. These findings suggest that the effect of the intervention is partly explained by the increase in the administered dose of VD. If there had been an improvement in the adherence to treatment, we would have found an improvement in vitamin A and E status, as our patients receive supplementation through multivitamin dosage forms that include every fat-soluble vitamin. The improvement in vitamin D status could also not be attributed to changes in pancreatic function, as there were no changes in either the stool fat or in the treatment with pancreatic enzymes.
As regards pulmonary function, we ought to highlight that in recent years new functions have been attributed to vitamin D, with evidence of a possible anti-inflammatory or antimicrobial effect.12,13 However, the association between VD levels in patients with CF and lung function, pulmonary exacerbations or chronic pulmonary colonization by pathogens is controversial. In our study, we assessed pulmonary function through the %FEV1, %FEF25−75 and %VC for one year in which the administered VD dose was progressively increased. Despite the increase in serum levels of 25(OH)D, we found no evidence of improvement in pulmonary function, nor any correlation between the levels of 25(OH)D and any of the lung function parameters under study.
In their study, Abu-Fraiha et al.10 found an inverse correlation between the levels of 25(OH)D and pulmonary exacerbations as well as the days of hospitalization, but not a correlation with lung function, which did not change despite the improvement in vitamin D status.
A study conducted by Lehoux Dubois et al.14 assessed the impact of an increase in VD supplementation in adult patients with CF. The authors found a direct correlation between the %FEV1 and the serum levels of 25(OH)D at the beginning of the study, but it was not sustained through time.
Similarly, our results are consistent with the findings of the most recent meta-analyses, which have concluded that, despite the increase in the dose of VD given to patients with CF in recent years, there have been no relevant changes from a pulmonary standpoint.15
In our study, we analysed different variables related to calcium and phosphorus metabolism before and after the intervention. We found a decrease in the levels of AP at 1 year of follow-up and an inverse correlation between the serum levels of 25(OH)D and PTH, mainly in patients aged more than 10 years. These findings indirectly suggest that bone resorption may have decreased by the end of the intervention. We did not find significant changes in the levels of calcium or phosphorus.
Our findings are similar to those of previous studies in which the increase in 25(OH)D levels did not seem associated with changes in any other parameter of calcium and phosphorus metabolism.10,16–19
It must be taken into account that it is difficult to observe changes in serum calcium or phosphorus levels, as they are tightly regulated by homeostatic mechanisms. However, a sustained vitamin D deficiency can have a negative impact on bone health even if serum calcium and phosphorus levels are in the normal range.
As regards the safety of the proposed protocol, of the total of 32 patients who participated in the study, 2 developed levels of 25(OH)D greater than 100 ng/mL. It is believed that levels higher than 100–150 ng/mL can cause hyperphosphatemia and hypercalcemia, so these patients were withdrawn from the study due to the risk of toxicity.6,20
The first of these two patients was aged 10.4 years, was homozygous for the DF508 variant, received 600 IU/day of VD and had the dose increased to 1000 IU/day. We observed an increase in the 25(OH)D levels from 27.2 ng/mL at baseline to 122 ng/mL at 3 months. The second patient was aged 16.3 years, was heterozygous for the DF508 variant, received 1966 IU/day of VD and had the dose increased to 2785 IU/day. The levels of 25(OH)D increased from 17.3 ng/mL at baseline to 159.7 ng/mL at 3 months.
After being withdrawn from the study, the levels of VD decreased again in both patients. The high levels had no clinical impact at any point, and all other markers of phosphorus and calcium metabolism were unaffected, and there were no other clinically relevant or statistically significant changes.
It is worth noting that neither the dose increases nor the final doses were very high. This could be explained by individual genetic susceptibility. In recent years, evidence has emerged that various gene polymorphisms chiefly associated with VD transport may explain up to 20% of the variance in 25(OH)D levels.21 More than 120 variants of the gene that encodes vitamin D-binding protein (VDBP) with different affinities for VD have been identified to date, and this could play a part in the variability in the levels of calcidiol.22
There are several limitations to our study, chiefly due to the absence of randomization, a control group or masking. The recruited patients could also be particularly motivated to participate, and it is plausible that the sample may have been drawn from a subset of patients with adequate medical follow-up and adherence, so that the results may not be generalizable to the entire population.
Among the strengths of our study, we would like to highlight that it is one of the largest case series presented to date analysing the impact of implementing these new recommendations for treatment of VD deficiency in patients with CF and pancreatic insufficiency.
Contrary to other works that included patients with pancreatic-sufficient CF, our study focused exclusively on those in whom VD deficiency was more problematic, that is, patients with more severe phenotypes and exocrine pancreatic insufficiency.
In conclusion, the implementation of the recommendations of the United States Cystic Fibrosis Foundation led to an increase in the dose of VD received by our patients and a corresponding increase in VD serum levels associated with a decrease in the proportion of patients with VD deficiency. However, we were still far from achieving the levels recommended for patients with CF. Further studies are required to determine whether this increase in VD levels can achieve a clinically relevant positive effect.
When the dose of VD is increased, serum levels of the vitamin must be monitored, and patients have to be assessed for the presence of clinical or laboratory signs of hypercalcaemia.
FundingThis study received funding from the Fundación Ernesto Sánchez Villares (05/2015) and the Fundación Nutrición y Crecimiento.
Conflicts of interestThe authors have no conflicts of interest to declare.
Previous meeting: This study was presented at the National Congress of the Sociedad Española de Gastroenterología Hepatología y Nutrición Pediátrica (SEGHNP), 2020, held online.
