


Management of childhood obesity, based upon behavioural, physical activity and dietary guidance, usually achieves limited success and is hindered by a high attrition rate. The identification of potential predictors of either weight loss or early weight management attrition could help develop personalised management plans in order to improve patient outcomes.
Patients and methodsWe conducted a retrospective study in a cohort of 1300 patients with obesity managed in speciality clinics for up to 5 years with outpatient conservative treatment. We studied the family background and personal characteristics (demographic, behavioural, psychosocial, anthropometric and metabolic) of patients who dropped out before completing the first year of the programme and patients who achieved significant weight loss, with a separate analysis of patients who achieved substantial reductions in weight compared to the rest of the cohort.
ResultsThe mean age of the patients in the cohort was 10.46 years (SD, 3.48) the mean BMI z-score 4.01 (SD, 1.49); 52.8% of the patients were male, 53.3% were prepubertal, 75.8% were Caucasian and 19% Latin. We found a higher proportion of Latinla ethnicity and compulsive eating in the group of patients with early attrition from the weight management follow-up. In the group of patients with substantial weight loss, a greater proportion were male, there was a higher frequency of dietary intake control at home and obesity was more severe, and the latter factor was consistently observed in patients who achieved substantial weight loss at any point of the follow-up.
ConclusionsSome family and personal characteristics in childhood obesity are associated with an increased risk of early withdrawal from follow-up or a greater probability of successful outcomes; however, the predictive value of these variables is limited.
El tratamiento de la obesidad infanto-juvenil, basado en modificaciones higiénico-dietéticas, ofrece habitualmente un éxito limitado y presenta una alta tasa de abandono del seguimiento por parte de los pacientes. La investigación de predictores de éxito terapéutico y abandono precoz del seguimiento facilitaría una individualización terapéutica que podría determinar mejores resultados de la intervención.
Pacientes y métodosEstudio retrospectivo realizado en 1300 pacientes con obesidad, atendidos en consultas de atención especializada durante un máximo de 5 años, de forma ambulatoria, recibiendo tratamiento conservador. Se estudiaron las características demográficas, familiares, comportamentales, psicosociales, antropométricas y metabólicas diferenciales de los pacientes que abandonaron el seguimiento antes del primer año de intervención y las de aquellos que alcanzaron una reducción ponderal significativa, diferenciando aquellos con reducción ponderal particularmente intensa, respecto al resto de la cohorte.
ResultadosLa cohorte presentaba una edad e IMC-Z-score medios de 10,46 ± 3,48 años y 4,01 ± 1,49, respectivamente (52,8% sexo masculino; 53,3% prepuberales; 75,8% etnia caucásica y 19% hispana. Se observó mayor prevalencia de etnia latina e ingesta compulsiva entre los pacientes que abandonaban precozmente el seguimiento. Entre los pacientes que conseguían reducción ponderal particularmente intensa, había una mayor prevalencia de sexo masculino y control domiciliario de la ingesta, así como mayor gravedad de su obesidad, siendo esto último, constante entre los pacientes con reducción ponderal significativa en cualquier momento del seguimiento.
ConclusionesAlgunas características de los niños afectos de obesidad pueden orientar acerca de un mayor riesgo de abandono precoz del seguimiento o de una mayor probabilidad de éxito terapéutico, debiendo considerarse en el diseño de la estrategia de intervención y pauta de seguimiento, aunque la capacidad predictora de estas variables es limitada.

Childhood obesity is the most prevalent chronic disease in children and adolescents in our country. Its aetiology is multifactorial and emerges from the interaction of environmental factors with genetic predisposing factors. The development of the disease is associated with an increase in the risk of multiple comorbidities, chief of which are type 2 diabetes (T2D), high blood pressure, dyslipidaemia and physical limitations that have a psychological impact in both childhood and adolescence.1,2 Furthermore, the development of obesity during childhood or adolescence is associated with the persistence of the disease in adulthood, which occurs in 80% of cases in the presence of underlying psychosocial determinants.3,4
Among the contributors to this high prevalence are dietary and physical activity habits in addition to everyday social and interpersonal dynamics1 and the occurrence of events of global scope, like the SARS-CoV-2 pandemic, associated with an increase in the prevalence and severity of obesity in children and adolescents.5
Although some pharmaceuticals are already available for treatment of obesity in adolescents, their use in Spain is limited and is not authorised or accessible for most paediatric patients,6 in whom treatment is based on behavioural modification strategies with changes in diet and physical activity and ongoing monitoring of these behavioural changes.7 In general, this therapeutic approach achieves modest weight losses (although this varies between patients) and is associated with a high rate of attrition.8
The current knowledge regarding potential predictors of treatment success is limited and, while the existing literature contemplates demographic, anthropometric, metabolic and follow-up variables, there is still no evidence on which the main determinants of success actually are, and the existing evidence is further limited due to the methodological heterogeneity, the design of the different interventions and the data collection methods.4,9 Furthermore, the objective evaluation of these variables poses a significant challenge due to the bias inherent in self-reporting and the frequency with which weight loss is regained, resulting in the chronicity of excess weight.10
The rate of attrition for interventions aimed at paediatric patients with obesity is high (greater than 40% in some case series) and attrition has been found to be predictor of poor outcomes that limits not only patient improvement but also the estimation of the impact of interventions and their outcomes.11 This is also the case in Spain, where a study found an attrition rate greater than 10% after the first evaluation and of nearly 50% at 1 year of the intervention,8 clearly demonstrating a lack of self-awareness regarding the disease. The existing evidence suggests that attrition is more frequent in patients with greater excess weight and/or lower socioeconomic status12 and may also be influenced by other variables, such as ethnicity, sex or age, while there is a dearth of evidence regarding the potential impact of the developmental stage of the child or the presence of metabolic comorbidities on adherence to treatment.8,11,12
Thus, the high prevalence of childhood obesity, the high rate of attrition during follow-up and the limited results of therapeutic interventions for obesity in children and adolescents warrant the investigation of variables that would allow personalization of treatment and follow-up strategies to optimise outcomes.
Patients and methodsPatientsWe conducted a retrospective and longitudinal observational study in a cohort of 1300 patients with obesity, defined as a body mass index z score (BMIz) greater than +2 using the Hernández et al.13 growth tables as reference, in adherence to the recommendation of the current clinical practice guideline for the prevention and treatment of childhood and youth obesity published by the National Health System of the Ministry of Health and Social Policy of Spain in the framework of its quality management plan.7
The sample was recruited between 2009 and 2015 in a specialised clinic devoted to the diagnosis and treatment of childhood obesity of a tertiary care hospital, where patients had been referred by their primary care paediatrician or doctors in other specialities in the same or other hospitals. We offered participation in the study to any of the patients managed in the clinic who did not meet any of the exclusion criteria, which were: (1) the presence of any endocrine disorder or genetic syndrome or disorder underlying the development of obesity and (2) the inability to understand or correctly implement the follow-up plan and the prescribed treatment.
We analysed patient data obtained during the follow-up (maximum of 5 years). The therapeutic intervention was implemented at the outpatient level, with the following schedule for follow-up visits: first clinical evaluation 1 month after the initial evaluation and enrolment in the study, visits every 3 months during the first year of follow-up and every 6 months the 4 following years.
The management did not include pharmacological treatment and was based on a three-pronged approach of behavioural modification and changes in dietary and physical activity habits, as described previously,8 based on the recommendations of the current clinical practice guideline for the prevention and treatment of childhood and youth obesity of the National Health System.7 Emphasis was placed on the implementation of the three behavioural measures related to intake that have proven most effective and feasible in terms of maintenance in the treatment of childhood obesity, which are the planning of intake around interprandial fasting intervals (particularly, avoiding snacking outside meal times and avoiding energy intake in fluid form, or “not drinking calories”), eating slower to promote satiety and reducing the size of portions (providing action guidelines for the development, implementation and duration of planned meals). The care team provided a weekly menu arranged into 5 meals a day to ensure the correct distribution and frequency of consumption of the different food groups, although without specific limits for energy intake. Lastly, patients received recommendations adjusted for their age and fitness level to engage in daily physical activity of sufficient intensity and duration for weight control. To promote adherence to the recommended treatment, the team provided forms for the patient and family to track the daily implementation of these recommendations that were later reviewed during the visits.
MethodsTable 1 details the variables analysed in the study, including the source of referral, family and personal history (demographic, neonatal, behavioural), the relevance attributed to obesity as a disease, the attitude of the patient and parents toward changing habits, anthropometric measurements and the values of metabolic markers and hormones obtained in the first visit, calculating the = whole-body insulin sensitivity index (WBISI) and the Homeostatic Model Assessment (HOMA) index for insulin resistance (IR) as described in a past article14 and considering the individual or combined presence of one or more metabolic comorbidities and/or hyperinsulinemia (IR defined as fasting insulin serum level >15 µU/mL).14
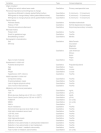
Variables recorded in the first visit and analysed in the study.
| Variables | Type | Values/categories |
|---|---|---|
| Origin of patient | ||
| Setting from which referral was made | Qualitative | Primary care/specialist care |
| Perceived importance and willingness to change | ||
| Importance attributed to obesity (patient/father/mother) | Quantitative | 0 (minimum) – 10 (maximum) |
| Willingness to change dietary intake (patient/father/mother) | Quantitative | 0 (minimum) – 10 (maximum) |
| Willingness to change physical activity (patient/father/mother) | Quantitative | 0 (minimum) – 10 (maximum) |
| Family history | ||
| Parental obesity | Qualitative | No/father/mother/both |
| History of T2D | Qualitative | No/first-degree/second-degree |
| Parental educational attainment | Qualitative | No/primary/secondary/ university |
| Neonatal history | ||
| Preterm birth | Qualitative | Yes/No |
| Small for gestational age | Qualitative | Yes/No |
| Breastfeeding duration | Quantitative | Months |
| Demographic characteristics | ||
| Sex | Qualitative | Male/Female |
| Ethnicity | Caucasian | |
| Maghrebi | ||
| Romanian | ||
| Qualitative | Latin American | |
| African | ||
| Asian | ||
| Filipin | ||
| Age at onset of obesity | Quantitative | Years |
| Assessment in initial visit | ||
| Pubertal development | Qualitative | Prepuberal/puberal |
| Age | Quantitative | Years |
| BMI | Quantitative | z score |
| Height | Quantitative | z score |
| Hypertension (IDF criterion) | Qualitative | Yes/No |
| Habits reported in initial visit | ||
| Compulsive eating | Quantitative | Yes/No |
| Snacking between meals | Quantitative | Yes/No |
| Lack of regular physical activity | Quantitative | Yes/No |
| Use of school meal services | Qualitative | Yes/No |
| Metabolic and hormonal parameters | ||
| Free T4 | Quantitative | ng/mL |
| TSH | Quantitative | µU/mL |
| Blood glucose (fasting and at 120 min in OGTT) | Quantitative | mg/dL |
| Serum insulin (fasting and at 120 min in OGTT) | Quantitative | µU/mL |
| HOMA-IR | Quantitative | (no units) |
| WBISI | Quantitative | (no units) |
| HbA1c | Quantitative | % |
| Insulin resistance | Qualitative | Yes/No |
| Abnormal blood glucose level (high or low) | Qualitative | Yes/No |
| High total cholesterol serum level | Qualitative | Yes/No |
| Low HDL level | Qualitative | Yes/No |
| High LDL level | Qualitative | Yes/No |
| High triglyceride levels | Qualitative | Yes/No |
| High uric acid levels | Qualitative | Yes/No |
| Detection of any abnormality in carbohydrate metabolism | Qualitative | Yes/No |
| Detection of any abnormality in lipid metabolism | Qualitative | Yes/No |
| Detection of at least 1 metabolic abnormality | Qualitative | Yes/No |
| Total number of metabolic abnormalities | Quantitative | (no units) |
BMI, body mass index; HbA1c, glycated haemoglobin; HDL, high-density lipoprotein; HOMA-IR, Homeostatic Model Assessment for Insulin Resistance; IDF, International Diabetes Federation; LDL, low-density lipoprotein; OGTT, oral glucose tolerance test; TSH, thyroid-stimulating hormone; T2D, type 2 diabetes; T4, thyroxine; WBISI, whole-body insulin sensitivity index.
Definitions:
- Blood glucose abnormalities: >100 mg/dL (abnormal fasting glucose), 140–199 mg/dL at 120 minutes in OGTT (altered glucose tolerance), >126 mg/dL fasting or >200 mg/dL at 120 minutes in OGTT (T2D).14
Insulin resistance: fasting serum insulin level >15 µU/mL.14
- Abnormality in carbohydrate metabolism: insulin resistance and/or abnormal blood glucose levels.
- Abnormality in lipid metabolism: low HDL levels, high LDL and/or triglyceride levels.
- Metabolic abnormality: presence of any abnormality in carbohydrate and/or lipid metabolism.
We defined early attrition (EA) as dropping out before 1 year of follow-up. We defined treatment success (TS) as a decrease in the BMIz greater than 0.5 relative to baseline at the established time points (6 months and 1, 3 and 5 years). We defined substantial weight loss as a reduction in the BMIz greater than 1.5 or a relative weight loss greater than 10% of the baseline weight at any time of follow-up.
The parents/legal guardians of all participants were informed about the purpose of the study and signed the informed consent form (we also obtained the signed assent of patients aged more than 12 years) as required by the local Ethics Committee of Research with Medicines, which has previously approved the study protocol in adherence to the ethical principles for medical research involving human subjects of the 2013 Declaration of Helsinki of the World Medical Association.
Statistical analysisWe used the χ2 test (qualitative variables) or Mann-Whitney U test (quantitative variables), to compare the baseline characteristics of patients documented in the first visit in the following groups:
- (1)
Patients who remained in follow-up at 1 year vs those who had dropped out before that time point (EA), and patients who remained in follow-up at 5 years vs those who did not.
- (2)
Patients who, at any point of follow-up, achieved substantial weight loss (SWL) compared to those who did not.
- (3)
Patients who achieved weight loss equivalent to a reduction of more than 0.5 points in the BMIz (TS) vs those who did not at each of the follow-up time points (6 months and 1, 3 and/or 5 years).
Subsequently, we conducted multiple logistic regression analyses of the EA, SWL and TS dependent variables at each of the time points in which the independent variables were the ones that, among those listed in Table 1, had been found to be significantly associated with the dependent variable in the preliminary univariate analysis. The goodness of fit of the models was assessed by means of the Hosmer-Lemeshow test. The discriminant ability of the model was evaluated based on the obtained area under the receiver operating characteristic (ROC) curve analysing the probability of the value predicted by the multivariate model. We present the results for the multivariate model expressed in terms of odds ratios (ORs) with the corresponding 95% confidence intervals (CIs).
The statistical analysis was performed with the software STATA/SE version 16.0 (Stata Corporation, College Station, Texas, USA) and we considered comparisons statistically significant for P values of less than 5%.
ResultsWe recruited a cohort of 1300 patients with obesity with a mean age of 10.46 years (SD, 3.48) and a mean BMIz of 4.01 (SD, 1.49); 52.8% were male and 47.2% female; 693 (53.3%) were prepubertal and 607 (46.7%) had undergone puberty onset. A majority of patients were Caucasian (75.8%), followed in frequency by patients of Latin American ancestry (19%), with a percentage of less than 2% for all other ethnic groups.14
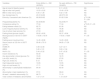
Early attritionA total of 592 patients (45.54%) had dropped out before 1 year of follow-up. We found statistically significant differences based on ethnicity (EA was more prevalent among patients of Latin American ancestry) and the prevalence of compulsive eating (which was more frequent in patients with EA). We also found statistically significant differences in the levels of glycated haemoglobin (HbA1c) and blood glucose at 120 minutes in the oral glucose tolerance test (OGTT), which were both lower in the EA group (Table 2).
Comparison of the most relevant baseline characteristics in patients with early attrition (attrition before 1 year of followup) versus patients who remained in follow-up 1 year after initiating the intervention.
| Variables | Early attrition n = 592 (45.54%) | No early attritionn = 708 (54.46%) | Significance |
|---|---|---|---|
| Age at onset of obesity (years) | 6.40 ± 3.16 | 6.11 ± 3.03 | NS |
| Age at initial visit (years) | 10.53 ± 3.25 | 10.40 ± 3.30 | NS |
| BMI in initial visit (z score) | 4.00 ± 1.38 | 4.02 ± 1.58 | NS |
| Sex: female/male (%) | 45.31/54.69 | 48.97/51.03 | NS |
| Ethnicity: Caucasian/Latin American (%) | 69.26/24.92 | 81.82/13.64 | χ2 31.96; P < .001 |
| Prepubertal/pubertal (%) | 53.40/46.60 | 53.23/46.77 | NS |
| Compulsive eating (%) | 77.04 | 71.04 | χ2 5.05; P < .05 |
| Eating between meals (%) | 82.75 | 81.06 | NS |
| Lack of regular physical activity (%) | 73.90 | 75.38 | NS |
| Use of school meal services (%) | 47.53 | 46.29 | NS |
| Fasting blood glucose (mg/dL) | 92.62 ± 6.90 | 92.37 ± 6.94 | NS |
| Blood glucose at 120 min in OGTT (mg/dL) | 116.84 ± 18.79 | 119.54 ± 18.84 | P < .05 |
| Fasting serum insulin(µU/mL) | 14.45 ± 8.98 | 14.29 ± 9.65 | NS |
| Serum insulin at 120 min in OGTT (µU/mL) | 95.46 ± 75.10 | 94.85 ± 71.59 | NS |
| HOMA-IR | 3.38 ± 2.48 | 3.27 ± 2.11 | NS |
| WBISI | 3.45 ± 1.91 | 3.60 ± 1.94 | NS |
| HbA1c (%) | 5.44 ± 0.32 | 5.47 ± 0.32 | P < .05 |
| Insulin resistance (%) | 53.40 | 51.90 | NS |
| Any abnormality in blood glucose (%) | 15.20 | 16.70 | NS |
| Low HDL levels (%) | 26.68 | 27.55 | NS |
| High LDL levels (%) | 8.13 | 9.16 | NS |
| High triglyceride levels (%) | 10.65 | 10.55 | NS |
| High uric acid levels (%) | 17.71 | 17.88 | NS |
| Abnormality in carbohydrate metabolism (%) | 64.40 | 63.40 | NS |
| Abnormality in lipid metabolism (%) | 37.51 | 39.24 | NS |
| At least 1 metabolic abnormality (%) | 66.73 | 71.10 | NS |
| Total number of metabolic abnormalities | 1.07 ± 1.01 | 1.13 ± 0.97 | NS |
BMI, body mass index; HbA1c, glycated haemoglobin; HDL, high-density lipoprotein; HOMA-IR, Homeostatic Model Assessment for Insulin Resistance; LDL, low-density lipoprotein; NS, not statistically significant; OGTT, oral glucose tolerance test; WBISI, whole-body insulin sensitivity index.
Definitions:
- Blood glucose abnormalities: >100 mg/dL (abnormal fasting glucose), 140–199 mg/dL at 120 minutes in OGTT (altered glucose tolerance), >126 mg/dL fasting or >200 mg/dL at 120 minutes in OGTT (T2D).14 Insulin resistance: fasting serum insulin level >15 µU/mL.14
- Abnormality in carbohydrate metabolism: insulin resistance and/or abnormal blood glucose levels.
- Abnormality in lipid metabolism: low HDL levels, high LDL and/or triglyceride levels.
- Metabolic abnormality: presence of any abnormality in carbohydrate and/or lipid metabolism.
The multiple logistic regression analysis identified a family history of T2D in a first-degree relative as a protective factor against EA. On the other hand, Latin American ethnicity was confirmed as a risk factor for EA (Table 3).
Variables significantly associated with early attrition (before 1 year of follow-up) and substantial weight loss at any point of follow-up in the multiple binary logistic regression analysis.
| Odds ratio | Significance (P > [Z]) | 95% CI | |
|---|---|---|---|
| Early attrition | |||
| History of T2D in first-degree relative | −0.22 | <.001 | [−0.09 to −0.56] |
| Latin-American ethnicity | 1.84 | <.05 | [1.10 to 3.08] |
| Substantial weight loss | |||
| Blood glucose at 120 min in OGTT (mg/dL) | 1.02 | <.001 | [1.01 to 1.03] |
| HbA1c (%) | 2.62 | <.01 | [1.33 to 5.15] |
| Use of school meal services | −0.61 | <.05 | [−0.40 to −0.93] |
HbA1c, glycated haemoglobin; OGTT, oral glucose tolerance test; T2D, type 2 diabetes.
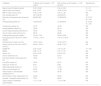
In reverse to the trends observed for EA, in the group of patients who remained in follow-up after 5 years (8.2% of the initial cohort, n = 107), compared to those who did not, the proportion of Latin American patients was lower, the age at the initial visit and at onset of obesity was younger, a higher proportion were in the prepubertal stage and the baseline HOMA-IR was lower, with no differences in any other variable under study (Table 4).
Comparison of the most relevant baseline characteristics in patients who remained in follow-up at 5 years from treatment initiation versus those who had dropped out before that time point.
| Variables | In follow-up at 5 yearsn = 107 (8.2%) | Not in follow-up at 5 yearsn = 1193 (91.8%) | Significance |
|---|---|---|---|
| Age at onset of obesity (years) | 5.09 ± 2.88 | 6.34 ± 3.09 | P < .01 |
| Age at initial visit (years) | 8.81 ± 2.97 | 10.60 ± 3.26 | P < .001 |
| BMI in initial visit (z score) | 4.06 ± 1.56 | 4.00 ± 1.49 | NS |
| Sex: female/male (%) | 54.70/45.30 | 46.49/53.51 | NS |
| Ethnicity: Caucasian/Latin American (%) | 88.89/5.98 | 74.56/20.29 | χ2 21.70; P < .001 |
| Prepubertal/pubertal (%) | 70.09/29.91 | 51.65/48.35 | χ2 14.54; P < .001 |
| Compulsive eating (%) | 70.37 | 74.25 | NS |
| Eating between meals (%) | 78.65 | 82.15 | NS |
| Lack of regular physical activity (%) | 76.34 | 74.52 | NS |
| Use of school meal services (%) | 58.70 | 46.29 | NS |
| Fasting blood glucose (mg/dL) | 91.68 ± 7.26 | 92.56 ± 6.88 | NS |
| Blood glucose at 120 min in OGTT (mg/dL) | 119.74 ± 19.70 | 118.14 ± 18.79 | NS |
| Fasting serum insulin (µU/mL) | 12.55 ± 6.24 | 14.53 ± 9.57 | NS |
| Serum insulin at 120 min in OGTT (µU/mL) | 83.26 ± 59.15 | 96.08 ± 74.17 | NS |
| HOMA-IR | 2.90 ± 2.55 | 3.37 ± 2.25 | P < .001 |
| WBISI | 3.80 ± 1.72 | 3.51 ± 1.94 | NS |
| HbA1c (%) | 5.52 ± 0.39 | 5.45 ± 0.31 | NS |
| Insulin resistance (%) | 43.59 | 53.51 | NS |
| Any abnormality in blood glucose (%) | 19.60 | 15.70 | NS |
| Low HDL levels (%) | 35.40 | 26.31 | NS |
| High LDL levels (%) | 8.93 | 8.66 | NS |
| High triglyceride levels (%) | 11.21 | 10.54 | NS |
| High uric acid levels (%) | 20.87 | 17.49 | NS |
| Abnormality in carbohydrate metabolism (%) | 31.80 | 45.30 | NS |
| Abnormality in lipid metabolism (%) | 42.86 | 38.00 | NS |
| At least 1 metabolic abnormality (%) | 70.27 | 68.97 | NS |
| Total number of metabolic abnormalities | 1.13 ± 1.08 | 1.10 ± 0.98 | NS |
BMI, body mass index; HbA1c, glycated haemoglobin; HDL, high-density lipoprotein; HOMA-IR, Homeostatic Model Assessment for Insulin Resistance; LDL, low-density lipoprotein; NS, not significant; OGTT, oral glucose tolerance test; WBISI, whole-body insulin sensitivity index.
Definitions:
- Blood glucose abnormalities: >100 mg/dL (abnormal fasting glucose), 140–199 mg/dL at 120 minutes in OGTT (altered glucose tolerance), >126 mg/dL fasting or >200 mg/dL at 120 minutes in OGTT (T2D).14 Insulin resistance: fasting serum insulin level >15 µU/mL.14
- Abnormality in carbohydrate metabolism: insulin resistance and/or abnormal blood glucose levels.
- Abnormality in lipid metabolism: low HDL levels, high LDL and/or triglyceride levels.
- Metabolic abnormality: presence of any abnormality in carbohydrate and/or lipid metabolism.
We found a decrease in the BMIz by at least 0.5 points compared to baseline in 44.44% of the patients that remained in follow-up at 6 months (413/930); 43.18% at 1 year (306/708); 47.79% at 3 years (119/250) and 58.88% at 5 years (63/107).
The severity of obesity (BMIz) at the time of the first visit was the only variable significantly associated with TS, with a higher BMIz in patients who achieved TS at 6 months (4.31 [SD, 1.61] vs 3.72 [SD, 1.33]; P < .001); 1 year (4.23 [SD, 1.62] vs 3.77 [SD, 1.50]; P < .001); 3 years (4.44 [SD, 1.60] vs 3.78 [SD, 1.43]; P < .001) and 5 years (4.41 [SD, 1.65] vs 3.66 [SD, 1.25]; P < .01) compared to patients who did not achieve TS.
The multiple binary logistic regression analysis corroborated that a greater BMIz at baseline was associated with successful weight loss from 2 years of follow-up (OR, 1.67; 95% CI, 1.15–2.41; P < .01). There was also a higher proportion of prepubertal patients in the group that achieved weight loss at 6 months (χ2 34.40; P < .001) and 1 year (χ2 10.71; P < .001), although the association ceased to be significant at 3 and 5 years of follow-up.
When it came to the studied metabolic markers, we only found a lower proportion of patients with low levels of high density lipoprotein (HDL) at baseline among those who achieved weight loss at 6 months (χ2 4.64; P < .05) and a lower proportion with any abnormality in the lipid profile among those who achieved TS at 1 year of follow-up (χ2 6.30; P < .05).
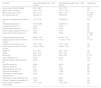
Substantial weight lossA total of 252 patients (19.4% of the cohort) achieved substantial weight loss over a mean time of 0.94 years (SD, 0.86) (Table 5).8
Comparison of the most relevant baseline characteristics in patients who achieved significant weight loss versus patients who did not.
| Variables | Substantial weight lossn = 252 (19.4%) | No substantial weight lossn = 1048 (80.6%) | Significance |
|---|---|---|---|
| Age at onset of obesity (years) | 6.12 ± 2.87 | 6.28 ± 3.15 | NS |
| Age at initial visit (years) | 10.41 ± 3.19 | 10.47 ± 3.03 | NS |
| BMI in initial visit (z score) | 4.24 ± 1.46 | 3.95 ± 1.50 | P < .001 |
| Sex: female/male (%) | 38.49/61.51 | 49.33/50.67 | χ2 9.58; P < .01 |
| Ethnicity: Caucasian/Latin American (%) | 78.17/17.06 | 75.29/19.47 | NS |
| Prepubertal/pubertal (%) | 57.14/42.86 | 52.39/47.61 | NS |
| Compulsive eating (%) | 74.02 | 73.95 | NS |
| Eating between meals (%) | 83.26 | 81.55 | NS |
| Lack of regular physical activity (%) | 73.24 | 75.00 | NS |
| Use of school meal services (%) | 40.00 | 48.58 | χ2 3.95; P < .05 |
| Fasting blood glucose (mg/dL) | 92.64 ± 7.46 | 92.44 ± 6.78 | NS |
| Blood glucose at 120 min in OGTT (mg/dL) | 121.77 ± 21.51 | 117.28 ± 17.94 | P < .05 |
| Fasting serum insulin(µU/mL) | 14.57 ± 8.39 | 14.31 ± 9.58 | NS |
| Serum insulin at 120 min in OGTT (µU/mL) | 102.15 ± 76.34 | 93.20 ± 72.27 | NS |
| HOMA-IR | 3.40 ± 2.01 | 3.30 ± 2.35 | NS |
| WBISI | 3.49 ± 1.94 | 3.54 ± 1.92 | NS |
| HbA1c (%) | 5.52 ± 0.31 | 5.44 ± 0.32 | P < .01 |
| Insulin resistance (%) | 55.16 | 52.00 | NS |
| Any abnormality in blood glucose (%) | 23.80 | 14.10 | NS |
| Low HDL levels (%) | 28.46 | 26.82 | NS |
| High LDL levels (%) | 6.91 | 9.13 | NS |
| High triglyceride levels (%) | 9.64 | 10.83 | NS |
| High uric acid levels (%) | 17.67 | 17.84 | NS |
| Abnormality in carbohydrate metabolism (%) | 50.40 | 42.70 | NS |
| Abnormality in lipid metabolism (%) | 36.18 | 39.01 | NS |
| At least 1 metabolic abnormality (%) | 70.90 | 68.63 | NS |
| Total number of metabolic abnormalities | 1.15 ± 1.03 | 1.09 ± 0.98 | NS |
BMI, body mass index; HbA1c, glycated haemoglobin; HDL, high-density lipoprotein; HOMA-IR, Homeostatic Model Assessment for Insulin Resistance; LDL, low-density lipoprotein; NS, not significant; OGTT, oral glucose tolerance test; WBISI, whole-body insulin sensitivity index.
Definitions:
- Blood glucose abnormalities: >100 mg/dL (abnormal fasting glucose), 140–199 mg/dL at 120 minutes in OGTT (altered glucose tolerance), >126 mg/dL fasting or >200 mg/dL at 120 minutes in OGTT (T2D).14 Insulin resistance: fasting serum insulin level >15 µU/mL.14
- Abnormality in carbohydrate metabolism: insulin resistance and/or abnormal blood glucose levels.
- Abnormality in lipid metabolism: low HDL levels, high LDL and/or triglyceride levels.
- Metabolic abnormality: presence of any abnormality in carbohydrate and/or lipid metabolism.
We found significant differences in frequency based on sex (higher proportion of male patients in the SWL group); the BMIz (greater in the SWL group) and in using school meal services (lower proportion in SWL group). We found statistically significant differences in the levels of HbA1c and blood glucose at 120 minutes in the OGTT (both greater in the SWL group). These 2 variables were significantly associated with a greater probability of SWL in the multiple binary logistic regression analysis, which also found an inverse association between SWL and use of school meal services (Table 3).
We did not find differences in the frequency of SWL or any significant associations with SWL for any of the other variables under study.
DiscussionThe results of our study show that some identifiable characteristics among the family and personal history, anthropometric and metabolic variables of the children and adolescents with obesity under study were associated with an increased probability of EA or weight loss, including substantial weight loss. Some of these factors were the severity of obesity, ethnicity and age at the time of intervention, also influenced by sex, metabolic status and family history of T2D.
There is previous evidence on the potential role of ethnicity as a predictor of EA in the management of childhood obesity, suggesting that patients of African and Latin American ancestry are at increased risk of EA and loss to follow-up compared to Caucasian patients, in association with educational, socioeconomic and/or behavioural differences.15–17 Our findings corroborate these observations, adding the lower proportion of patients of Latin American ancestry in the 5-year follow-up reinforced by the persistence of the association in the multiple logistic regression analysis. Some probable contributors to these differences are a lower awareness of obesity as a disease influenced by cultural and educational factors and potential difficulties in balancing work and family responsibilities with attendance to follow-up visits, which are exacerbated in the urban environment in which the study took place.16 One relevant finding in our study was the absence of differences in the proportions of TS and SWL between ethnic groups, which suggests that ethnicity in itself is not a limiting factor for successful treatment among patients who remain in follow-up, so more flexible follow-up strategies should be contemplated to prevent attrition in Latin American patients or patients of other ethnicities with particular socioeconomic and cultural characteristics.
In the absence of rare monogenic disorders or genetic syndromes causing obesity, compulsive eating (which was more prevalent in the EA group) is usually observed in adolescents, frequently in association with emotional disorders, described in up to 30% of these patients.18 This psychological determinant promotes the perpetuation of pathological intake patterns, which in turn is associated with a decreased frequency or degree of therapeutic success19 and a decreased likelihood of long-term weight loss maintenance.20 This, combined with the autonomy of adolescents compared to children,12 can contribute to the lower percentage of pubertal patients who achieve initial TS in our study, in agreement with the findings of previous studies.21
Similarly, the increased parental supervision of prescribed treatment could explain, at least in part, the higher proportion of younger (prepubertal) patients that achieve TS or remain in follow-up at 5 years compared to patients who have reached puberty. In this regard, it is possible that the change in dietary habits required to achieve SWL achieved through stricter parental control of intake contributed to the lower proportion of school meal service use found in this group of patients.
The higher proportion of male patients in the SWL group could be biased due to the higher proportion of male patients among the group of prepubertal patients in the cohort (approximately 60%),14 which may have had a confounding effect. However, there is evidence that programmes based on dietary and physical activity interventions may be more effective in male patients due to a more competitive attitude and greater involvement in sports.22
Our study supports that the severity of obesity may be one of the main predictors of TS at any time of follow-up, as described in previous studies,21,23 while contributing the novel finding that it may also be a predictor of substantial weight loss. This could be explained by an increased awareness of the disease on account of the greater deleterious impact on the quality of life and psychosocial wellbeing of the child the greater the severity of obesity. On the other hand, parental socioeconomic status or educational attainment, the importance attributed by the patient or the parents to obesity as a health problem and the willingness to change dietary or physical activity habits were not associated with remaining in follow-up or weight loss (as we had originally hypothesised). Notwithstanding, the potential impact of these variables should not be overlooked, given that the corresponding data were obtained by subjective self-reporting through direct questioning, which carries the possibility of response bias (toward what the physician may want, due to the awareness of being observed) with the subsequent inability to identify differences between patients accurately.
Another of our initial hypotheses was that the presence of metabolic abnormalities in the patients or parents could increase the awareness of the disease and result in greater adherence to follow-up and the received recommendations. The inverse association between the presence of T2D in the parents and EA in the multiple regression analyses supports this hypothesis, as did the observed HbA1c and blood glucose levels at 120 minutes in the OGTT (both of which were lower in the EA group and higher in the SWL group). These findings contribute new information to an area of knowledge that remains uncertain, as the current evidence on the association between the presence of metabolic abnormalities and the possibility and magnitude of weight loss is contradictory.24,25 The remaining differences in metabolic parameters observed in our study (lower baseline HOMA-IR in patients who remained in follow-up at 5 years and lower prevalence of abnormal lipid levels at baseline in patients who achieved TS in the first year) could be biased due to the greater proportion of prepubertal patients in both outcome groups due to physiological variation in triglyceride, lipoprotein and insulin levels throughout pubertal development and the lower prevalence of metabolic abnormalities associated with obesity in younger children.
Based on our findings, we may conclude that in the context of conservative management of childhood and adolescent obesity at the outpatient level, some of the characteristics of the patients can help predict an increased risk of early attrition or a greater probability of success (particularly the severity of obesity). Although the predictive value of these variables is limited, the planning of follow-up must be particularly careful in patients of Latin American ethnicity and patients with compulsive eating to try to reduce the frequency of early attrition, and in pubertal patients, especially in girls, in order to increase the frequency of therapeutic success.
FundingInstituto de Salud Carlos III, Madrid (Spain): Individual projects no. PI09/91060, PI10/00747, PI13/02195, PI16/00485, PI19/00166 and PI 22/01820 and CIBEROBN (Physiology of Obesity and Nutrition Biomedical Research Network Centre) Group CB06/03.
Conflicts of interestThe authors have no conflicts of interest to declare.
