


There is little information on the impact of mobile phone overuse (MPO) in areas in need of social transformation (ANST). Our objective was to estimate the prevalence of MPO in an ANST and its association with sleep disorders, academic performance and obesity.
Patients and methodsConsecutive sampling of patients aged 10–17 years who visited a primary care centre in an ARST between October 2019 and March 2020. The study involved performance of a clinical interview with collection of anthropometric, sociodemographic, mobile phone use and sleep data.
ResultsThe analysis included 214 participants. The prevalence of MPO during weekdays (more than 2 h a day) was 37.5% in children aged 10–12 years and 65.2% in 13- to 17-year-olds; in the weekend, the prevalence increased to 66.6% and 81.3%, respectively. In weekdays, MPO was associated with an increased prevalence of obesity, lower maternal educational attainment, greater difficulty waking up, daytime sleepiness and higher frequency of school failure. The adjusted risk was double for excess weight (odds ratio [OR] 1.90, 95% confidence interval [95% CI] 1.04–3.47), obesity (OR 2.45, 95% CI 1.23–4.89) and sleep disorders or sleep duration of less than 7 h (OR 2.26; 95% CI 1.31–3.92). Weekend MPO was associated with sleep disorders or sleep duration of less than 7 h (OR 2.68; 95% CI 1.40–5.11).
ConclusionsThe prevalence of mobile phone overuse is high in areas of social exclusion and is associated with sleep disorders, school failure and obesity.
Existe poca información del impacto del abuso del teléfono móvil (AM) en zonas con necesidad de transformación social (ZNTS). Nuestro objetivo es estimar la prevalencia de AM en ZNTS, y su asociación con problemas de sueño, rendimiento escolar y obesidad.
Pacientes y métodosMuestreo consecutivo de sujetos entre 10 y 17 años que acuden a consulta de atención primaria en ZNTS entre octubre 2019 y marzo de 2020. Realización de entrevista clínica, antropometría, datos sociodemográficos, de uso de móvil y sueño.
ResultadosSe estudiaron 214 sujetos. El AM durante la semana (más de 2 horas diarias), fue 37,5% en el grupo de 10−12 años y 65,2% en el grupo de 13 a 17 años; durante el fin de semana las prevalencias fueron 66,6% y 81,3%, respectivamente. El AM durante la semana se asoció a más obesidad; menor nivel de estudios maternos, mayor dificultad para despertarse, somnolencia diurna y mayor frecuencia de suspensos. El riesgo ajustado se duplica para sobrepeso u obesidad (odds ratio [OR] 1,90; intervalo de confianza del 95% [IC95%] 1,04 a 3,47), obesidad (OR 2,45; IC95% 1,23 a 4,89) y problemas de sueño o duración de sueño menor de 7 horas (OR 2,26; IC95% 1,31 a 3,92). El AM durante el fin de semana se asoció a problemas de sueño o duración menor de 7 horas (OR 2,68; IC95% 1,40 a 5,11).
ConclusionesExiste una alta prevalencia de abuso del móvil en zonas de exclusión social, que se asocia con problemas del sueño, suspensos escolares y obesidad.
The use of information and communication technologies (ICTs) has grown in recent years. The survey on ICT equipment and use in homes carried out by the Instituto Nacional de Estadística (National Institute of Statistics) of Spain showed that 97.5% of children aged 10–15 years had accessed the internet in the past 3 months, both from home and in other settings, and 68.7% had a mobile phone of their own.1
The impact of the ICT overuse is the subject of extensive research in the health care field. The criteria currently used to define whether the use of mobile phones and other electronic devices is excessive are heterogeneous. Several studies have applied a threshold of 2 h a day,2 although it is unlikely that screentime is the sole factor considered to determine risk. Other aspects, such as the increasing trend in ICT use, the use of screens in bedrooms and in the hours preceding bedtime, dependence and the time spent on social media may also affect the development of the child.
One of the lines of research that links technology overuse with child development is focused on the association with sleep disorders. Sleep plays an essential role in child and adolescent development, and sleep habits and disorders are among the aspects that paediatricians need to assess,3 as they may have a deleterious impact on development.4
The association between exposure to new technologies and obesity is one of the most documented aspects of the adverse effects of technology overuse,5–8 and obese children and adolescents have been found to be more likely to be addicted to the internet.6
There is a dearth of data on the impact of the exposure to mobile phones and other electronic devices with internet access in low-to-middle income families, and we found no study on the subject in our geographical area. Some studies have found an inverse relationship between sleep duration and obesity that is more marked in areas of low socioeconomic status,9 but there is little scientific evidence linking socioeconomic status with an increased frequency of risk factors for obesity poor sleep habits, one of which would be the use of mobile devices.7 Thus, establishing the prevalence of the use of ICTs in these high-risk populations and its impact on sleep quantity and quality, academic performance and obesity would be a relevant contribution.
Sample and methodsWe conducted a cross-sectional study in a paediatric sample (aged 10–17 years) selected from the caseloads of 2 primary care centres in Granada located in areas in need of social transformation (ANSTs) with catchment populations within the established age range of 1415 and 1795 inhabitants. The definition of ANST is an urban area where the population suffers both severe structural poverty and social exclusion.10
Participants were enrolled by consecutive sampling among those patients who made scheduled or on-demand visits to the primary care centre, who or whose parents had the ability to understand and answer questions in Spanish and who agreed to participate and provided informed consent in writing. We excluded patients with chronic neurosensory disorders. The study was approved by the Biomedical Research Ethics Committee of Andalusia. Responses to the survey were collected between October 1, 2019 and March 13, 2020.
The sample size calculation showed that a minimum of 92 participants were required to estimate the prevalence of mobile phone overuse (MPO) by age group with a precision of 10% (population of 1500 by age group, an expected prevalence of 0.50, precision of 0.10, 95% level of confidence) and a minimum of 219 to identify risk factors with an odds ratio (OR) of at least 2.4 (expected proportion exposed in the controls, 0.30; and ratio of expected subjects experiencing/not experiencing the effect of 0.50).
ProtocolWe developed a questionnaire to collect sociodemographic data and assess the use of mobile devices and sleep quality, including the items of the BEARS questionnaire.
The 22-item Children’s Sleep Habits Questionnaire (CSHQ) is a valid instrument that can identify the presence of sleep problems in school-age children.11 The screening version was published by Owens et al. (2005) and is known as the BEARS questionnaire (B = bedtime issues, E = excessive daytime sleepiness, A = night awakenings, R = regularity and duration of sleep, S = snoring).12 There is a validated version in Spanish of this scale.13,14 It does not yield quantitative scores, but rather identifies the presence of problems going to bed, excessive daytime somnolence, night awakenings, issues with sleep regularity and duration and snoring, and assesses bedtimes and sleep duration during the week and on weekends. We considered 8 h an adequate sleep duration, and 7 h the threshold to define risk.
The questionnaire included questions on the use of smartphones and other mobile devices. It included variables such as the time spent using the device, frequency of unlocking/picking the device, etc. We defined MPO as use of mobile devices of 2 h a day or more. We assessed the comprehension and reliability of the questionnaire in a pilot test on 20 subjects; the results were good, so no modifications were required.
The weight, height and waist circumference of each participant were measured at the time of the visit, based on which we calculated the body mass index (BMI), and waist-to-height ratio (WHtR).
The weight and height were measured with the scales and stadiometers available in the clinics, with the patient standing barefoot and their midline aligned with the midline of the stadiometer and the head held in the Frankfurt horizontal. The waist circumference was measured in cm with a non-stretching retractable tape measure, with the patient standing with the feet together and the arms hanging to the sides of the body, at the end of expiration, at the midpoint between the last rib and the iliac crest. We defined general obesity as a BMI above the 97th percentile based on the charts of the Fundación Orbegozo and central obesity as a WHtR of 0.5 or greater.15
Statistical analysisWe calculated frequency measures for discrete variables and measures of central tendency and dispersion for continuous variables by age group and sex. Prevalences were estimated with the corresponding 95% confidence intervals (CIs). We analysed the association of MPO with sleep problems and overweight/obesity. We assessed differences in discrete variables by means of the χ2 or Fisher exact test, and differences in quantitative variables by means of the Student t test or the Mann-Whitney U test, depending on the distribution of the data.
We fitted unconditional multivariate logistic regression models to estimate the risk of sleep problems or of overweight/obesity associated with MPO, adjusting for age, sex and maternal educational attainment. We excluded other variables to avoid problems related to colinearity. In the analysis of sleep problems, we defined 2 dependent variables corresponding to the detection of problems through items 1, 2, 3 or 5 of the BEARS questionnaire and a sleep duration of less than 7 h. The model was fitted through stepwise regression based on likelihood ratio changes.
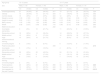
ResultsThe sample included 214 patients, 96 aged 10–12 years and 118 aged 13–17 years. Table 1 summarises the responses concerning mobile phone use by age group and sex; 83% of the younger age group (10−12 years) and 97% of the older age group (13−17 years) had a mobile phone of their own or had access to someone else’s phone. The prevalence of MPO during the week was 37.5% (95% CI, 31%–43.9%) in the group aged 10–12 years and 65.2% (95% CI 58.8 a 71.6%) in the group aged 13–17 years. The prevalence of MPO on weekends in these age groups was 66.6% (95% CI, 60.3%–72.9%) and 81.3% (95% CI, 76.1%–86.5%), respectively. Overall, we found a greater use of mobile phones, in terms of total duration of use and duration of use close to bedtime, on weekends and in the older age group. We found a longer time of use in female compared to male participants, although the difference was only significant during the weekend in the group aged 13–17 years and before bedtime in the group aged 10–12 years.
Use of mobile devices by age group and sex.
| Age group | 10−12 years | 13−17 years | ||||||||
|---|---|---|---|---|---|---|---|---|---|---|
| Sex | Male n = 50 | Female n = 46 | Male n = 48 | Female n = 70 | ||||||
| n/M | (%/IQR) | n/M | (%/IQR) | P | n/M | (%/IQR) | n/M | (%/IQR) | P | |
| Age (years) | 11.9 | (11.1−12.6) | 11.5 | (11.1−12.0) | .100 | 14.1 | (13.7−16.4) | 14.5 | (13.6−15.6) | .500 |
| Area in need of social transformation | 35 | (70%) | 37 | (80.4%) | .238 | 32 | (66.7%) | 43 | (61.4%) | .561 |
| Own mobile phone | 41 | (82%) | 39 | (84.8%) | .715 | 46 | (95.8%) | 69 | (98.6%) | .353 |
| Age first owned a mobile phone | 10.0 | (9.0−10.0) | 10.0 | (9.0;11.0) | .847 | 12.0 | (10.0−12.0) | 12.0 | (10.0−12.0) | .917 |
| Use of someone else’s mobile phone | 9 | (18%) | 7 | (15.2%) | 2 | (4.1%) | 1 | (1.4%) | ||
| Hours a day (during the week) | 1.8 | (0.5−3.0) | 2.0 | (1.0;4.0) | .077 | 3.0 | (1.5−6.0) | 4.0 | (2.0−6.0) | .416 |
| Hours a day (during the weekend) | 3.3 | (1.0−5.0) | 4.0 | (2.0;7.0) | .067 | 4.5 | (2.5−7.0) | 6.0 | (4.0−10.0) | .044 |
| Time phone is unlocked (minutes) | 30.0 | (20.0−240.0) | 17.5 | (6.5;30.0) | .005 | 15.0 | (5.0−42.0) | 10.0 | (5.0−30.0) | .497 |
| <10 min | 7 | (14.3%) | 14 | (32.6%) | .095 | 18 | (37.5%) | 27 | (38.6%) | .196 |
| 10−29.9 min | 13 | (26.5%) | 11 | (25.6%) | 9 | (18.8%) | 22 | (31.4%) | ||
| ≥30 min | 29 | (59.2%) | 18 | (41.9%) | 21 | (43.8%) | 21 | (30%) | ||
| Charges phone in bedroom nightly | 20 | (40%) | 26 | (56.5%) | .105 | 37 | (77.1%) | 48 | (68.6%) | .312 |
| Uses mobile phone before bedtime | 25 | (50%) | 31 | (67.4%) | .084 | 39 | (81.3%) | 54 | (77.1%) | .592 |
| Uses mobile phone 30 min before bedtime | 18 | (36%) | 26 | (56.5%) | .044 | 32 | (66.7%) | 50 | (71.4%) | .581 |
| Uses mobile phone in bed | 21 | (42%) | 24 | (52.2%) | .318 | 33 | (68.8%) | 47 | (67.1%) | .854 |
| Uses social media | 39 | (78%) | 39 | (84.8%) | .395 | 48 | (100%) | 66 | (94.3%) | .092 |
| Mobile phone overuse during the week | 16 | (32%) | 20 | (43.5%) | .246 | 30 | (62.5%) | 47 | (67.1%) | .603 |
| Mobile phone overuse during weekend | 30 | (60%) | 34 | (73.9%) | .149 | 36 | (75%) | 60 | (85.7%) | .142 |
IQR, interquartile range (25th–75th percentile); n, absolute frequency; M, median; min, minutes.
n/M: qualitative variables expressed as n, quantitative variables as M. %/IQR: qualitative variables summarised as percentages, quantitative variables as IQR.
Statistically significant differences are presented in boldface (P < .05).
The time that the phone was unlocked also showed a greater dependence in female participants, although the difference was only significant in the younger group.
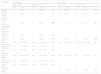
Table 2 summarises the demographic and family characteristics and somatometric data. We found a higher prevalence of excess weight in the group aged 10–12 years compared to the older age group, with a prevalence of obesity of 28.1% (95% CI, 22.1%–34.1%) versus 21.1% (95% CI, 15.7%–26.6%). The prevalence of excess weight (overweight or obesity) was 42.7% (95% CI, 36%–49.3%) versus 32.2% (95% CI, 25.9%–38.4%). We did not find differences in prevalence based on sex.
Sociodemographic and somatometric variables by age group and sex.
| Age group | 10−12 years | 13−17 years | ||||||||
|---|---|---|---|---|---|---|---|---|---|---|
| Sex | Male, n = 50 | Female, n = 46 | Male, n = 48 | Female, n = 70 | ||||||
| n/x̄ | (%/SD) | n/x̄ | (%/SD) | P | n/x̄ | (%/SD) | n/x̄ | (%/SD) | P | |
| Overweight/obesity | 21 | (42.9%) | 20 | (44.4%) | .877 | 13 | (27.1%) | 25 | (35.7%) | .324 |
| Obesity | 13 | (26.5%) | 14 | (31.1%) | .624 | 9 | (18.8%) | 16 | (22.9%) | .592 |
| Central obesity | 18 | (36%) | 17 | (37%) | .923 | 12 | (25%) | 18 | (25.7%) | .930 |
| Weight (z-score) | 1.09 | (1.52) | 1.13 | (1.72) | .883 | 0.50 | (1.64) | 0.90 | (1.87) | .284 |
| Height (z-score) | 0.52 | (1.01) | 0.20 | (0.99) | .161 | 0.12 | (0.96) | 0.14 | (1.03) | .772 |
| BMI (z-score) | 1.05 | (1.56) | 1.34 | (2.08) | .644 | 0.53 | (1.81) | 0.94 | (2.00) | .293 |
| WHtR | 0.48 | (0.07) | 0.48 | (0.08) | .716 | 0.46 | (0.10) | 0.46 | (0.09) | .695 |
| Maternal education | .222 | .302 | ||||||||
| Incomplete elementary | 3 | (6%) | 10 | (21.7%) | 11 | (23.4%) | 9 | (12.9%) | ||
| Elementary school | 18 | (36%) | 14 | (30.4%) | 14 | (29.8%) | 19 | (27.1%) | ||
| Middle school | 13 | (26%) | 8 | (17.4%) | 12 | (25.5%) | 19 | (27.1%) | ||
| High school/vocational training | 10 | (20%) | 10 | (21.7%) | 4 | (8.5%) | 15 | (21.4%) | ||
| University degree | 6 | (12%) | 4 | (8.7%) | 6 | (12.8%) | 8 | (11.4%) | ||
| Paternal education | .559 | .014 | ||||||||
| Incomplete elementary school | 5 | (10%) | 9 | (19.6%) | 4 | (8.5%) | 7 | (10%) | ||
| Elementary school | 26 | (52%) | 20 | (43.5%) | 24 | (51.1%) | 15 | (21.4%) | ||
| Middle school | 11 | (22%) | 8 | (17.4%) | 9 | (19.1%) | 29 | (41.4%) | ||
| High school/vocational training | 6 | (12%) | 5 | (10.9%) | 7 | (14.9%) | 15 | (21.4%) | ||
| University degree | 2 | (4%) | 4 | (8.7%) | 3 | (6.4%) | 4 | (5.7%) | ||
| Failed grade(s) | 23 | (46%) | 22 | (47.8%) | .858 | 33 | (68.8%) | 33 | (47.1%) | .020 |
| Repeated a year | 10 | (20%) | 11 | (23.9%) | .643 | 15 | (31.3%) | 12 | (17.1%) | .073 |
| Has repeated (in the past 3 years) | 15 | (33.3%) | 11 | (35.5%) | .846 | 20 | (55.6%) | 16 | (28.6%) | 0.010 |
BMI, body mass index; n, absolute frequency; SD standard deviation; WHtR, waist-to-height ratio; x̄, mean.
n/x̄: qualitative variables expressed as absolute frequencies, quantitative variables as mean. %/SD: percentage in the case of qualitative variables, standard deviation in the case of quantitative variables.
Statistically significant differences are presented in boldface (P < .05).
The parental educational attainment was secondary education or lower in 68% of mothers and 82% of fathers in the group aged 10–12 years and in 84% of mothers and 75% of fathers in the older group, without differences based on the sex of the patient, except in the paternal educational attainment in the older age group. We found a high frequency of failing grades and grade retention, significantly higher in male patients aged more than 13 years, among who 68.8% had failing grades and 55.6% had been held back a year in the past 3 years, compared to 47.1% and 28.6% of girls in the same age group.
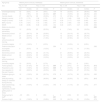
Table 3 summarises the responses to the sleep questionnaire. Up to 39.5% of the patients in the younger age group (95% CI, 33%–46.1%) and 40.6% in the older age group (95% CI, 34%–47.2%) reported difficulty waking up, feeling sleepy or tired during the day. The parents of 80% of boys and 69.6% of girls aged 10–12 years reported the respective participants did not sleep enough. The median duration of sleep during the week in children aged 10–12 years was 1 h shorter in boys compared to girls.
Sleep quantity and quality variables by age group and sex.
| Age group | 10−12 years | 13−17 years | ||||||||
|---|---|---|---|---|---|---|---|---|---|---|
| Sex | Male, n = 50 | Female, n = 46 | Male, n = 48 | Female, n = 70 | ||||||
| n/M | (%/IQR) | n/M | (%/IQR) | P | n/M | (%/IQR) | n/M | (%/IQR) | P | |
| Bedtime problems | 8 | (16%) | 8 | (17.4%) | 0.855 | 14 | (29.2%) | 15 | (21.7%) | 0.360 |
| Difficulty waking, sleepy or tired during the day | 21 | (42%) | 17 | (37%) | 0.614 | 17 | (35.4%) | 31 | (44.9%) | 0.304 |
| Night awakenings, sleepwalking, nightmares, trouble getting back to sleep | 7 | (14%) | 1 | (2.2%) | 0.036 | 8 | (16.7%) | 14 | (20.3%) | 0.622 |
| Not enough sleep | 40 | (80%) | 32 | (69.6%) | 0.238 | |||||
| Snoring at night | 11 | (22%) | 7 | (15.2%) | 0.395 | 5 | (10.6%) | 12 | (17.6%) | 0.298 |
| Bedtime, school nights | 23:00 | (22:30−0:00) | 23:00 | (22:30−0:00) | 0.565 | 0:00 | (23:00−1:00) | 23:30 | (23:00−0:30) | 0.379 |
| Waking time, school days | 8:00 | (7:15−8:00) | 8:00 | (7:15−8:29) | 0.172 | |||||
| Hours of sleep, weekdays | 9.00 | (8.75−9.67) | 9.67 | (8.25−9.75) | 0.299 | |||||
| Bedtime, weekend nights | 23:30 | (23:00−00:00) | 0:00 | (23:00−0:30) | 0.280 | 0:00 | (23:30−1:00) | 0:00 | (23:30−1:00) | 0.097 |
| Waking time, weekends | 9:59 | (9:00−11:00) | 11:00 | (9:59−12:00) | 0.060 | |||||
| Hours of sleep, weekends | 10.00 | (9.00−11:00) | 10.00 | (10.00−11:50) | 0.015 | |||||
| Hours of sleep | 8.0 | (7.0–8.8) | 8.0 | (7.0–8.5) | 0.953 | |||||
IQR, interquartile range (25th–75th percentile); n, absolute frequency; M, median; min, minutes.
n/M: qualitative variables expressed as n, quantitative variables as M. %/IQR: qualitative variables summarised as percentages, quantitative variables as IQR.
Statistically significant differences are presented in boldface (P < .05).
Table 4 presents the data on the association between the MPO variable and the rest of the variables. In the group of patients that abused the mobile phone, the prevalence of obesity was higher, the paternal and maternal educational attainment was lower, and the frequency of failing grades and repeating school years was higher. The association was statistically significant between of obesity and MPO overuse in weekdays, and between MPO overuse, both on weekdays and weekends, and maternal educational attainment, and academic performance.
Association between the “mobile phone overuse” variable and all other variables.
| Age group | Mobile phone overuse, weekdays | Mobile phone overuse, weekends | ||||||||
|---|---|---|---|---|---|---|---|---|---|---|
| Sex | No, n = 101 | Yes, n = 113 | No, n = 54 | Yes, n = 160 | ||||||
| n/x̄ | (%/SD) | n/x̄ | (%/SD) | P | n/x̄ | (%/SD) | n/x̄ | (%/SD) | P | |
| Overweight/obesity | 32 | (32%) | 47 | (42%) | .134 | 18 | (33.3%) | 61 | (38.6%) | .489 |
| Obesity | 18 | (18%) | 34 | (30.4%) | .037 | 10 | (18.5%) | 42 | (26.6%) | .234 |
| Central obesity | 27 | (26.7%) | 38 | (33.6%) | .273 | 15 | (27.8%) | 50 | (31.3%) | .631 |
| Weight (z-score) | 0.73 | (1.70) | 1.06 | (1.72) | .117 | 0.75 | (1.48) | 0.96 | (1.79) | .493 |
| Height (z-score) | 0.28 | (1.11) | 0.20 | (0.90) | .772 | 0.30 | (1.17) | 0.22 | (0.95) | .921 |
| BMI (z-score) | 0.74 | (1.87) | 1.15 | (1.90) | .077 | 0.75 | (1.60) | 1.03 | (1.98) | .525 |
| WHtR | 0.46 | (0.08) | 0.48 | (0.09) | .154 | 0.46 | (0.07) | 0.47 | (0.09) | .984 |
| Maternal education | .002 | .026 | ||||||||
| Incomplete elementary | 10 | (9.9%) | 23 | (20.5%) | 4 | (7.4%) | 29 | (18.2%) | ||
| Elementary school | 27 | (26.7%) | 38 | (33.9%) | 13 | (24.1%) | 52 | (32.7%) | ||
| Middle school | 21 | (20.8%) | 31 | (27.7%) | 12 | (22.2%) | 40 | (25.2%) | ||
| High school/vocational training | 26 | (25.7%) | 13 | (11.6%) | 15 | (27.8%) | 24 | (15.1%) | ||
| University degree | 17 | (16.8%) | 7 | (6.3%) | 10 | (18.5%) | 14 | (8.8%) | ||
| Paternal education | .094 | .096 | ||||||||
| Incomplete elementary | 9 | (8.9%) | 16 | (14.3%) | 6 | (11.1%) | 19 | (11.9%) | ||
| Elementary school | 39 | (38.6%) | 46 | (41.1%) | 21 | (38.9%) | 64 | (40.3%) | ||
| Middle school | 24 | (23.8%) | 33 | (29.5%) | 10 | (18.5%) | 47 | (29.6%) | ||
| High school/vocational training | 19 | (18.8%) | 14 | (12.5%) | 10 | (18.5%) | 23 | (14.5%) | ||
| University degree | 10 | (9.9%) | 3 | (2.7%) | 7 | (13%) | 6 | (3.8%) | ||
| Failed grade(s) | 42 | (41.6%) | 69 | (61.1%) | .004 | 20 | (37%) | 91 | (56.9%) | .012 |
| Repeated a year | 16 | (15.8%) | 32 | (28.3%) | .029 | 9 | (16.7%) | 39 | (24.4%) | .240 |
| Has repeated (in the past 3 years) | 22 | (28.9%) | 40 | (43.5%) | .052 | 15 | (34.9%) | 47 | (37.6%) | .750 |
| Problems going to sleep | 16 | (15.8%) | 29 | (25.7%) | .078 | 9 | (16.7%) | 36 | (22.5%) | .363 |
| Difficulty waking, sleepy or overtired during the day | 33 | (32.7%) | 53 | (46.9%) | .034 | 14 | (25.9%) | 72 | (45%) | .013 |
| Night awakenings, sleepwalking, nightmares, trouble getting back to sleep | 15 | (14.9%) | 15 | (13.3%) | .740 | 6 | (11.1%) | 24 | (15%) | .477 |
| Delays going to beda | −30 | (60) | 0 | (90) | < .001 | 0 | (120) | 30 | (120) | < .001 |
| Snores at night | 16 | (15.8%) | 19 | (16.8%) | .848 | 13 | (24.1%) | 22 | (13.8%) | .076 |
BMI, body mass index; n, absolute frequency; SD standard deviation; WHtR, waist-to-height ratio; x̄, mean.
n/x̄: qualitative variables expressed as absolute frequencies, quantitative variables as mean. %/SD: percentage in the case of qualitative variables, standard deviation in the case of quantitative variables.
Statistically significant differences are presented in boldface (P < .05).
When it came to sleep disorders, we found a significantly higher frequency of “Difficulty waking, sleepy or overtired during the day” and a later bedtime.
Lastly, Fig. 1 presents the results of the multivariate logistic regression analysis adjusted for sex, age and maternal educational attainment.
.")
We found that MPO during the week was associated with a statistically significant increase in the risk of overweight/obesity, with an adjusted OR (aOR) of 1.90 (95% CI, 1.04–3.47) as well as obesity (aOR, 2.45; 95% CI, 1.23–4.89), sleep problems (aOR, 2.10; 95% CI, 1.21–3.63) and sleep problems or sleep duration of less than 7 h (aOR, 2.26; 95% CI, 1.31–3.92). Mobile phone overuse during the weekend was also associated with sleep problems (aOR, 2.54; 95% CI, 1.33–4.85) and poor sleep quality or short sleep duration (aOR, 2.68; 95% CI, 1.40–5.11), but not obesity.
DiscussionOur results in the population of an ANST indicate a heavy use of mobile phones. In addition, this heavy use was associated with a reduced sleep quality and quantity and a greater prevalence of excess weight. We ought to highlight that most children had a mobile phone of their own and that 100% of the sample had access to a mobile phone, whether their own or that of a relative. Our findings suggest that at present, mobile phones are part of the daily life of every child. There was a high prevalence of MPO, both in terms of the number of hours of use and other parameters, such as nighttime use. The overuse was more severe in nearly every variable under study in the group aged 13–17 years, and in some variable, in female compared to male participants.
We found a high proportion of overweight and obesity in both age groups, higher in the group aged 10–12 years. In addition, the population under study was characterised by a high frequency of school failure, low parental educational attainment and a high prevalence of sleep problems.
Mobile phone overuse on weekdays doubled the risk of excess weight and of sleep problems. Similarly, in participants that used the mobile phone excessively on weekends, the risk of sleep problems increased by a factor of 2.54, the risk of poor sleep quality or duration increased by a factor of 2.68 and bedtime was delayed 30 min.
Our study is the first to quantify the risk of MPO in marginalised areas and the first to estimate the associated risk of obesity and sleep problems in Spain.
Our findings are consistent with the previous literature, despite our study having been conducted in a marginalised area. Bozkurt et al.6 found a higher prevalence of internet addiction in obese children and adolescents (24.6% vs 11.2%; P < .05). They applied the Internet Addiction Scale (IAS) and found that higher scores on the IAS and spending more than 21 h a week on the internet were significantly associated with a greater BMI in the obesity group. Tsitsika et al.7 conducted a study in a sample of 10 287 adolescents aged 14–17 years from 7 European countries and found that heavier use of social media was associated with an increased risk of overweight or obesity (OR = 1.26; 95% CI, 1.09–1.46). We did not find studies conducted in Spain with comparable estimates. A study on MPO in the paediatric population of Spain did not explore other associated factors.16
Sleep disorders are an increasingly frequent reason for medical visits17 and have an impact on both the child (irritability, decreased attention and concentration) and the quality of life of the siblings and family (sleep disturbances in siblings and parents, changes in parent-child-family dynamics).18 The association between the use of ICTs and sleep disorders is a growing field of research, and the evidence suggests a potential association between mobile phone use and later bedtimes and longer times to falling asleep.19,20 Previous studies have demonstrated the association between mobile phone and computer use in the bedroom with poor sleep habits, but have not established an association with insomnia.21,22 Others have found an association between the presence of a television or the use of small screens such as mobile phones in the sleep environment with insufficient sleep or rest.23
Falbe et al.23 conducted a study on 2048 schoolchildren and found that those who slept near a small screen reported 20.6 fewer minutes of sleep (95% CI, 229.7−211.4) and had a higher prevalence of perceived insufficient rest or sleep (prevalence ratio, 1.39; 95% CI, 1.21–1.60).
The use of mobile phones in bed is directly correlated to the presence of insomnia and disturbances in the circadian rhythm, and inversely correlated with the ability to get up early in the morning.24
The acquisition of appropriate and consistent sleep habits during adolescence is particularly important, as spending fewer than 8 h in bed on school nights is associated with difficulty falling asleep, daytime tiredness and reduced enjoyment of school.25 Nighttime texting has a significant impact on the time spent resting in bed and is associated with increased daytime tiredness.26
The results of our study evince the high risk of sleep problems in school-age children and adolescents that use mobile phones excessively, either during the week or on weekends. Since the use of ICTs may have a strong impact on sleep in adolescents, parental supervision is required to regulate the exposure of adolescents to electronic devices and diminish the deleterious effects of excessive screentime and internet overuse on sleep.27,28
There are limitations to our study. It was conducted on a non-random, consecutive sample of children and adolescents who visited the primary care centre, who may not have been representative of the entire population of the area. The sample size, while small, achieved the necessary precision to estimate the association between the variables under study. The fact that the study was conducted in an ANST precludes the generalization of its results to areas with different socioeconomic characteristics, but it also provides very valuable information on this social environment, on which the evidence to date has been scarce.
We ought to mention that the last interviews took place in March 2020, coinciding with the beginning of the SARS-CoV-2 pandemic, so it is not unreasonable to consider that the use of mobile technology, and therefore of any associated problems, may have increased. Thus, it would be useful to conduct additional studies to assess the impact of confinement and social distancing measures.
In conclusion, we found a high prevalence of MPO in the paediatric population residing in an ANST. Mobile phone overuse was associated with sleep problems, obesity, low maternal educational attainment and school failure. The magnitude of the association suggests that any intervention that targets obesity or sleep disorders should take mobile phone use into account.
FundingNo specific funding or grants have been awarded to this study by any institutions in the public, private or not-for-profit sectors.
Conflicts of interestThe authors have no conflicts of interest to declare.
Previous meeting: the study was presented as an oral communication with the title “Abuso de móvil y trastornos del sueño en zona de riesgo social” at the II Online Congress of the Asociación Española de Pediatría, June 3–5, 2021.
