

Several studies have shown the presence of fluorosis (DF) in primary dentition, suggesting an exposure to fluorides (F−) in early childhood. Breast milk is recommended as an exclusive food until 6 months of age. Although it is mentioned that only a small amount of F− can be eliminated by breast milk, studies have shown the presence of this element in milk of women living in contaminated areas, as well as in infant formulas. The objective of this project was to evaluate the exposure level to F− through milk in children living in an area with endemic hydrofluorosis.
MethodologyThe study included 110 children between 6 and 36 months of age from the municipality of Lagos de Moreno, Jalisco. Water samples were collected from the homes, as well as samples of milk (maternal, formula, whole or raw), and urine. Measurements were made with a selective ion electrode. The exposure level of F− for milk intake was calculated using the Oracle Crystal Ball package.
ResultsLevels greater than the reference level for DF were observed in infant formula reconstituted with public supply water, pasteurised cow's milk (whole) and untreated cow's milk treatment (raw) in the 90th, 70th, and 50th percentile, respectively, with a correlation being found between the levels of F− in milk and F− in urine (r=0.41, P<0.001).
ConclusionsThe identification of sources of F− in the early stages of child development could reduce the risk of developing DF.
Diversos estudios han demostrado la presencia de fluorosis (FD) en la dentición primaria, lo que puede indicar una exposición a los fluoruros (F−) en la primera infancia. La leche materna se recomienda como alimento exclusivo hasta los 6 meses de edad. Aunque se menciona que solo una pequeña cantidad de F− puede eliminarse por leche materna, estudios han demostrado la presencia de este elemento en leche de mujeres residentes de zonas contaminadas, así como en leche de fórmulas comerciales. El objetivo del proyecto fue evaluar la dosis de exposición a F− a través de leche en niños residentes de una zona con hidrofluorosis endémica.
MetodologíaUn total de 110 niños de entre 6 y 36 meses de edad del municipio de Lagos de Moreno, Jalisco, México, participaron en el estudio. Se colectaron muestras de agua de los hogares, leche y orina. Las muestras se cuantificaron con el electrodo de ion selectivo. Se calculó la dosis de exposición a F− a través del programa Oracle Crystal Ball.
ResultadosSe observaron dosis superiores a la dosis de referencia para FD en la leche de fórmula reconstituida con agua de abastecimiento público, de vaca pasteurizada (entera) y de vaca sin tratamiento sanitario (cruda) en el percentil 90, 70 y 50, respectivamente, así como una correlación entre los niveles de F− en leche y F− en orina (r=0,41; p<0,001).
ConclusionesLa identificación de fuentes de F− en etapas tempranas del desarrollo infantil podría reducir el riesgo de presentar FD.
Fluoride (F−) is one of the most ubiquitous natural inorganic pollutants in the drinking water supply worldwide.1 This ion is frequently found in geological structures where subterranean water flows.2 As a result, aquifers in many regions worldwide are naturally enriched with F− leading to drinking water supplies with concentrations that exceed the limit of 1.5mg/L3 established by the World Health Organisation.3
Several epidemiologic studies conducted in populations residing in areas with endemic fluorosis due to fluoride-rich water have found a negative impact of F– exposure on teeth.4–7 The paediatric population is most vulnerable to the effects of F− because tooth development starts during the foetal period.8 Recent studies have demonstrated that dental fluorosis (DF) can be found in the primary dentition,9–11 which may be indicative of prenatal and postnatal fluoride exposure.
In the first years of life, exclusive breastfeeding is recommended as the best form of nutrition for infants through age 6 months. Although there is evidence that only trace amounts of F− are eliminated in the breast milk,12 some studies have found this ion in the milk of women residing in areas with F− concentrations in water exceeding the limit recommended by the WHO.13 In some families, other types of milk are used in nutrition through age 2 years. Studies on infant and toddler formulas have shown that these can contribute to the intake of F− at early ages.14 This suggests that exposure to fluoride in early childhood could occur through milk, so the aim of our study was to assess exposure to F− through milk in children residing in a geographical area of Mexico with endemic fluorosis due to high water fluoride concentrations.
Materials and methodsStudy setting and sample selectionWe selected the town of Lagos de Moreno in Jalisco, Mexico, due to the history of high fluoride levels in water in the area (mean, 3.2mg/L; standard deviation [SD], 1.4).15 We obtained the necessary approval from the Department of Public Health (Secretaría de Salud, SSA). We gave talks in 4 clinics of the SSA system in Lagos de Moreno to introduce the project to mothers and explain the objectives, risks and benefits of the study. We included children aged 6 to 36 months whose mothers signed the informed consent form. The final sample included 110 children.
Sample collectionTo assess environmental and biological exposure to fluorides, we collected: (1) samples of tap water and bottled water in each household; (2) sample of whichever type of milk the child consumed, and (3) samples of the first morning urine in polypropylene bags or cups depending on the bladder control of the child. Samples were kept at 4°C until they were transported and analysed in the laboratory.
When it came to bottled water, households acquired water from 2 types of companies: (1) companies with a registered trademark and (2) companies without a registered trademark, corresponding to small businesses dedicated to water purification without the rigorous quality control involved in the production of bottled water for registered trademarks. As for the milk samples, the mothers reported feeding their children breast milk, commercial formula reconstituted with tap water or bottled water, pasteurised cow's milk (whole) or unpasteurised (raw) cow's milk.
Analysis of specimensTo measure the concentration of fluoride in samples of water, milk and urine, we took 10mL of each sample and added a 1:1 volume of total ionic strength adjustment buffer (TISAB). Milk and urine specimens had been previously treated with addition of 0.1g of EDTA per 100mL. The fluoride concentration was determined using the ion selective electrode method following protocol 8308 of the Instituto Nacional de Seguridad y Salud Ocupacional (National Institute of Occupational Safety and Health, NIOSH).16 In the analysis of urine samples, we used the IRIS Tech ClinCheck® Urine control lyophilised for trace elements for quality control17 and found a relative accuracy of 95%±2%.
Additional dataWe administered questionnaires to the mothers to obtain additional information, such as the age of the child, the daily intake of milk, the type of milk consumed, the brand of bottled water consumed in the household and whether the brand was or not a registered trademark. We also measured the weight and height of the children at the clinics.
Calculation of fluoride intake through milk consumptionTo calculate the dose of exposure, we used the measured F− levels in milk (breast milk, formula, whole pasteurised or raw cow's milk), the body weight (BW) and daily intake (DI) by age group (6–12 months, 13–24 months, 25–36 months). We used a Monte Carlo simulation model developed with the software Oracle Crystal Ball version 11.118 and using the following equation:
where [F–] is the concentration of F− in milk in mg/L, BW for body weight in kg, DI for daily intake in L/day, and AF for absorption factor, which in this case we established at 0.9 based on the findings of animal model studies.19Statistical analysis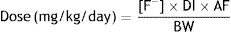
We conducted a descriptive and inferential analysis of the variables under study. We transformed the values of the F− concentration in water, milk and urine to a logarithmic scale. We classified children into 3 age categories (6–12 months, 13–24 months and 25–36 months). We compared the detected concentrations of F− in the drinking water supply to the threshold of 1.5mg/L established in regulation NOM-127-SSA1-1994 for water for human use and consumption. When it came to bottled water, we compared the obtained values to the threshold established in regulation NOM-201-SSA1-2002. This regulation allows levels of up to 0.7mg/L, the concentration currently recommended by organisations such as the American Dental Association (ADA) to prevent DF.20 We found no threshold or recommendations for the concentration of F− in milk, but since this is a fluid for human consumption, we applied the same threshold values of 0.7mg/L and 1.5mg/L. We performed bivariate analyses calculating the Pearson correlation coefficient. We defined statistical significance as a p-value of less than 0.05 (two-tailed tests). We performed all the statistical analyses with the software SPSS version 20 (SPSS Inc., Chicago, IL, United States).
ResultsWe analysed 110 samples of milk consumed by children aged 6 to 34 months residents in the area with high water fluoride concentrations. Table 1 presents the general characteristics of the children as well as the types of milk consumed and the proportions of children that consumed them. The body weights of participants ranged from 4.5 and 15.5kg, and the height between 55 and 100cm. The mean daily water intake in the sample was 0.46L (0.1–1.5L). Of all children, 17% consumed breast milk, 42.7% artificial formula, 24.5% pasteurised whole cow's milk and 15.5% raw cow's milk.
General characteristics of the children, type of milk and proportion of children consuming it.
| Variable | n | Mean | Standard deviation | Minimum | Maximum |
|---|---|---|---|---|---|
| Age (months) | 110 | 16.9 | 7.3 | 6 | 34 |
| Weight (kg) | 110 | 10.6 | 2.4 | 4.5 | 15.5 |
| Height (cm) | 110 | 78 | 10.4 | 55 | 100 |
| Daily milk intake (L) | 110 | 0.46 | 0.29 | 0.1 | 1.5 |
| Type of milk | n | Proportion (%) |
|---|---|---|
| Breast milk | 19 | 17.3 |
| Infant formula reconstituted with water out of the tap or bottled water | 47 | 42.7 |
| Pasteurised milk (whole) | 27 | 24.5 |
| Untreated cow's milk (raw) | 17 | 15.5 |
Table 2 presents the mean concentrations of F− in water, milk and urine. We found that 86.4% of the tap water specimens exceeded the regulation threshold of 1.5mg/L. When it came to the bottled water samples, we found that 16.9% and 5.6% of the samples from registered trademark companies exceeded the 0.7 and 1.5mg/L thresholds, respectively, while 45.7% and 14.3% of the samples from bottlers without a registered trademark exceeded the same thresholds.
Mean fluoride concentrations in samples of water, milk and urine (mg/L).
| n | Fluoride concentration (mg/L) | % >0.7a | % >1.5b | ||||
|---|---|---|---|---|---|---|---|
| Mean | Standard deviation | Minimum | Maximum | ||||
| Tap water | 110 | 3.8 | 2.1 | 0.1 | 11.0 | 90.9 | 86.4 |
| Bottled water with registered trademark | 71 | 0.4 | 0.4 | 0.4 | 2.0 | 16.9 | 5.6 |
| Bottled water without registered trademark | 35 | 0.7 | 0.5 | 0.1 | 2.0 | 45.7 | 14.3 |
| Breast milk | 19 | 0.4 | 0.4 | 0.1 | 0.9 | 21.1 | 0 |
| Artificial formula reconstituted with tap or bottled water | 47 | 0.9 | 0.8 | 0.2 | 3.9 | 55.3 | 10.6 |
| Pasteurised whole milk | 27 | 0.9 | 0.5 | 0.1 | 2.0 | 63 | 17.9 |
| Untreated (raw) cow's milk | 17 | 1.6 | 1.7 | 0.3 | 5.0 | 64.7 | 31.2 |
| n | Mean | Standard deviation | Percentile | Referencec | % >reference | ||||
|---|---|---|---|---|---|---|---|---|---|
| 25 | 50 | 70 | 90 | ||||||
| Urine (mg/L) | 110 | 1.8 | 1.8 | 0.5 | 1.3 | 2.0 | 4.0 | 1mg/L | 62 |
As for the F− concentration in milk, we found that breast milk had the lowest levels with a mean of 0.4mg/L (SD, 0.4) compared to formula (mean, 0.9mg/L; SD, 0.8), whole cow's milk (mean, 0.9mg/L; SD, 0.5) and raw cow's milk (mean, 1.6mg/L; SD, 1.7). The proportion of samples that exceeded the 0.7mg/L threshold was 21.1% for breast milk, 55.3% for artificial formula, 63% for pasteurised whole milk and 64.7% for raw cow's milk. When we applied the 1.5mg/L threshold, none of the breast milk samples exceeded it, compared to 10.6% of formula samples, 17.9% of pasteurised whole milk samples and 31.2% of raw cow's milk samples.
The mean concentration of F− in urine sample was 1.8±1.8mg/L; and in 62% values exceeded 1.0mg/L, the average reported in school-aged children living in areas with endemic fluorosis due to high water F− concentrations.21
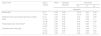
Last of all, Table 3 presents the F− intake through consumption of milk by age group. The Agency for Toxic Substances and Disease Registry (ATSDR) established a reference dose (RfD) of 0.06mg of F−/kg/day at which DF may develop.7 We found doses that neared and even exceeded the RfD at the 90th percentile for formula, at the 70th percentile for pasteurised whole cow's milk and at the 50th percentile for raw cow's milk.
Dose of fluoride (mg/kg/day) received through consumption of breast milk, artificial formula, pasteurised whole cow's milk and untreated (raw) cow's milk.
| Type of milk | Age in months | Mean | Standard deviation | Percentile | ||
|---|---|---|---|---|---|---|
| 50 | 70 | 90 | ||||
| mg/kg/day | ||||||
| Breast milka | 6–12 | 0.02 | 0.02 | 0.012 | 0.02 | 0.04 |
| 13–24 | 0.02 | 0.03 | 0.015 | 0.03 | 0.05 | |
| Artificial formula reconstituted with tap or bottled water | 6–12 | 0.04 | 0.06 | 0.03 | 0.05 | 0.09 |
| 13–24 | 0.05 | 0.05 | 0.03 | 0.06 | 0.11 | |
| 25–36 | 0.05 | 0.05 | 0.03 | 0.05 | 0.09 | |
| Pasteurised cow's milk (whole)a | 13–24 | 0.05 | 0.04 | 0.04 | 0.06 | 0.1 |
| 25–36 | 0.05 | 0.04 | 0.04 | 0.06 | 0.09 | |
| Untreated cow's milk (raw) | 6–12 | 0.08 | 0.09 | 0.05 | 0.08 | 0.17 |
| 13–24 | 0.09 | 0.09 | 0.06 | 0.09 | 0.20 | |
| 25–36 | 0.09 | 0.11 | 0.06 | 0.09 | 0.19 | |
Concentration of F− in milk expressed as mean and standard deviation in mg/L (logarithmic distribution: breast milk 0.4±0.4, formula 0.9±0.8, pasteurised whole milk 0.9±0.5, raw cow's milk 1.6±1.7). Body weight expressed in kg (normal distribution: age 6–12 months 8.8±1.7; 13–24 months 10.9±2.0; 25–36 months 12.8±1.6). Daily intake expressed as L/day (range [minimum–maximum]: age 6–12 months 0.1–1; 13–24 months 0.1–1.5; 25–36 months 0.25–1.5). Oral exposure factor (single value: 0.97). Number of simulations: 10,000.
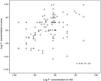
We found a statistically significant correlation (Pearson) between the F− concentration in milk (logarithmic scale) and the F− concentration in urine (logarithmic scale) (r=0.41; P<0.001). The correlation remained statistically significant after adjusting for age (r=0.39; P<0.001; Fig. 1).
Discussion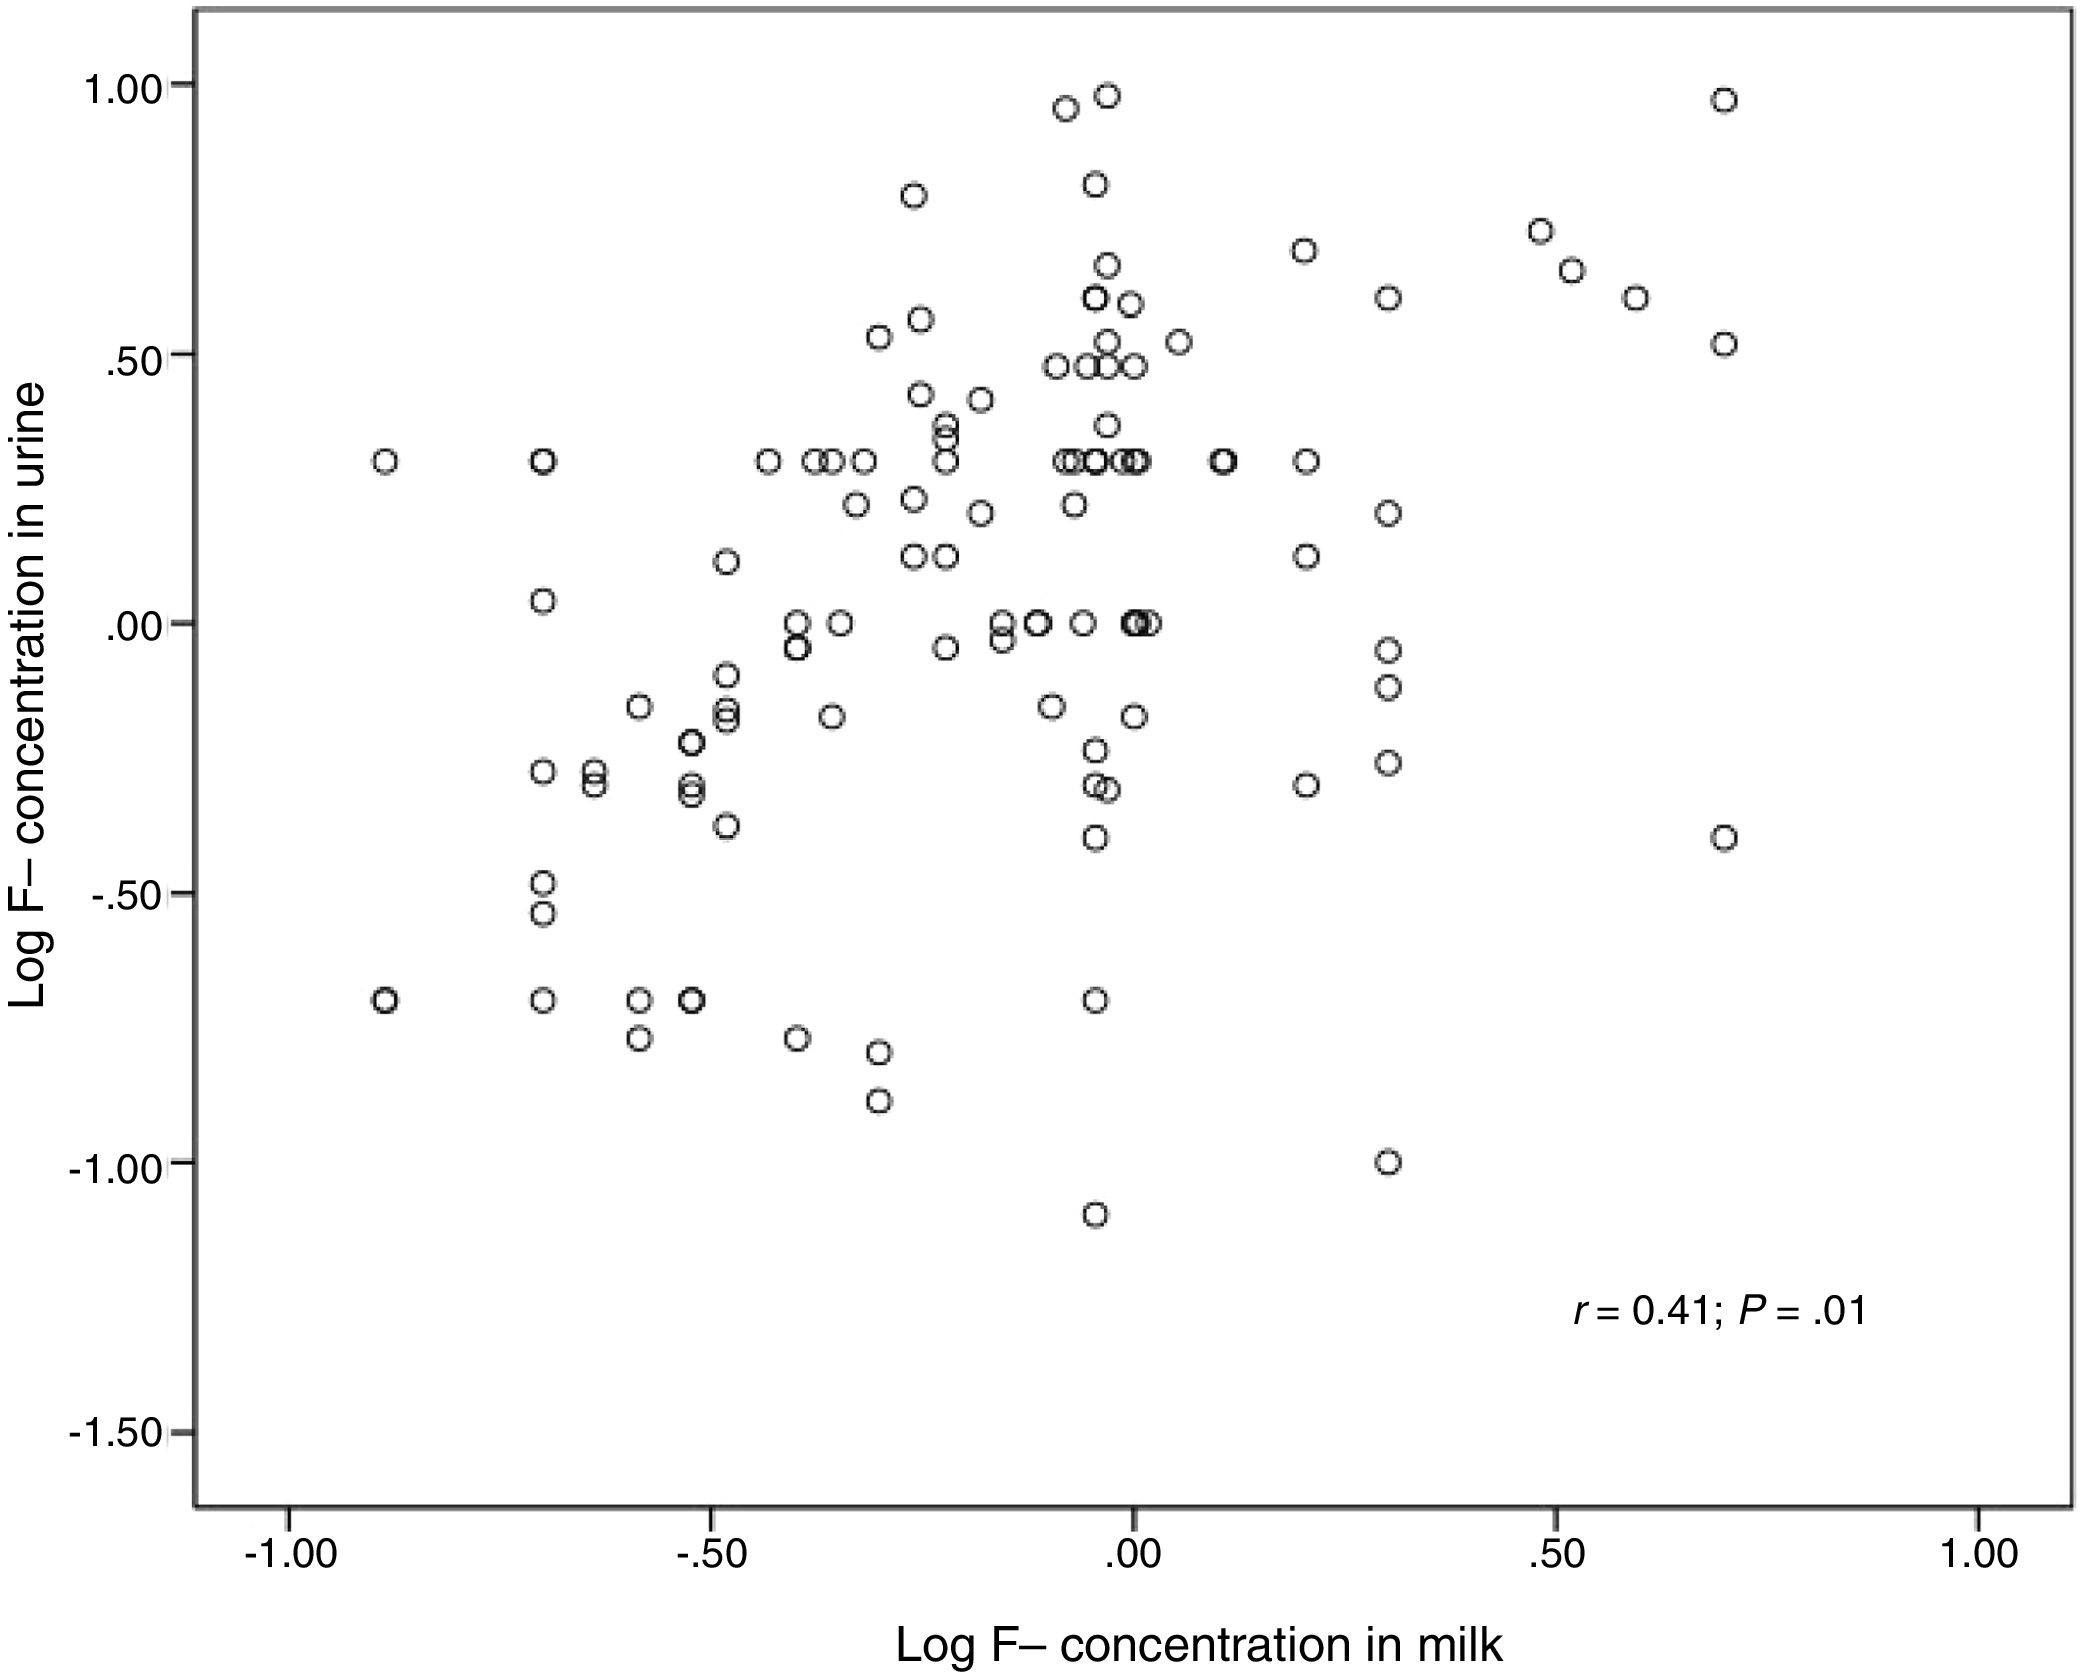
The impact on children's health of prolonged exposure to F− depends largely on the daily intake of F– from contaminated water or foods.
We found that 86.4% of the samples of water in the households included in the study exceeded the 1.5mg/L limit established in regulation NOM-127-SSA1-1994. These results were consistent with the findings of Hurtado-Jiménez and Gardea-Torresdey in Lagos de Moreno in 2005 (3.2±1.4mg/L compared to 3.8±2.1mg/L in our study).15 Some of the towns in this region have water fluoride levels that are up to 10-fold the limit established in regulation NOM-127.22 We also analysed bottled water samples as a potential additional source of F−, as previous studies have demonstrated that bottled water does not always meet quality standards.23 In our study, 16.9% of bottled water samples from registered brands exceeded the NOM-201-SSA1-2002 limit of 1.5mg/L. The proportion of samples of bottled water without a registered trademark that exceeded the NOM-201 threshold was greater (45.7%).
The type of milk that had the lowest F− levels was breast milk, with a mean concentration of 0.4mg/L (SD, 0.4). We found concentrations greater than 0.7mg/L in 21.1% of breast milk samples, but none of the samples exceeded 1mg/L. These findings are consistent with the evidence in the literature, according to which only very small amounts of F− are eliminated in breast milk. To demonstrate this, Sener et al. measured the levels of F− in plasma and milk of lactating mothers, and found that the levels of F− were lower in breast milk compared to plasma (0.006mg/L vs 0.017mg/L); they also found a correlation between the levels of F− in plasma and in breast milk, which showed that while the amounts of F− passed to the milk are small, the transfer does occur.24 Faraji et al. found a similar correlation between the levels of F− in the milk of lactating women and the levels of F− in the water they consumed (r=0.65; P=0.002).25 It is worth noting that the levels of F− that the women in these studies were exposed to, ranged from 0.3 to 0.5mg/L, so it would be fair to assume that the concentration of F− in breast milk is higher in areas with polluted water. Poureslami et al. measured the levels of F− in the breast milk of women with DF and found a mean concentration of 0.55mg/L (SD, 0.25). The control group in this study consisted of women without DF, whose breast milk had lower levels of F− (mean, 0.006mg/L; SD, 0.003), which demonstrated that F− concentrations may be greater in the breast milk of women exposed to this ion.13 When it came to formula, our study found levels above 0.7mg/L in 55.3% of the specimens and above 1.5mg/L in 10.6% of the specimens. The formulas tested in our study were prepared as they were usually prepared in the households of each of the participants. Of all mothers, 83.7% reported preparing formula with bottled water, which could explain the high percentage of formula specimens that had F− concentrations above 0.7mg/L. In Mexico, there is no published evidence on the levels of F− in artificial formula. A study conducted in Brazil reported that out of 15 commercial brands prepared with distilled water, 2 exceeded the 0.7mg/L threshold.14 We ought to highlight that in our study both pasteurised whole cow's milk and raw cow's milk frequently exceeded the established thresholds, with 63% and 64.7%, respectively, exceeding the 0.7mg/L threshold and 17.9% and 31.2% the 1.5mg/L threshold. Considering the low amounts of F− that are eliminated in milk and that milk should not come in contact with water during the manufacturing process, this suggests the possibility that water that does not meet the quality criteria for drinking water bottled in adherence to the NOM-127 and NOM-201 regulations is being added to the milk.
When it comes to fluoride levels in urine, there is no regulation on environmental exposure in relation to this variable, but only regulations concerning occupational exposure. The American Conference of Governmental Industrial Hygienists (ACGIH) of the United States has proposed a biological exposure index (BEI) for fluoride in urine of 2mg/L,26 while the NOM-047-SSA1-2011 has established a BEI of 3mg/L (both prior to shift). When it comes to the paediatric population, a study conducted in children residing in an area with water fluoride levels of less than 1mg/L found concentrations in urine of 1mg/L.17 In our study, 62% had concentrations above 1mg/L. The levels of F− in urine increased from age 1.5 years (2.1mg/L vs 1.6mg/L, P<0.05). In children, the risk of exposure to F− increases with age as they stop consuming breast milk and start consuming artificial formula, cow's milk or water, in addition to foods prepared in the home. Previous data published by our working group for the town of Lagos de Moreno shows that 64.5% of households still use tap water for cooking.22 We ought to highlight that we found a F− concentration of 4.5mg/L in the urine of an infant aged 6 months whose mother prepared his formula with tap water.
Knowledge of the sources and doses of exposure to F− is of vital importance during the early stages of development, as fluoride is integrated in the teeth before they erupt,27 increasing the risk of DF in the paediatric population. We were able to calculate a probability distribution for the dose of exposure using data obtained from our sample with the Oracle Crystal Ball software, which should approximate real values. When it came to the intake from breast milk found in our study, none of the doses calculated based on the samples exceeded the 0.06mg/kg/day RfD established by the ATSDR. The average dose amounted to one third of the RfD. The doses obtained through consumption of artificial formula, pasteurised cow's milk and raw cow's milk exceeded the RfD from the 90th, 70th and 50th percentiles, respectively. These results suggest that the paediatric population of the region is at risk. Thus, 10% of children consuming formula reconstituted with tap water or water bottled with poor quality assurance processes, 30% of children consuming pasteurised whole cow's milk and 50% of children consuming untreated, raw cow's milk could develop DF in the primary dentition. Furthermore, we found a correlation between the concentration of F− in milk and the concentration of F− in urine, which supports the hypothesis that exposure to fluorides at these ages could be due to ingestion of contaminated milk (r=0.41; P<0.001).
The presence of DF in the primary dentition of children residing in areas with high fluoride concentrations in water has already been documented in the literature.9–11 Levy et al. found an association between different periods of exposure to F− and the prevalence of DF in the primary dentition. This association was strongest in infants aged 6–9 months (P<0.001).11 A study conducted in Mexico that investigated the presence of DF in the primary teeth of children aged 3–6 years found that its prevalence increased with increasing concentrations of fluorides in the water supply (0–1.2mg/L, FD 66.2%; 1.3 and 3mg/L, FD 81.3%; >3mg/L, FD 92.3%).28
Dental associations in different parts of the world recommend the use of F− for prevention and control of tooth decay in children, determining the use of F− by balancing the risk of tooth decay and the risks associated to the toxic effects of fluorides.29 When it comes to fluoridated water, European dental associations recommend concentrations of fluoride between 0.3 and 0.6mg/L as optimal for prevention of both tooth decay and DF (with these levels in water, further exposure to F− other than through tooth paste is not recommended in children aged 2–3 years).30 In Mexico, regulation NOM-013-SSA2-1994 recommends fluoride supplementation in children that for health reasons do not consume fluoridated salt and live in areas where the concentration of F− in drinking water is less than 0.7mg/L.
The identification of sources of F− in addition to drinking water during early child development may reduce the risk of DF and other unfavourable outcomes in the future.22,30 Breast milk continues to be the optimal food for infant development in areas with high F− levels in water, as it provides the best nutrition and reduces the risk of exposure to this pollutant. It is also important to ascertain the quality of the dairy or nutritional products in which water is used in the manufacturing process, especially those produced in geographical areas where the water is known to contain pollutants.
Conflicts of interestThe authors have no conflicts of interest to declare.
This study was carried out during the second year of the postdoctoral fellowship of the first author (Conacyt grant no. 239404).
Please cite this article as: Valdez Jiménez L, Calderón Hernández J, Córdova Atilano RI, Sandoval Aguilar SY, Alegría Torres JA, Costilla Salazar R, et al. Dosis de exposición a fluoruros por el consumo de diferentes tipos de leche en residentes de una zona con hidrofluorosis endémica en México. An Pediatr (Brac). 2019;90:342–348.
Previous presentation: This study was presented at the XV Encuentro Participación de la Mujer en la Ciencia; May 23–25, 2018; León, Guanajuato, Mexico.

Anales de Pediatría (English Edition) follows the Recommendations for the Conduct, Reporting, Editing and Publication of Scholarly Work in Medical Journals