


To estimate the frequency of patients with diagnoses associated with life-limiting conditions (LLCs) or complex chronic conditions (CCCs).
MethodsRetrospective mixed population-based and hospital-based cohort study. Study universe consisted of the population aged less than 18 years of an autonomous community in Spain in the 2001–2021 period; the cases were patients admitted to hospital with a diagnosis associated with LLC or CCC during this period. We estimated age-adjusted annual prevalences and analysed changes in trends using joinpoint regression.
ResultsThe prevalence of LLCs increased significantly from 20.7 per 10 000 inhabitants under 18 years in 2001 to 51.3 per 10 000 in 2019. There was also a significant increase in CCCs from 39.9 per 10 000 in 2001 to 54.4 per 10 000 in 2019. The prevalence of patients with any of these conditions rose from 45 per 10 000 in 2001 to 86.8 per 10 000 in 2019; 30.3% of these patients had conditions of both types. There was a turning point in this increasing trend between 2019 and 2020, coinciding with the COVID-19 pandemic.
ConclusionsThe prevalence of patients requiring specialized care has increased progressively in the last 20 years, similar to what has happened in other countries. The magnitude of the affected population must be taken into account when planning specialized paediatric palliative care and complex chronic care services.
Estimar la frecuencia de pacientes con diagnósticos asociados a condiciones limitantes para la vida (CLV) o condiciones crónicas complejas (CCC).
MétodosEstudio retrospectivo de cohortes de base mixta poblacional-hospitalaria. La población de estudio fue la población menor de 18 años de una comunidad autónoma española desde 2001 a 2021. Los casos fueron los pacientes con algún ingreso hospitalario con algún diagnóstico asociado a CLV o CCC. Estimamos las prevalencias anuales ajustadas por edad y los cambios de tendencia mediante regresión de Joinpoint.
ResultadosLa prevalencia de CLV ascendió de forma significativa desde un 20,7 por 10 000 en 2001 hasta un 51,3 por 10 000 en 2019. Para CCC también ha tenido lugar un aumento significativo desde un 39,9 por 10 000 en 2001 a un 54,4 por 10 000 en 2019. Las prevalencias de pacientes con alguna de estas condiciones ascendieron desde un 45 por 10 000 en 2001 hasta un 86,8 por 10 000 en 2019; un 30,3% de pacientes tenían ambas condiciones. Se produjo un punto de inflexión en esa tendencia creciente entre 2019 y 2020, coincidiendo con la pandemia COVID-19.
ConclusionesLa prevalencia de pacientes subsidiarios de precisar cuidados especiales ha ascendido progresivamente en los últimos 20 años, de forma similar a como ha ocurrido en otros países. La magnitud de la población afectada ha de ser tenida en cuenta para la planificación de servicios especializados pediátricos de cuidados paliativos y crónicos complejos.

The World Health Organization recommends initiation of paediatric palliative care (PPC) at the time of diagnosis and to continue providing this care independently of the treatment received by the patient.1 This means that children and their families may require care and support for a prolonged period of time.2 To be able to plan care delivery for these patients, the prevalence of conditions requiring PPC needs to be established. Current estimations of the frequency of paediatric patients eligible for palliative care vary widely between countries and health care systems, ranging from 20 to 120 per 10 000 inhabitants.3 In addition, there seems to be a progressively increasing trend in frequency in developed countries.4
Estimating the number of children that may benefit from PPC is complicated. Limiting the calculation to those patients with eligible diagnoses recorded in death certificates may underestimate the number that truly need PPC.5 In the United Kingdom and other countries, the terms life-limiting condition and life-threatening condition are used to describe the paediatric patients who may benefit from PPC.6,7 Life-limiting conditions are those for which there is no cure and associated with a high probability of death in childhood or adolescence.8 Life-threatening conditions are those for which curative treatment is available but may fail, such as cancer, and other irreversible chronic progressive or nonprogressive conditions.8
Other patients that may be eligible for PPC are patients with chronic complex conditions (CCCs),9 who require special care whether or not they have a life-threatening or life-limiting (LLC). Chronic complex condition is defined as any medical condition expected to last a minimum of 12 months (unless the patient dies first), involving one or more organs or systems with sufficient severity that it requires admission to a tertiary care hospital.10 These conditions are usually considered in planning PPC services and may be managed by specialised care units that may also manage patients requiring PPC or with LLCs.
Different directories of diagnoses related to both LLCs11 and CCCs10 have been used to calculate the size of the population with these special needs. In the United Kingdom, lists of diagnostic codes associated with LLCs have been developed based on the diagnoses of patients managed in PPC units and documented in death records7,11; these lists have been updated at different times and are currently available for the International Classification of Diseases, 10th Revision (ICD-10).4 In the United States, a list of codes associated with CCCs was developed based on the diagnoses documented in cases involving a high use of resources and of congenital malformations, initially developed for the International Classification of Diseases, 9th Revision–Clinical Modification (ICD-9CM), for which a translation to equivalent ICD-10 codes is available.10 We ought to mention that this inventory of conditions has been applied to estimate health care costs in the updated national PPC clinical practice guideline in Spain.12
Such lists may be useful to know the size and characteristics of the population with LLCs or CCCs and adequately plan health care delivery for these individuals. They can also help identify patients early, facilitating early admission to PPC programmes and therefore improving clinical outcomes and quality of life.
The objective of our study was to estimate the frequency of patients with diagnoses associated with LLCs or CCCs using the lists of codes currently available for these types of conditions based on hospital admission data for the autonomous community of Castilla y León (Spain) over a 21-year period. The secondary objectives were to assess changes in temporal trends and identify factors associated with these changes, overall, by age group and by diagnostic category.
MethodsWe conducted a mixed population- and hospital-based retrospective cohort study. The study universe consisted of the population aged less than 18 years in the autonomous community of Castilla y León in the 2001–2021 period based on data from the Instituto Nacional de Estadística (National Institute of Statistics of Spain). Cases were patients who resided in the autonomous community admitted to hospital in the years under study whose discharge summary included at least 1 diagnostic code associated with an LLC or CCC.
Data were collected by searching the Minimum Basic Hospital Discharge Dataset (hospital discharge summary) database of the regional health system, which allows a maximum of 15 diagnostic codes per patient. The system used ICD-9CM codes until 2015 and ICD-10 codes thereafter. We searched the database for diagnostic codes associated with LLCs (Fraser et al. list)4 and CCCs (Feudtner et al. list),10 applying the equivalent codes for the ICD-9CM and ICD-10 obtained by mapping.
We collected and analysed data for these diagnoses, overall and grouped by major diagnostic category, the date (year), age, sex and type of setting (rural vs urban). Patients could have more than one LLC or CCC, and we did not give a different weight to any of the eligible conditions. We estimated the annual prevalence of patients with LLCs, CCCs and both combined, adjusted for age based on the European standard population of 2013,13 with the corresponding 95% confidence intervals (CIs), assuming a Poisson distribution.
We analysed changes in trends by means of Joinpoint regression (Joinpoint Trend Analysis software of the National Cancer Institute), which estimates the annual percent change by period and the inflection points between periods.
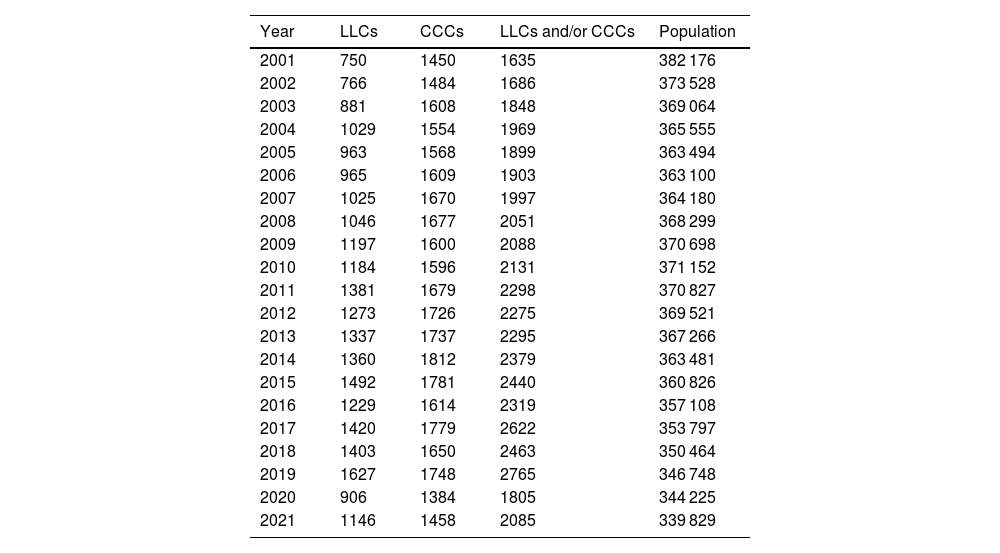
ResultsBetween 2001 and 2021, 61 498 admissions with a diagnosis associated with LLCs or CCCs were documented in the health records database of the health system of the autonomous community. We found an increasing trend in the annual frequency of admissions from 2001, with 2207 admissions/year, to 2019, with 3803 admissions/year (median, 2841 admissions/year; interquartile range [IQR], 2622–3168). This increase corresponded to an increase in prevalent cases per year from 1635 patients/year in 2001 to 2765 patients/year in 2019 (median, 2088 patients/year; IQR, 1903–2319). In 2020, there was an inflection point with a concave down shape in the trend, with no significant changes thereafter. Table 1 presents the absolute frequencies of patients with LLCs, with CCCs and with an LLC and/or a CCC. Of all prevalent cases, 30.3% (13 611 out of 44 953) simultaneously had both types of condition.
Annual distribution of prevalent cases of life-limiting conditions, chronic complex conditions and their combination, and size of reference population (age < 18 years).
| Year | LLCs | CCCs | LLCs and/or CCCs | Population |
|---|---|---|---|---|
| 2001 | 750 | 1450 | 1635 | 382 176 |
| 2002 | 766 | 1484 | 1686 | 373 528 |
| 2003 | 881 | 1608 | 1848 | 369 064 |
| 2004 | 1029 | 1554 | 1969 | 365 555 |
| 2005 | 963 | 1568 | 1899 | 363 494 |
| 2006 | 965 | 1609 | 1903 | 363 100 |
| 2007 | 1025 | 1670 | 1997 | 364 180 |
| 2008 | 1046 | 1677 | 2051 | 368 299 |
| 2009 | 1197 | 1600 | 2088 | 370 698 |
| 2010 | 1184 | 1596 | 2131 | 371 152 |
| 2011 | 1381 | 1679 | 2298 | 370 827 |
| 2012 | 1273 | 1726 | 2275 | 369 521 |
| 2013 | 1337 | 1737 | 2295 | 367 266 |
| 2014 | 1360 | 1812 | 2379 | 363 481 |
| 2015 | 1492 | 1781 | 2440 | 360 826 |
| 2016 | 1229 | 1614 | 2319 | 357 108 |
| 2017 | 1420 | 1779 | 2622 | 353 797 |
| 2018 | 1403 | 1650 | 2463 | 350 464 |
| 2019 | 1627 | 1748 | 2765 | 346 748 |
| 2020 | 906 | 1384 | 1805 | 344 225 |
| 2021 | 1146 | 1458 | 2085 | 339 829 |
CCC, chronic complex condition; LLC, life-limiting condition.
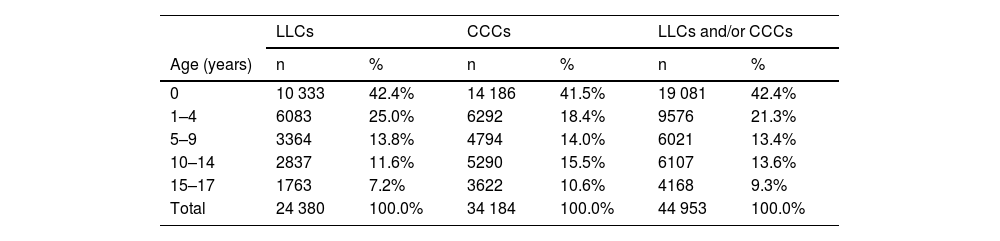
In the study sample, 57.5% of the patients were male and 70.7% resided in urban areas. Table 2 presents the distribution of prevalent cases by age group. The mean age of LLC cases was 4.03 years (standard deviation [SD], 5.25; median, 1 year; IQR, 0–7), and the mean age of CCC cases 4.97 years (SD, 5.82; median, 2 years; IQR, 0–10). There was a predominance of infants under 1 year and a decreasing trend in prevalent cases with increasing age.
Cumulative annual prevalence of life-limiting conditions, chronic complex conditions and their combination by age group.
| LLCs | CCCs | LLCs and/or CCCs | ||||
|---|---|---|---|---|---|---|
| Age (years) | n | % | n | % | n | % |
| 0 | 10 333 | 42.4% | 14 186 | 41.5% | 19 081 | 42.4% |
| 1–4 | 6083 | 25.0% | 6292 | 18.4% | 9576 | 21.3% |
| 5–9 | 3364 | 13.8% | 4794 | 14.0% | 6021 | 13.4% |
| 10–14 | 2837 | 11.6% | 5290 | 15.5% | 6107 | 13.6% |
| 15–17 | 1763 | 7.2% | 3622 | 10.6% | 4168 | 9.3% |
| Total | 24 380 | 100.0% | 34 184 | 100.0% | 44 953 | 100.0% |
CCC, chronic complex condition; LLC, life-limiting condition.
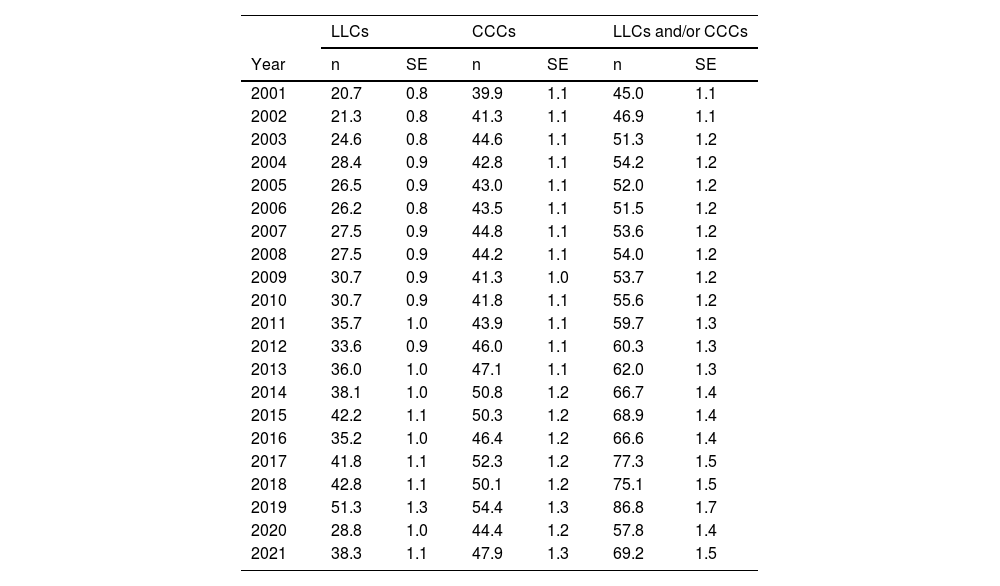
Table 3 presents the prevalence adjusted for age per 10 000 inhabitants of LLCs, CCCs and their combination. Fig. 1 shows the corresponding analyses of the trends, with a percent increase through 2019 of 4.1% for LLCs (95% CI, 3.4% to 4.8%; P < .001), 1.3% for CCCs (95% CI, 0.9%–1.8%; P < .001) and 3% for the combination of both (95% CI, 2.5%–3.4%; P < .001). Between 2019 and 2020, there was an inflection point changing to a decreasing trend compared to previous years, but without any subsequent significant changes in percentages: annual decrease of −13.2% for LLCs (95% CI, −29.4% to 6.7%; P = .166), −5.4% for CCCs (95% CI, −18.8% to 10.3%; P = .456) and −8.7% for both combined (95% CI, −20.7 to 5.1%; P = .190).
Adjusted prevalence (expected cases based on the standard European population of 2013/standard population) per 10 000; expected frequency and standard error of patients with life-limiting conditions, chronic complex conditions and their combination.
| LLCs | CCCs | LLCs and/or CCCs | ||||
|---|---|---|---|---|---|---|
| Year | n | SE | n | SE | n | SE |
| 2001 | 20.7 | 0.8 | 39.9 | 1.1 | 45.0 | 1.1 |
| 2002 | 21.3 | 0.8 | 41.3 | 1.1 | 46.9 | 1.1 |
| 2003 | 24.6 | 0.8 | 44.6 | 1.1 | 51.3 | 1.2 |
| 2004 | 28.4 | 0.9 | 42.8 | 1.1 | 54.2 | 1.2 |
| 2005 | 26.5 | 0.9 | 43.0 | 1.1 | 52.0 | 1.2 |
| 2006 | 26.2 | 0.8 | 43.5 | 1.1 | 51.5 | 1.2 |
| 2007 | 27.5 | 0.9 | 44.8 | 1.1 | 53.6 | 1.2 |
| 2008 | 27.5 | 0.9 | 44.2 | 1.1 | 54.0 | 1.2 |
| 2009 | 30.7 | 0.9 | 41.3 | 1.0 | 53.7 | 1.2 |
| 2010 | 30.7 | 0.9 | 41.8 | 1.1 | 55.6 | 1.2 |
| 2011 | 35.7 | 1.0 | 43.9 | 1.1 | 59.7 | 1.3 |
| 2012 | 33.6 | 0.9 | 46.0 | 1.1 | 60.3 | 1.3 |
| 2013 | 36.0 | 1.0 | 47.1 | 1.1 | 62.0 | 1.3 |
| 2014 | 38.1 | 1.0 | 50.8 | 1.2 | 66.7 | 1.4 |
| 2015 | 42.2 | 1.1 | 50.3 | 1.2 | 68.9 | 1.4 |
| 2016 | 35.2 | 1.0 | 46.4 | 1.2 | 66.6 | 1.4 |
| 2017 | 41.8 | 1.1 | 52.3 | 1.2 | 77.3 | 1.5 |
| 2018 | 42.8 | 1.1 | 50.1 | 1.2 | 75.1 | 1.5 |
| 2019 | 51.3 | 1.3 | 54.4 | 1.3 | 86.8 | 1.7 |
| 2020 | 28.8 | 1.0 | 44.4 | 1.2 | 57.8 | 1.4 |
| 2021 | 38.3 | 1.1 | 47.9 | 1.3 | 69.2 | 1.5 |
CCC, chronic complex condition; LLC, life-limiting condition; SE, standard error.
 life-limiting conditions (LLCs); (B) chronic complex conditions (CCCs) and (C) both combined.")
Fig. 2 presents the trends by age group. There were significant annual percent increases in every age group except the group aged 15 to 17 years. This increasing trend was sustained through 2021 with no inflection point in infants under 1 year (2.9%; 95% CI, 2% to 3.8%) and the group aged 10 to 14 years (1.4%; 95% CI, 0.7% to 2.2%), and only through 2019 for the groups aged 1 to 4 years (4.5%; 95% CI, 3.5% to 5.5%) and 5 to 9 years (1.4%; 95% CI, 0.7% to 2.2%).

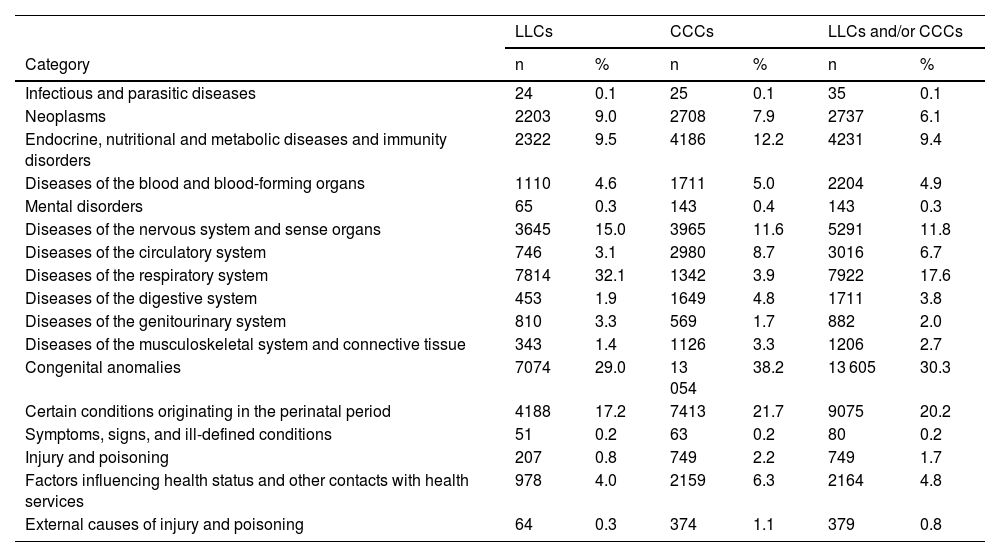
Table 4 presents the distribution of cases by the major diagnostic category. Patients had a mean of 1.5 diagnoses (SD, 0.94) associated to a LLC or CCC (median, 1; IQR, 1–2), corresponding to a mean of 1.23 diagnostic categories per patient (median, 1; IQR, 1–1). The predominant diagnostic categories in LLCs were respiratory diseases of the respiratory system and congenital anomalies, while the predominant categories in CCCs were congenital anomalies and conditions originating in the perinatal period.
Distribution by diagnostic category of patients with life-limiting conditions, chronic complex conditions and their combination (patients may be included in more than one category).
| LLCs | CCCs | LLCs and/or CCCs | ||||
|---|---|---|---|---|---|---|
| Category | n | % | n | % | n | % |
| Infectious and parasitic diseases | 24 | 0.1 | 25 | 0.1 | 35 | 0.1 |
| Neoplasms | 2203 | 9.0 | 2708 | 7.9 | 2737 | 6.1 |
| Endocrine, nutritional and metabolic diseases and immunity disorders | 2322 | 9.5 | 4186 | 12.2 | 4231 | 9.4 |
| Diseases of the blood and blood-forming organs | 1110 | 4.6 | 1711 | 5.0 | 2204 | 4.9 |
| Mental disorders | 65 | 0.3 | 143 | 0.4 | 143 | 0.3 |
| Diseases of the nervous system and sense organs | 3645 | 15.0 | 3965 | 11.6 | 5291 | 11.8 |
| Diseases of the circulatory system | 746 | 3.1 | 2980 | 8.7 | 3016 | 6.7 |
| Diseases of the respiratory system | 7814 | 32.1 | 1342 | 3.9 | 7922 | 17.6 |
| Diseases of the digestive system | 453 | 1.9 | 1649 | 4.8 | 1711 | 3.8 |
| Diseases of the genitourinary system | 810 | 3.3 | 569 | 1.7 | 882 | 2.0 |
| Diseases of the musculoskeletal system and connective tissue | 343 | 1.4 | 1126 | 3.3 | 1206 | 2.7 |
| Congenital anomalies | 7074 | 29.0 | 13 054 | 38.2 | 13 605 | 30.3 |
| Certain conditions originating in the perinatal period | 4188 | 17.2 | 7413 | 21.7 | 9075 | 20.2 |
| Symptoms, signs, and ill-defined conditions | 51 | 0.2 | 63 | 0.2 | 80 | 0.2 |
| Injury and poisoning | 207 | 0.8 | 749 | 2.2 | 749 | 1.7 |
| Factors influencing health status and other contacts with health services | 978 | 4.0 | 2159 | 6.3 | 2164 | 4.8 |
| External causes of injury and poisoning | 64 | 0.3 | 374 | 1.1 | 379 | 0.8 |
CCC, chronic complex condition; LLC, life-limiting condition.
The prevalence of LLCs in the population aged less than 18 years has increased significantly in our region, from 20.7 per 10 000 in 2001 to 51.3 per 10 000 in 2019. There was also a significant increase in the prevalence of CCCs in the same period, although of lesser magnitude, from 39.9 per 10 000 in 2001 to 54.4 per 10 000 in 2019. The combined frequency of patients with these conditions (LLC or CCC) increased from 45 per 10 000 in 2001 to 86.8 per 10 000 in 2019; and 30.3% of these patients had both types.
Between 2019 and 2020 there was an inflection point changing to a decreasing trend, probably associated with the confinement and social distancing measures imposed on account of the coronavirus 2019 pandemic, which had a direct and indirect impact on diagnosis and treatment in every health care setting.14 It is likely that the previous increasing trend will re-emerge in the data collected in upcoming years.
Compared to other studies, the prevalences found in our population are within the range reported in an international cross-sectional study of the global need for PPC conducted in different areas of the world representing the full income spectrum; the prevalences for year 2010 for the population aged 0 to 19 years ranged from 20 per 10 000 in the United Kingdom to 120 per 10 000 in Zimbabue.3 The methodology of that study was different from ours, as it was based chiefly on official prevalence and mortality data for a list of diagnostic conditions, including infection by human immunodeficiency virus.3 A recent study conducted in countries of the Persian Gulf with a similar methodology estimated a prevalence of 17.5 per 10 000 children under 14 years for 2019.15
In England, a study with a similar methodology to our own found an increase in the prevalence of LLCs in the population aged 0 to 19 years from 26.7 per 10 000 in 2001/2002 to 66.4 per 10 000 in 2017/2018.4 A similar study in Scotland found an increasing trend that was less pronounced,16 attributed to differences in the proportions of ethnic groups. A study conducted in Germany that applied the original list published by Fraser et al as well as an adapted version also found an increase in patients with LLCs between 2014 and 2019, although the reviewed records included diagnoses made in outpatient settings, so the reported prevalences were much higher: applying the list of Fraser et al., they ranged from 188 to 208 per 10 000 population.17 In Australia, using a list of diagnoses associated with LLC, a preliminary version of the list published by Fraser et al.,7 there was a 29.6% in the number of patients with LLCs between 2011 and 2016, but the authors did not calculate the prevalence.18 Using the list of Fraser et al., the estimated prevalence in a region in Canada for the 2016–2017 fiscal year was 73.1 per 10 000 population under 25 years.19
All these prevalence values have been reported as proxy estimates of the need for PPC, although they far exceed estimates based on the number of patients who actually receive care in specialised units. Thus, a study conducted in Wales in 2001 and 2002 that collected patient data from records of a monthly survey of active paediatricians and the referrals to PPC and paediatric hospice services found a prevalence de 3.7 per 10 000 population, far lower than the prevalences estimated based on diagnostic codes discussed above.20
When it comes to CCCs, a previous study estimated their prevalence in patients aged 0 to 19 years for 2018 in the Balearic Islands21 based on data from primary care and hospital records and using a diagnostic code list adapted from the list published by Feudtner et al.10 Only 34.3% of the patients identified through hospital records also had a CCC documented in the primary care records, and only 9.8% of patients identified through primary care records had hospital admissions with a documented CCC diagnosis. The prevalence of CCCs in any care setting was 144.5 per 10 000, compared to a hospital-based prevalence of 34.7 per 10 000. The latter figure is lower compared to the prevalence we found for the same year (50.1 per 10 000). It is clear that the consideration of diagnoses made at the primary care level significantly increases estimates, and it would be interesting to determine which percentage of these diagnoses correspond to LLCs and could benefit from PPC.
There are some recent estimates of the prevalence of patients with CCCs in developed countries: 94.8 per 10 000 in 2015–2016 for the population aged 0 to 24 in Canada.22 As regards trends, hospital admissions due to CCCs in the United States doubled between 1991 and 2005.23
In addition to the lists of CCLs and CCCs we use,10 there are other related code lists, like the list used to identify deceased patients with conditions associated with palliative care needs.24 Cochrane et al. estimated the mortality among the users of hospice facilities that provided PPC, and found that approximately 10% died, then applied the found mortality in an inverse calculation to the deaths recorded in 2005 to estimate a population prevalence of 14.5 per 10 000. This list was applied to the deaths reported in Catalonia, Spain, in the 2007–2011 period, yielding an estimated 60% of deaths due to causes with PPC needs.25
A broad range of factors may have contributed to the observed increase in the number of admissions due to LLCs or CCCs. There may have been changes in survival, in diagnosis or in the level of care provided for some of the associated disorders during the periods under study.26–28 There may also have been changes in the coding systems. Thus, Feudtner et al. found that the codes in their ICD-10 list were more comprehensive compared to the ICD-9 list, corresponding to a 10% increase in the relative frequency of identified cases.10 This factor would be reflected in a change point in the year that the transition from one version to another took place (2016), which was not detected in our analysis, but not in the observed increasing trend. Although there were relevant changes in the classification of chronic diseases with the transition between previous versions of the ICD, this was not the case of the transition from the ICD-9-CM to the ICD-10.29
In interpreting estimates of the volume of patients with PPC needs based on lists of codes associated with LLCs or CCCs, it is essential to consider the methodology used in the development of these lists. While the current lists of LLCs are based in the diagnoses of patients managed in PPC units and found in death records,4,7,11 the lists of CCCs were originally developed with the diagnoses associated with a substantial use of health care resources and congenital malformations.9,10 It is clear that only a small fraction of the patients with LLC or CCC diagnoses are referred to PPC units. In Belgium, a comparison of the record databases of hospitals and paediatric liaison teams (in charge of referrals to PPC) found that only 1.9% of patients with CCC diagnoses had been referred to PPC.30 A cohort study of patients admitted to a paediatric intensive care unit with a CCC code found that only 11% had been referred to the PPC unit.31
Some instruments had been developed to identify patients with PPC needs32 and CCCs33,34 that may be useful in clinical practice to identify patients with special care needs and to plan their care. In the validation study of the PedCom scale for the identification of patients with paediatric chronic complex conditions,35 conducted in 350 patients followed up in the outpatient paediatric speciality clinics of a tertiary care hospital, the results obtained with the scale were compared with the presence/absence of diagnoses included in the list by Feudtner et al.10 Only 69.2% of the patients with a CCC code in the list met the criteria for a paediatric chronic complex condition according to the scale.35 Although the sample was small, the validation study showed that the Feudtner classification system could overestimate the frequency of CCCs. If we assume this level of overestimation with the use of code lists, we would be overestimating prevalences by 30.8%. To our knowledge, a similar analysis has yet to be done using the LLC list of Fraser et al.4
The main limitation of our study is that we were unable to determine the validity of the diagnoses coded in the discharge summary records (minimum basic data set) of the regional database or the accuracy in diagnostic coding procedures. Still, the minimum basic dataset is a source used not only in the calculation of official statistics but also in epidemiological studies. The size of the sample and the long follow-up gave the analysis sufficient power to attenuate the effects of circumstantial changes over the study period. By analysing the overall data without comparing hospitals, we controlled for the heterogeneity in coding practices. Another limitation is that we did not analyse the diagnoses recorded at the primary care level; while most patients with palliative care needs would have required hospital admission at some point, we cannot rule out the possibility of having missed some cases managed exclusively at the outpatient level. Lastly, although we estimated prevalences with a widely used methodological approach, we cannot be sure that they represent the actual prevalence without a detailed analysis of the cases.
The results of our study offer prevalence estimates that may be of great interest for health planning. Although there were uncontrolled factors in our analysis that could have affected the magnitude of the results, possibly resulting in underestimation (due to the exclusion of outpatient diagnoses) or overestimation (due to the inclusion of temporary or unconfirmed diagnoses), they still offer a solid foundation for care planning in PPC and/or CCC units. We cannot ignore the fact that, based on our estimates for 2019, approximately 8 in 1000 children may need special care due to these conditions. However, this information is insufficient, and further research is required to assess the needs and level of medical complexity of these patients beyond the diagnoses that helped identify them.
FundingThis research did not receive any external funding.
Conflicts of interestThe authors have no conflicts of interest to declare.
