


In recent years, there has been a change in the conceptualization of foetal growth restriction (FGR), which has gone from being defined solely based on weight criteria to being defined and staged based on Doppler criteria. The aim of our study was to evaluate neonatal risk in a cohort of neonates with moderate to severe early-onset FGR defined by Doppler criteria.
Population and methodsWe conducted a multicentre prospective cohort study in a cohort of neonates with early-onset foetal growth restriction and abnormal Doppler findings and a control cohort without Doppler abnormalities matched for sex and gestational age.
ResultsA total of 105 patients (50 cases, 55 controls) were included. We found a higher frequency of respiratory morbidity in the FGR group, with an increased need of surfactant (30% vs. 27.3%; OR, 5.3 [95% CI, 1.1−26.7]), an increased need for supplemental oxygen (66% vs. 49.1%; OR, 5.6 [95% CI, 1.5−20.5]), and a decreased survival without bronchopulmonary dysplasia (70 vs. 87.3%; OR, 0.16 [95% CI, 0.03−0.99]). Patients with FGR required a longer length of stay and more days of parenteral nutrition and had a higher incidence of haematological abnormalities such as neutropenia and thrombopenia. The lactate level at birth was higher in the severe FGR subgroup (6.12 vs. 2.4 mg/dL; P = .02).
ConclusionThe diagnosis of early-onset moderate to severe FGR defined by Doppler criteria carries a greater risk of respiratory, nutritional and haematological morbidity, independently of weight and gestational age. These patients, therefore, should be considered at increased risk compared to constitutionally small for gestational age preterm infants or preterm infants without FGR.
En los últimos años se ha producido un cambio en el concepto del crecimiento intrauterino retardado (CIR), pasando de estar definido únicamente por criterios de peso a estar definido y estadiado por criterios doppler. Este estudio pretende evaluar el riesgo neonatal de una cohorte de neonatos con CIR precoz moderado-grave definidos por criterios doppler.
Población y métodosSe realizó un estudio multicéntrico de cohortes prospectivo en el que se incluyó una cohorte de neonatos con restricción de crecimiento intrauterino precoz con doppler alterado y una cohorte de control sin alteraciones doppler, pareada por sexo y edad gestacional.
ResultadosSe incluyeron un total de 105 pacientes (50 casos, 55 controles). Se encontró mayor morbilidad respiratoria en el grupo CIR, con mayor necesidad de surfactante (30% versus 27,3%, OR IC95% 5,3 [1,1–26,7]), mayor necesidad de oxígeno suplementario (66% versus 49,1% OR IC95% 5,6 [1,5–20.5]), y menor supervivencia sin displasia broncopulmonar (70 vs. 87,3% OR IC95% 0,16 [IC 0,03−0.99]). Los pacientes CIR requirieron un ingreso más prolongado y más días de nutrición parenteral, así como una mayor incidencia de alteraciones hematológicas como neutropenia y trombopenia. El valor de lactato al nacimiento fue mayor en el subgrupo CIR grave (6,12 vs. 2,4 mg/dl, p = 0,02).
ConclusionesEl diagnóstico de CIR precoz moderado-grave definido por criterios doppler conlleva un mayor riesgo de morbilidad respiratoria, nutricional y hematológica, independiente del peso y la edad gestacional. Estos pacientes, por tanto, deben ser considerados de mayor riesgo que pretérminos constitucionalmente de bajo peso o pretérminos no CIR.

The introduction of Doppler sonography in the prenatal evaluation of pregnant women has led to considerable changes in the monitoring of foetuses with low weight for gestational age, especially in cases with early onset.1 The sonographic assessment has evolved from being purely morphological to including a full functional evaluation. With the performance of quality multicentre studies,2,3 advances have been made in differentiating foetal growth restriction caused by placental problems and constitutional foetal smallness, which accounts for more than half of infants born small for gestational age.4,5
Current protocols6,7 allows the staging of placental insufficiency based on severity, which can guide decision-making on aspects such as termination of pregnancy and mode of delivery.8 In Spain, these protocols were promptly introduced in hospitals and have substantially changed the perinatal management of neonates with foetal growth restriction (FGR). These protocols are the reason that neonatal units have admissions for iatrogenic preterm birth in pregnancies with moderate to severe FGR in which termination of pregnancy is planned in absence of a severe abnormalities in foetal monitoring or a maternal indication (usually severe pre-eclampsia) which were the indications for elective termination of pregnancy a few years ago. Recent studies have shown that these protocols have reduced the incidence of severe prenatal complications, such as placental abruption or intrauterine foetal demise, the final and most severe manifestation of placental insufficiency.9–11
However, few studies have analysed this new body of information specifically focusing on the association between neonatal morbidity and antenatal Doppler findings. Most population registers and databases collecting information on prematurity or low birth weight maintained by scientific societies do not include Doppler variables and continue to study preterm infants with low birth weight for gestational age.12 These studies have demonstrated an increased morbidity in infants with birth weights below the 10th percentile, but this is a very heterogeneous group in which a large number of infants were constitutionally small for gestational age and did not experience true foetal growth restriction, so there is a risk of selection bias that would contribute to underestimating the effect on morbidity of a FGR diagnosis. Obtaining this information is important to guide the management of these patients in the delivery room, the neonatal unit and in the subsequent follow-up, as they are patients at risk of neurodevelopmental disorders.13
The above motivated the performance of this study with the primary objective of instituting a prospective cohort of infants with early placental insufficiency defined based on Doppler criteria, to be compared with a cohort of preterm infants matched for sex and gestational age in whom placental function was normal based on the foetal Doppler findings.
Material and methodsWe conducted a multicentre prospective cohort study in 7 neonatal units of the public health care system over a period of 33 months (November 2019-August 2022).
The study included a cohort of preterm infants with severe placental insufficiency (FGR stage > I) based on antenatal Doppler criteria and a control cohort of preterm infants matched for gestational age and sex without antenatal Doppler abnormalities.
The Doppler criteria applied to the diagnosis and staging of placental insufficiency (FGR) were those in the classification proposed by Figueras and Gratacos.8 The case cohort included patients with Doppler abnormalities in the evaluation of the umbilical artery: absent or reversed umbilical artery end-diastolic flow, independently of the presence or absence of middle cerebral artery flow redistribution or changes in foetal cardiac function defined based on the detection of ductus venosus abnormalities.
We excluded infants with genetic disorders/syndromes, polymalformative syndrome or congenital infection. We also excluded infants product of monochorionic pregnancies, as there is insufficient data on the use of Doppler ultrasound in these patients.
The management in the delivery room and admission to the neonatal unit adhered to the current protocols of each unit.
We collected the data on all the study variables on a custom data collection form. Data on variables regarding demographic characteristics, prenatal characteristics (including Doppler-related variables), management in the delivery room, anthropometric measurements, the complete blood count at admission and postnatal outcomes during the stay were retrieved from the health records. The case definition for bronchopulmonary dysplasia (BPD) as need for supplemental oxygen for more than 28 days. Necrotising enterocolitis (NEC) was defined based on the modified Bell’s staging system, including stage Ia-suspected and establishing a separate variable to document cases of NEC requiring surgical management. We defined retinopathy of prematurity as retinopathy of any severity based on the international classification of retinopathy of prematurity of the American Academy of Ophthalmology.
We performed a descriptive analysis of all the variables, summarising quantitative variables as mean, standard deviation, median and range, and qualitative variables as absolute frequencies and percentages. To compare qualitative variables, we used the χ2 test. After assessing the normality of the distribution by means of the Kolmogorov–Smirnov test, we compared quantitative data with the Student t test or Mann–Whitney U test as applicable. We analysed the association between quantitative variables using the Spearman correlation coefficient. We performed multivariate binomial logistic regression analysis adjusted for the weight z score in the comparison of the two main cohorts and adjusted for weight and gestational age in the subgroup analysis. Statistical significance was defined as a two-tailed p value of less than 0.05. All the analyses were performed with the statistical package SPSS, version 24.0.
The study was approved by the Research Ethics Committee of the coordinating centre (file 2019/425). We obtained signed informed consent from the parents or legal guardians of all the patients.
ResultsThe study included a total of 105 patients, 55 in the control group and 50 cases in the moderate to severe placental insufficiency group. Within the case group, 18 patients were classified as having severe FGR grave (stage III or IV) and 32 as having moderate FGR (stage II).
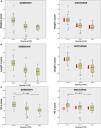
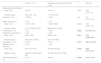
Table 1 presents the general characteristics of the patients included in the study. Fig. 1 presents a box plot diagram of the anthropometric measurements at birth and at 36 weeks of corrected age in the control group and in the FGR II and FGR III subgroups of the case group.
General characteristics of the series.
| General characteristics | Total n = 105 | Control n = 55 | Moderate-severe FGR n = 50 | P |
|---|---|---|---|---|
| Sex (male), n (%) | 60 (57.1) | 28 (50.9) | 32 (64) | .176 |
| Gestational age (days) | ||||
| Mean ± SD | 222 ± 18 | 224 ± 19 | 220 ± 18 | .253 |
| Median (range) | 221 (181−251) | 225 (181−251) | 217 (187−250) | |
| Maternal age | ||||
| Mean ± SD | 34.5 ± 5.9 | 35 ± 6 | 34 ± 6 | .854 |
| Median (IQR) | 35 (16−45) | 35 (16−45) | 36 (17−44) | |
| IVF, n (%) | 19 (18.1) | 13 (23.6) | 6 (12) | .122 |
| Pre-eclampsia, n (%) | 25 (23.8) | 4 (7.3) | 21 (42) | <.001 |
| Severe pre-eclampsia, n (%) | 14 (13.3) | 4 (7.3) | 10 (20) | .055 |
| HELLP syndrome, n (%) | 3 (2.9) | 0 (0) | 3 (6) | .065 |
| Chronic HTN, n (%) | 6 (5.7) | 0 (0) | 6 (12) | .008 |
| Diabetes mellitus, n (%) | 0 (0) | 0 (0) | 0 (0) | – |
| Type 2 diabetes, n (%) | 2 (1.9) | 2 (3.6) | 0 (0) | .173 |
| Gestational diabetes, n (%) | 6 (5.7) | 2 (3.6) | 4 (8) | .336 |
| Maternal BMI | n = 104 | n = 55 | n = 49 | |
| Mean ± SD | 25.9 ± 6 | 24.7 ± 5.5 | 27.4 ± 6.4 | .022 |
| Median (range) | 24.7 (16−53) | 23.5 (16−53) | 25.5 (17.2−46.8) | |
| Maternal smoking, n (%) | 19 (18.1) | 13 (23.6) | 6 (12) | .122 |
| Twin pregnancy, n (%) | 26 (24.8) | 22 (40) | 4 (8) | <.001 |
| Threat of premature birth, n (%) | 35 (33.3) | 33 (60) | 2 (4) | <.001 |
| Treatment with ASA, n (%) | 12 (11.4) | 3 (5.5) | 9 (18) | .044 |
| Antenatal steroids, n (%) | 93 (88.6) | 47 (85.5) | 46 (92) | .292 |
| Magnesium sulphate, n (%) | 56 (53.3) | 27 (49.1) | 29 (58) | .361 |
| Caesarean delivery, n (%) | 79 (75.2) | 30 (54.5) | 49 (98) | <.001 |
| Urgent caesarean, n (%) | 44 (41.9) | 15 (27.3) | 29 (58) | <.001 |
| Weight | ||||
| Mean ± SD | 1401 ± 535 | 1682 ± 522 | 1092 ± 348 | <.001 |
| Median (range) | 1321 (390−3640) | 1690 (790−3640) | 1056 (390−1870) | |
| Birth weight z score | ||||
| Mean ± SD | −0.96 ± 1.03 | −0.29 ± 0.84 | −1.7 ± 0.66 | <.001 |
| Length | n = 96 | n = 51 | n = 45 | |
| Mean ± SD | 39.4 ± 4.4 | 41.6 ± 3.6 | 36.8 ± 3.8 | <.001 |
| Median (range) | 39.3 (28−52) | 42 (33−52) | 37.5 (28−44) | |
| Birth length z score | n = 96 | n = 51 | n = 45 | |
| Mean ± SD | −0.85 ± 1.2 | −0.10 ± 0.87 | −1.68 ± 0.97 | <.001 |
| Head circumference | n = 104 | n = 55 | n = 49 | |
| Mean ± SD | 27.8 ± 2.9 | 29 ± 2.8 | 26.4 ± 2.5 | <.001 |
| Median (range) | 27.7 (22−36.5) | 29 (22.5−36.5) | 26.5 (22−32) | |
| Birth head circumference z score | n = 104 | n = 55 | n = 49 | |
| Mean ± SD | −0.75 ± 1.27 | −0.05 ± 1.05 | −1.54 ± 1.02 | <.001 |
ASA, acetylsalicylic acid; BMI, body mass index; IQR, interquartile range; FGR, foetal growth restriction; IVF, in vitro fertilization.
Statistically significant differences between groups presented in boldface.

Box plot diagrams of anthropometric measurements in the control group and by subgroup at admission and at 36 weeks of corrected age. (A) Weight in control group, moderate FGR and severe FGR subgroups at admission and at 36 weeks. The arrows indicate a decreasing trend in the z score in each subgroup, illustrating the extrauterine growth restriction in these infants. (B) Length z score at admission and at 36 weeks in each subset of infants. The arrows indicate a decrease relative to the mean at admission in each group/subgroup. (C) Head circumference z score at admission and 36 weeks. There was no decrease compared to the time of admission in the control group, while the HC in the moderate and severe FGR subgroups demonstrated early catch-up growth, with no significant differences between groups at 36 weeks.
When it came to the Doppler findings, 32 patients had an umbilical artery pulsatility index (PI) indicating absent end-diastolic flow and were classified as cases of moderate FGR (FGR II). Of this subset, 27 patients (84.4%) had a middle cerebral artery PI under the 5th percentile indicative of cerebral flow redistribution, and none of the patients had ductus venosus Doppler abnormalities that could be attributed to cardiac involvement in the foetus. The rest (18 patients) had an umbilical artery PI consistent with reversed flow, so they were classified as cases of severe FGR (FGR III). All patients with severe FGR had an abnormal middle cerebral artery PI below the 5th percentile and 15 of the 18 had abnormal ductus venosus waveforms indicative of foetal heart failure, 11 with a PI above the 95th percentile and 4 with ductus venosus reversed flow.
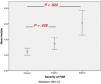
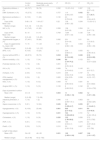
Table 2 summarises the findings for the variables concerning the immediate postpartum management in the control group and the case subgroups while Fig. 2 provides a graphic representation of the lactate levels at birth detailed in the table, showing a poorer health status at birth with lower Apgar scores and laboratory values indicative of more severe lactic acidosis in neonates with severe FGR.
Multivariate logistic regression analysis by group. Immediate postpartum variables.
| Delivery room variables | Control n = 55 | Moderate FGR n = 32 | P | ORa (CI) | Severe FGR n = 18 | P | ORa (CI) |
|---|---|---|---|---|---|---|---|
| Caesarean delivery, n (%) | 30 (54.5) | 31 (96) | 0.051 | 16.5 (0.98−276) | 18 (100) | ||
| Urgent caesarean, n (%) | 15 (27.3) | 18 (56.3) | 0.168 | 2.7 (0.7−10.7) | 11 (61.1) | 0.55 | 1.5 (0.37−6.4) |
| 1-minute Apgar | |||||||
| Mean ± SD | 8 ± 1 | 8 ± 1 | 0.763 | 1.08 (0.66−1.07) | 6 ± 2 | 0.025 | 0.54 (0.31−0.92) |
| Median (range) | 8 (5−10) | 8 (5−9) | 6 (2−9) | ||||
| 5-minute Apgar | |||||||
| Mean ± SD | 9 ± 1 | 9 ± 1 | 0.702 | 1.2 (0.53−2.5) | 8 ± 2 | 0.042 | 0.41 (0.17−0.96) |
| Median (range) | 9 (7−10) | 9 (7−10) | 8 (2−9) | ||||
| Intubation in delivery room, n (%) | 1 (1.8) | 2 (6.3) | 0.507 | 3 (0.11−83) | 2 (11.1) | 0.63 | 0.39 (0.008−18.3) |
| Cardiac massage, n (%) | 0 | 1 (3.1) | 1 (5.6) | ||||
| Adrenaline in delivery room, n (%) | 0 | 1 (1.4) | 1 (5.6) | ||||
| Cord blood pH | n = 50 | n = 32 | n = 16 | ||||
| Mean ± SD | 7.29 ± 0.08 | 7.28 ± 0.05 | 0.438 | 0.02 (0−523) | 7.24 ± 0.12 | 0.183 | 0.001 (0−26) |
| Median (range) | 7.30 (7.00−7.46) | 7.29 (7.17−7.38) | 7.24 (6.94−7.46) | ||||
| pH | n = 55 | n = 31 | n = 17 | ||||
| Mean ± SD | 7.27 ± 0.07 | 7.28 ± 0.07 | 7.24 ± 0.07 | 0.115 | 0 (0−9.47) | ||
| Median (range) | 7.28 (7.12−7.40) | 7.28 (7.1−7.47) | 7.26 (7.15−7.41) | ||||
| Bicarbonate | n = 55 | n = 31 | n = 18 | ||||
| Mean ± SD | 23 ± 3.5 | 22.9 ± 2.9 | 0.676 | 1.05 (0.83−1.3) | 20 ± 3.5 | 0.037 | 0.77 (0.61−0.98) |
| Median (range) | 23 (14.4−32.1) | 23 (17.2−28) | 20.6 (13−25.5) | ||||
| Base excess | n = 55 | n = 30 | n = 18 | ||||
| Mean ± SD | −3.4 ± 3.4 | −3.5 ± 3.4 | 0.428 | 1.09 (0.88−1.35) | −7.06 ± 3.9 | 0.022 | 0.77 (0.62−0.96) |
| Median (range) | −3.5 (−13 a 6.1) | −3 (−11.9 a 3) | −5.8 (−14.8 a −1.4) | ||||
| Lactate at birth | n = 54 | n = 30 | n = 17 | ||||
| Mean ± SD | 2.4 ± 1.6 | 3.4 ± 2 | 0.205 | 1.28 (0.86−1.87) | 6.12 ± 3.1 | 0.036 | 1.4 (1.02−1.9) |
| Median (range) | 2.0 (0.6−10.4) | 2.95 (1.1−10.5) | 4.9 (2.4−11) | ||||
| Haematocrit | n = 55 | n = 31 | n = 18 | ||||
| Mean ± SD | 48.9 ± 6.6 | 51.5 ± 5.7 | 0.722 | 1.03 (0.89–1.2) | 46.6 ± 7.7 | 0.686 | 1.025 (0.90−1.15) |
| Median (range) | 49 (32−62.2) | 5 3(40−66) | 47.2 (26−58) | ||||
CI, confidence interval; FGR, foetal growth restriction; ORa, odds ratio adjusted for weight and gestational age; SD, standard deviation.
Statistically significant differences are presented in boldface.

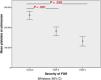
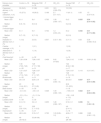
Table 3 present the complete blood count values at admission in each cohort, corrected for the weight z score, showing a greater incidence of thrombocytopenia and neutropenia in the moderate-severe FGR group. Fig. 3 provides a graphic representation of the distribution of the platelet count in the control group and in FGR subgroups.
Complete blood count values at admission by cohort; logistic regression analysis corrected for weight z score.
| Control n = 55 | Moderate-severe early-onset FGR n = 50 | P | ORa (CI) | |
|---|---|---|---|---|
| Haemoglobin at admission | ||||
| Mean ± SD | 16.3 ± 2 | 16.6 ± 2.2 | 0.446 | 0.89 (0.65−1.2) |
| Median (range) | 16.4 (12.6−19.9) | 17.1 (8.8−20.8) | ||
| Anaemiaa, n (%) | 14 (25.5) | 11 (22) | 0.31 | 2.2 (0.47−10.2) |
| WBCs at admission | n = 55 | n = 49 | ||
| Mean ± SD | 12 070 ± 7000 | 11 688 ± 9800 | 0.922 | 0.99 (0.93−1.07) |
| Median (range) | 10 170 (2930−43 470) | 9808 (3140−43 790) | ||
| Leukopeniab, n (%) | 4 (7.3) | 11 (22) | 0.044 | 6 (1.05−37.9) |
| Neutrophils at admission | n = 55 | n = 49 | ||
| Mean ± SD | 5605 ± 5070 | 2638 ± 2152 | 0.014 | 0.74 (0.58−0.94) |
| Median (range) | 4240 (570−30 390) | 2210 (90−8650) | ||
| Neutropeniac, n (%) | 9 (16.4) | 16 (32) | 0.014 | 5.8 (1.4−23.4) |
| Platelet count at admission | n = 55 | n = 49 | ||
| Mean ± SD | 260 018 ± 74 611 | 162 388 ± 60 084 | 0.008 | 0.28 (0.11−0.71) |
| Median (range) | 253 000 (118 000−458 000) | 153 000 (35 000−317 000) | ||
| Thrombocytopeniad, n (%) | 5 (9.1) | 22 (44) | 0.005 | 6 (1.7−21.5) |
CI, confidence interval; FGR, foetal growth restriction; ORa, odds ratio adjusted for weight z score; SD, standard deviation; WBC, white blood cell.
Statistically significant differences are presented in boldface.

Table 4 summarises the findings of the logistic regression analysis of neonatal morbidity variables in both cohorts, providing crude values and values adjusted for weight. The analysis found a significant association, independently of the birth weight z score, between moderate or severe FGR and an increased need of surfactant, an increased need of oxygen at admission, a lower BPD-free survival, an increased incidence of nosocomial sepsis and hypoglycaemia, an increased duration of parenteral nutrition and a longer length of stay.
Morbidity by group. Logistic regression analysis comparing both cohorts, crude and adjusted for weight.
| Control n = 55 | Moderate-severe early-onset FGR n = 50 | P | OR (CI) | P | ORa (CI) | |
|---|---|---|---|---|---|---|
| Respiratory distress, n (%) | 40 (72.7) | 39 (78) | 0.532 | 1.3 (0.5−3.2) | 0.367 | 1.36 (0.37−4.9) |
| EMH. Surfactant, n (%) | 15 (27.3) | 15 (30) | 0.757 | 1.14 (0.49−2.67) | 0.042 | 5.3 (1.1−26.7) |
| Mechanical ventilation, n (%) | 6 (10.9) | 11 (22) | 0.130 | 2.3 (0.78−6.8) | 0.058 | 6.5 (0.94−44.3) |
| Days of MV, Mean ± SD | 0.48 ± 1.9 | 1.64 ± 5.7 | 0.22 | 1.09 (0.95−1.25) | 0.249 | 1.3 (0.8−2.1) |
| Median (range) | 0 (0−12) | 0 (0−33) | ||||
| NIV, n (%) | 41 (74.5) | 41 (82) | 0.358 | 1.56 (0.6−3.9) | 0.354 | 1.9 (0.47−7.9) |
| Days of NIV, Mean ± SD | 8 ± 15 | 9 ± 15 | 0.769 | 1.004 (0.97−1.03) | 0.126 | 1.04 (0.99−1.08) |
| Median (range) | 2 (0−64) | 3 (0−83) | ||||
| Supplemental oxygen, n (%) | 27 (49.1) | 33 (66) | 0.082 | 2.01 (0.9−4.4) | 0.01 | 5.6 (1.5−20.5) |
| Days of supplemental O2, mean ± SD | 7 ± 15 | 11 ± 23 | 0.41 | 1.01 (0.98−1.03) | 0.063 | 1.04 (0.99−1.09) |
| Median (range) | 0 (0−69) | 1(0−137) | ||||
| BPD, n (%) | 6 (10.9) | 10 (20) | 0.2 | 2.04 (0.68−6.1) | 0.055 | 6.2 (0.96−40.4) |
| Survival without BPD, n (%) | 48 (87.3) | 35 (70) | 0.034 | 0.34 (0.13−0.92) | 0.049 | 0.16 (0.03−0.99) |
| Severe morbidity, n (%) | 1 (1.8) | 7 (14) | 0.046 | 8.8 (1.04−74.2) | 0.153 | 33.7 (0.27−4.223) |
| Postnatal steroids, n (%) | 1 (1.8) | 3 (6) | 0.291 | 3.5 (0.35−34.3) | ||
| IVH, n (%) | 1 (1.8) | 6 (12) | 0.069 | 7.4 (0.75−63.5) | 0.143 | 6.3 (0.5−72.7) |
| Inotropes, n (%) | 2 (3.6) | 5 (10) | 0.210 | 2.94 (0.54−15.9) | 0.197 | 13 (0.25−709) |
| PDA (medical management), n (%) | 2 (3.6) | 1 (2) | 0.620 | 0.54 (0.05–6.2) | 0.338 | 4 (0.2−107) |
| NEC, n (%) | 1 (1.8) | 6 (12) | 0.069 | 7.4 (0.85−63.5) | 0.081 | 53 (0.6−4.622) |
| Surgical NEC, n (%) | 1 (1.8) | 5 (10) | 0.108 | 6 (0.68−53.2) | 0.162 | 33 (0.24−4.750) |
| Days of parenteral nutrition | ||||||
| Mean ± SD | 4.5 ± 6 | 10.5 ± 11 | 0.003 | 1.1 (1.035−1.19) | 0.002 | 1.2 (1.07−1.35) |
| Median (range) | 2 (0−28) | 7 (0−58) | ||||
| Intestinal perforation, n (%) | 1 (1.8) | 1 (2) | 0.946 | 1.10 (0.067−18.1) | 0.953 | 0.8 (0.002−325) |
| Sepsis nosocomial, n (%) | 5 (9.1) | 12 (24) | 0.045 | 3.2 (1.025−9.7) | 0.035 | 8.7 (1.16−65.1) |
| Hypoglycaemia, n (%) | 6 (10.9) | 23 (46) | 0.001 | 6.95 (2.5−19.2) | 0.011 | 8.6 (1.6−45.9) |
| Hyperglycaemia, n (%) | 1 (1.8) | 8 (16) | 0.031 | 10.3 (1.024−85.5) | 0.151 | 7.2 (0.49−105.4) |
| Cholestasis, n (%) | 1 (1.8) | 9 (18) | 0.020 | 12.2 (1.48−99.8) | 0.099 | 37.5 (0.5−2.783) |
| ROP, n (%) | 5 (9.1) | 7 (14) | 0.348 | 1.80 (0.53−6.1) | 0.278 | 3.4 (0.37−30.2) |
| Death, n (%) | 2 (3.6) | 5 (10) | 0.210 | 2.9 (0.55−15.9) | 0.227 | 12.5 (0.2−758) |
| Length of stay (days) | ||||||
| Mean ± SD | 34 ± 22 | 46 ± 30 | 0.021 | 1.02 (1.003−1.04) | 0.007 | 1.04 (1.01−1.07) |
| Median (range) | 33 (5−96) | 43 (2−162) | ||||
BPD, bronchopulmonary dysplasia; CI, confidence interval; FGR, foetal growth restriction; HMD, hyaline membrane disease; IVH, intraventricular haemorrhage; MV, mechanical ventilation; NEC, necrotising enterocolitis; NIV, non-invasive ventilation; OR, odds ratio; ORa, odds ratio adjusted for weight z score; PDA, patent ductus arteriosus; ROP, retinopathy of prematurity; SD, standard deviation.
Statistically significant differences are presented in boldface.
Low birth weight is a known risk factor for morbidity in preterm newborns,14 but there is a dearth of data on the association of morbidity in preterm infants with low birth weight secondary to placental insufficiency. In the present study, conducted in 7 neonatal units that routinely perform foetal Doppler assessments for the detection of placental insufficiency, we found that the diagnosis of moderate or severe FGR based on Doppler criteria was associated to an increase in neonatal morbidity independently of gestational age or birth weight. Our findings can be useful in the field of neonatology, as they underscore the importance of differentiating between newborns constitutionally small for gestational age and newborns with foetal growth restriction secondary to placental insufficiency, which would help individualise management in the neonatal care unit.
Although some previous studies suggest that the stressors experienced by foetuses with FGR may have a positive impact on lung maturation,15 our findings show, as can be seen in Table 4, an increase in respiratory morbidity in patients with FGR, with an increased need of supplemental oxygen and an up to 5-fold increase in the administration of surfactant compared to the group of preterm infants without antenatal Doppler abnormalities. In the control group, the survival free of BPD was 87% compared to 70% in the FGR group, a difference that was statistically significant. Our study also found differences in the incidence of BPD between groups, which were not statistical significance but with a P value near the threshold of significance. The increased risk of BPD in patients with FGR diagnosed based on Doppler criteria had already been reported in recent publications.16,17
The impact of the chronic hypoxia and malnutrition experienced by foetuses subject to placental insufficiency is not limited to the increase in respiratory morbidity: the difference in weight in patients with has always been highlighted as one of the causes of the differences in morbidity. This is why we show crude ORs as well as ORs adjusted for weight to highlight that, even correcting for birth weight, placental insufficiency is associated with an increased incidence of hypoglycaemia and nosocomial sepsis, more days of parenteral nutrition and prolonged length of stay.
The gastrointestinal impact of FGR is one of the classic associations described in the field of neonatology. In our study, the observed differences in the incidence of NEC (1.8% in control group vs. 12% in FGR group) were not statistically significant; the redistribution of cerebral blood flow in foetuses with FGR, with cerebral vasodilation and contraction of the splanchnic bed, has been proposed as a possible explanation in several studies.18 Two factors probably contributed to our results: one was the low incidence of NEC in our region, where protocols are in place the nutritional management of preterm and at-risk infants including the breastfeeding promotion and the use of banked human milk, and another, which cannot be overlooked, that patients with FGR may have been subject to more conservative nutritional management with increased watchfulness for signs of oral intolerance, which, combined with low weight status, delays the achievement of full enteral and prolongs the duration of parenteral nutrition, which could have introduced bias in our analysis by reducing the incidence of complications in patients with growth restriction.
When it came to the complete blood count at birth, we did not find significant differences in the red blood cell indices, but there were significant differences in the presence of leukopenia and the neutrophil count at admission. The risk of neutropenia (<1500 neutrophils/mm3) at admission was 5.8 times greater in patients with FGR. The risk of thrombocytopenia in the FGR group was 6 times greater, independently of gestational age and weight. We ought to underscore the strong association between prenatal Doppler findings and the progressive decrease in the platelet count of patients at admission. In the analysis of the FGR III subgroup, the differences in comparison to the rest of the patients (no severe FGR) remained significant, despite the smaller number of patients in the FGR III subgroup. As can be seen in Fig. 3, the platelet count decreased progressively as the umbilical artery Doppler abnormalities became more severe and placental impairment advanced. As a result, 66.7% of patients with severe FGR in our study had thrombocytopenia at admission. We interpret this finding in relation to the progressive platelet consumption of the affected placenta, as evinced in the pathology examination of dysfunctional placentas, with findings including areas of progressive parenchymal infarction and placental thrombosis.10,19
As regards the variables related to the delivery room, few studies have analysed the risk of perinatal asphyxia and the increased need of resuscitation in preterm newborns in relation to the presence of prenatal Doppler abnormalities. In the subgroup analysis in our study adjusted for weight and gestational age (Table 2), infants with moderate FGR and umbilical artery PI values indicative of absent end-diastolic flow were not at increased risk compared to controls during the transition to extrauterine life in the delivery room, without significant differences in Apgar scores or acidosis values. In contrast, FGR III was associated with lower Apgar scores and more severe acidosis, without an increased frequency of intubation or adrenaline use in resuscitation. This information is important to anticipate potential care needs of the newborn infant in the delivery room.
The analysis of anthropometric data considered measurements of newborn infants in both groups at the time of admission (Table 1) and at 36 weeks of postmenstrual age. As can be seen in Fig. 1, the length and weight z scores show a similar degree of extrauterine growth restriction in the entire case group, and the most relevant finding concerned the head circumference, as the infants in the FGR group exhibited substantial catch-up growth, eliminating the significant difference in head circumference compared to controls at 36 weeks of corrected age. The catch-up growth of infants with FGR in the early months of life has been described in many studies, but not this early catch-up in head circumference, which was already apparent at the time of discharge from the neonatal unit. The association of the absence of catch-up growth with improved neurodevelopmental outcomes in children with low birth weight for gestational age is probably related to the fact that it is the group of infants constitutionally small for gestational age that does not exhibit catch-up growth, as they had not experienced growth restriction. Thus, catch-up growth is characteristic of infants small for gestational age with a history of growth restriction, and it is the FGR that probably gives rise to the adverse neurodevelopmental outcomes. The definition of foetal growth restriction based on Doppler criteria will allow confirmation of this fact in future longitudinal studies.20,21
The size of the study sample precludes a more detailed analysis of the group of infants with severe FGR and of patients with severe FGR and reverse flow in the ductus venosus (FGR IV with high suspicion of foetal acidosis in which urgent termination of pregnancy would be indicated). A larger sample size would also allow a broader multivariate analysis including additional prenatal variables besides prenatal Doppler parameters, such as pre-eclampsia, severe pre-eclampsia or HELLP syndrome. This is one of the main limitations of our study, in spite of the multicentre design intended to include the largest possible number of cases. New multicentre studies with more patients are needed to carry out a more detailed analysis. It would also be ideal to conduct longitudinal studies to assess not only perinatal morbidity,22 but also weight and neurodevelopmental outcomes at age 2 years and from age 6 years.23 Numerous studies have found an association between autism spectrum disorder, school failure, low intellectual quotient and attention-deficit hyperactivity disorder with placental insufficiency.13,24–27
In our opinion, the greatest strength of our study was that we were able to recruit a large enough cohort of infants with moderate to severe FGR to detect the increase in morbidity in terms of disorders that affect preterm infants, independent of weight or gestational age, allowing us to warn of the increased perinatal risk of foetuses subjected to the stressors resulting from placental insufficiency leading to undernutrition and chronic hypoxia, with the ultimate objective of promoting the performance of additional studies analysing infants with FGR defined by Doppler criteria.
In conclusion, antenatal Doppler findings can help identify, among preterm newborns, those with a history of placental insufficiency and the severity of FGR. This is important information for the purpose of anticipating the needs of these patients in the delivery room, with an increased risk of complications in the transition to extrauterine life in patients with FGR III. In infants with moderate or severe FGR, independently of gestational age and weight, there is an increase in respiratory morbidity, haematological abnormalities, late-onset sepsis and hypoglycaemia as well as in the days of parenteral nutrition and the length of stay.
FundingThis research did not receive any external funding.
Conflicts of interestThe authors have no conflicts of interest to declare.
Previous meetings: partial results of this study were presented as an oral communication at the XXIX Congress of the Sociedad Española on October 6, 2023 and the LXXIII Annual Congress of the Sociedad de Pediatría de Galicia on November 10, 2023.
