


Cancer is the leading cause of death from disease in children. Some epidemiological aspects of childhood cancer obtained from the Tumour Registry of a tertiary care hospital in Madrid are detailed, in order to provide useful information for the management of cancer in this group of patients.
Material and methodsDescriptive and retrospective analysis of the data from the Hospital's Tumour Registry (period 1999-2016), with the aim of analysing the incidence (overall, and by diagnostic categories) and survival (overall, by diagnostic groups and cohorts of years of diagnosis) of childhood cancer.
ResultsA total of 769 childhood tumours were registered between 1999 and 2016, 431 in boys and 338 in girls. The most common neoplasms were Central Nervous System Tumours (32.5%), leukaemias, myelodysplastic syndromes (MDS) and myeloproliferative syndromes (MPS) (19%); lymphomas (15%), and neuroblastomas (7.5%). Overall 5-year survival was 78%. Five-year survival of these diagnostic categories was 74% (67-81%) for CNS tumours; 80% (72-88%) for leukaemias, MDS and MPS; 87% (80-95%) for lymphomas and reticuloendothelial neoplasms; and 68% (53-84%) for Neuroblastomas and other peripheral nerve cells tumours.
The comparison between two diagnostic cohorts (1999-2004 vs 2005-2010) showed an increase in survival in the most recent cohort, which was only statistically significant in central nervous system tumours.
ConclusionsThese results are similar to those of the Spanish Register of Childhood Tumours. The information provided by the Tumour Registries is necessary for greater knowledge of cancer and to ensure the quality of care for cancer patients.
El cáncer es la primera causa de muerte por enfermedad en niños. Se detallan algunos aspectos epidemiológicos del cáncer infantil obtenidos del Registro de Tumores de un hospital de tercer nivel de Madrid, con el fin de aportar información útil para el manejo del cáncer en este grupo de pacientes.
Material y métodosAnálisis descriptivo y retrospectivo de los datos del Registro de Tumores de un hospital de tercer nivel (periodo 1999-2016), con el objetivo de analizar la incidencia (global y por categorías diagnósticas) y la supervivencia (global, por grupos diagnósticos y por cohortes de años de diagnóstico) del cáncer infantil.
ResultadosEntre 1999 y 2016 se registraron 769 tumores infantiles, 431 en niños y 338 en niñas. Las neoplasias más frecuentes fueron los tumores del sistema nervioso central (32,5%), las leucemias, los síndromes mielodisplásicos y síndromes mieloproliferativos (19%), los linfomas (15%) y los neuroblastomas (7,5%). La supervivencia global a los 5 años fue del 78%. La supervivencia a los cinco años para estas categorías diagnósticas fue del 74% (67-81%) para los tumores del SNC; del 80% (72-88%) para las Leucemias, SMD y SMP; del 87% (80-95%) para los Linfomas y neoplasias reticuloendoteliales; y del 68% (53-84%) para los Neuroblastomas y otros tumores de células nerviosas periféricas.
La comparativa entre dos cohortes de años de diagnóstico (1999-2004 vs 2005-2010) revela un incremento de la supervivencia en la cohorte más reciente, que solo es estadísticamente significativo en los tumores del sistema nervioso central.
ConclusionesNuestros resultados son similares a los del Registro Español de Tumores Infantiles. La información aportada por los Registros de Tumores es necesaria para un mayor conocimiento del cáncer y para garantizar la calidad asistencial de los enfermos oncológicos.
Childhood cancer comprehends all cancers diagnosed in children and adolescents aged less than 15 years, although some classifications include tumours diagnosed up to age 19 years.1 While the incidence of cancer in this age group is low, the decrease in the morbidity and mortality of infectious diseases has led to a growing importance of childhood cancer among the paediatric diseases. The global incidence of childhood tumours is of 300 000 new cases a year.1 In Spain, the incidence is of 155.5 new cases per million children aged 0 to 14 years per year. The cumulative risk of developing cancer in this age group is of 0.29 in boys and 0.23 in girls.1
Based on data from the regions covered by the Spanish Registry of Childhood Tumours (RETI-SEHOP) (Aragon, Catalonia, Madrid, Navarre and Basque Country), which comprehend 39% of the paediatric population in Spain, the crude rate of childhood cancer (age 0-14 years) in year 2000-2012 was of 153 cases per million children, and the age-adjusted standardized rate was of 155 cases (95% confidence interval [CI], 151-159). Childhood tumours differ in many aspects from tumours in adults (epidemiology, clinical manifestations, topography, histology, management and prognosis). In some instances, it is difficult to classify them in the paediatric age range, since tumours that are considered paediatric, such as Ewing sarcoma, are diagnosed at ages no longer considered to be included in childhood or adolescence, such as 19 or even 21 years.
Despite the considerable advances made in recent years, childhood tumours constitute the second leading cause of death in this subset of the population following accidents, and the leading cause of death due to disease in childhood and adolescence from age 1 year.2 Statistics published by the World Health Organization (WHO) indicate that in high-income countries, 80% of childhood cancers are cured, whereas in middle- and low-income countries, only 20% of children with cancer survive due to the inaccessibility of treatments.
Our hospital manages a substantial number of tumours in the paediatric population. The objectives of our study were:
- 1
To calculate the observed incidents of childhood tumours in the 1999-2016 period.
- 2
To present the distribution of tumours by diagnostic group and establish the corresponding incidence for each.
- 3
To study the 5-year survival in the patients (1999-2010 cohort), overall and by diagnostic category.
- 4
To study changes in survival by comparing two cohorts established by diagnosis year (1999-2004 and 2005-2010).
- 5
To compare the most recent data published by the Spanish Registry of Childhood Tumours (RETI-SEHOP) with survival outcomes in patients in our sample corresponding to the same period.
We conducted a retrospective, longitudinal, observational and analytical cohort study.
The source used for data collection was the Hospital Tumour Registry (HTR). The analysis included all CNS and intracranial tumours diagnosed and/or treated between January 1, 1999 and December 31, 2016 in paediatric patients.
We recorded every tumour of any type presented by each patient. Each tumour was considered an individual case, and individual tumours were the unit of analysis in the statistics calculated in the study.
The definitions used in the data of the HTR adhered to the recommendations of the International Agency for Research on Cancer (IARC)3 y la International Association of Cancer Registries (IACR).4
We classified tumours using the first level of the International Classification of Diseases for Oncology, Third Edition (ICD-O-3), which groups childhood tumours into 12 diagnostic categories.5
We summarized the data as absolute and relative frequencies or as mean and standard deviation based on the type of variable. We compared study groups by means of the chi square test, the Fisher exact test or the Student t test, as applicable.
We defined the duration of follow-up as the time elapsed between diagnosis and the date of death (obtained from the National Death Index) or the date of the last contact, obtained from the records of the last hospital visit of the patient (appointments, hospitalizations, emergency visits, or other). We calculated the median duration of follow-up including every patient. We calculated the 1-year, 3-year and 5-year survivals with the Kaplan-Meier method with a 95% CI, including only cases diagnosed in 1999 or 2010 in the survival analysis to have 5 full years of follow-up for all cases. We performed analysis for subgroups established by age, sex, tumour extension and diagnosis year cohort (1999-2004 and 2005-2010). We compared survival values between subgroups using the long-rank test. To quantify these changes, we calculated the hazard ratio with the corresponding 95% CI for each subgroup by fitting a Cox regression model for survival 5 years after diagnosis.
We did not generate survival curves when the case count in a cohort was less than 20, the minimum necessary to obtain interpretable results.6
The statistical analysis was performed with the software SPSS version 22.
ResultsA total of 59 023 new tumours were registered in the 1999-2016 period, of which 769 (1.3%) were diagnosed in patients aged less than 15 years. There was a predominance of male patients (431; 56%) compared to female (338; 44%), corresponding to a sex ratio of 1:3, and the median age at diagnosis was 6.5 ± 4.6 years in boys and 7.2 ± 4.8 years for girls, with a difference that was not statistically significant.
In 94.6% of cases, the diagnosis was made based on cytological and histological features.
In both sexes, the most frequent age of diagnosis of cancer overall was in the first 5 years of life (42.7% of total cases). Until age 10 years, new cases were more frequent in boys, and from that age up the incidence was the same in both sexes (Fig. 1), although the differences based on age or sex were not significant.

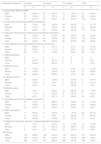
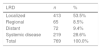
Table 1 presents the case distribution by diagnostic group, sex and age group. Most tumours were localized at the primary site (Table 2).
Case distribution by diagnostic category, sex and age group, 1999-2016.
| Diagnostic categories | 0-4 years | 5-9 years | 10-14 years | Total | ||||
|---|---|---|---|---|---|---|---|---|
| n | % | n | % | n | % | n | % | |
| I. Leukaemias, MDD and MPD | ||||||||
| Male | 41 | 50.6% | 25 | 30.9% | 15 | 18.5% | 81 | 55.5% |
| Female | 33 | 50.8% | 15 | 23.1% | 17 | 26.2% | 65 | 44.5% |
| Total | 74 | 50.7% | 40 | 27.4% | 32 | 21.9% | 146 | 19.0% |
| II. Lymphomas and reticuloendothelial neoplasms | ||||||||
| Male | 22 | 31.0% | 25 | 35.2% | 24 | 33.8% | 71 | 61.7% |
| Female | 12 | 27.3% | 7 | 15.9% | 25 | 56.8% | 44 | 38.3% |
| Total | 34 | 29.6% | 32 | 27.8% | 49 | 42.6% | 115 | 15.0% |
| III. CNS and miscellaneous intracranial and intraspinal neoplasms | ||||||||
| Male | 57 | 43.5% | 41 | 31.3% | 33 | 25.2% | 131 | 52.4% |
| Female | 44 | 37.0% | 39 | 32.8% | 36 | 30.3% | 119 | 47.6% |
| Total | 101 | 40.4% | 80 | 32.0% | 69 | 27.6% | 250 | 32.5% |
| IV. Neuroblastoma and other peripheral nervous cell tumours | ||||||||
| Male | 15 | 68.2% | 5 | 22.7% | 2 | 9.1% | 22 | 37.9% |
| Female | 30 | 83.3% | 4 | 11.1% | 2 | 5.6% | 36 | 62.1% |
| Total | 45 | 77.6% | 9 | 15.5% | 4 | 6.9% | 58 | 7.5% |
| V. Retinoblastomas | ||||||||
| Male | 0 | 0 | 0 | 0 | 0 | 0 | 0 | 0 |
| Female | 3 | 60.0% | 2 | 40.0% | 0 | 0 | 5 | 100 |
| Total | 3 | 60.0% | 2 | 40.0% | 0 | 0 | 5 | 0.7% |
| VI. Renal tumours | ||||||||
| Male | 17 | 77.3% | 4 | 18.2% | 1 | 4.5% | 22 | 51.2% |
| Female | 13 | 61.9% | 7 | 33.3% | 1 | 4.8% | 21 | 48.8% |
| Total | 30 | 69.8% | 11 | 25.6% | 2 | 4.7% | 43 | 5.6% |
| VII. Hepatic tumours | ||||||||
| Male | 4 | 50.0% | 1 | 12.5% | 3 | 37.5% | 8 | 72.7% |
| Female | 1 | 33.3% | 0 | 0.0% | 2 | 66.7% | 3 | 27.3% |
| Total | 5 | 45.5% | 1 | 9.1% | 5 | 45.5% | 11 | 1.4% |
| VIII. Bone tumours | ||||||||
| Male | 1 | 4.3% | 7 | 30.4% | 15 | 65.2% | 23 | 71.9% |
| Female | 1 | 11.1% | 2 | 22.2% | 6 | 66.7% | 9 | 28.1% |
| Total | 2 | 6.3% | 9 | 28.1% | 21 | 65.6% | 32 | 4.2% |
| IX. Soft tissue and other extraosseous sarcomas | ||||||||
| Male | 10 | 40.0% | 9 | 36.0% | 6 | 24.0% | 25 | 71.4% |
| Female | 5 | 50.0% | 3 | 30.0% | 2 | 20.0% | 10 | 28.6% |
| Total | 15 | 42.9% | 12 | 34.3% | 8 | 22.9% | 35 | 4.6% |
| X. Germ cell tumours | ||||||||
| Male | 11 | 55.0% | 6 | 30.0% | 3 | 15.0% | 20 | 54.1% |
| Female | 6 | 35.3% | 1 | 5.9% | 10 | 58.8% | 17 | 45.9% |
| Total | 17 | 45.9% | 7 | 18.9% | 13 | 35.1% | 37 | 4.8% |
| XI. Malignant melanomas and other malignant epithelial neoplasms | ||||||||
| Male | 1 | 7.1% | 3 | 21.4% | 10 | 71.4% | 14 | 37.8% |
| Female | 1 | 4.3% | 9 | 39.1% | 13 | 56.5% | 23 | 62.2% |
| Total | 2 | 5.4% | 12 | 32.4% | 23 | 62.2% | 37 | 4.8% |
| All tumours | ||||||||
| Male | 179 | 42.9% | 126 | 30.2% | 112 | 26.9% | 417 | 54.2% |
| Female | 149 | 42.3% | 89 | 25.3% | 114 | 32.4% | 352 | 45.8% |
| Total | 328 | 42.7% | 215 | 28.0% | 226 | 29.4% | 769 | 100% |
Age group columns: The percentages shown are over the total for the row, not the overall total, and they do not add up to the percentage in the “total” column.
The percentages that accompany the total, male and female absolute frequencies in each age group refer to the percentage that the corresponding absolute frequency represents relative to the total number of cases in that diagnostic category.
Total column: In each diagnostic category, the percentages that accompany the absolute frequencies for each sex indicate the percentage corresponding to each sex out of the total number of cases in that diagnostic category. The percentage that accompanies the “total” absolute frequency represents the percentage that this diagnostic category represents out of the total indicated in the “All tumours” row (769 cases).
The most frequent types of childhood cancer were:
- 1)
CNS and miscellaneous intracranial & intraspinal neoplasms (32.5%).
- 2)
Leukaemias, myeloproliferative diseases (MPD), and myelodysplastic diseases (MDD) (19%).
- 3)
Lymphomas and reticuloendothelial neoplasms (15%).
- 4)
Neuroblastomas and other peripheral nervous cell tumours
- 5)
Retinoblastoma (7.5%).
When it came to the distribution by sex, we found that the order by frequency of tumour types was the same, with a higher incidence in boys compared to girls except for retinoblastomas and the category of melanomas and other malignant epithelial neoplasms.
In the analysis by age group, we found that the incidence of most tumours (save for lymphomas and reticuloendothelial neoplasms, bone tumours and melanomas and other malignant epithelial neoplasms) was highest in patients aged less than 5 years (Fig. 2).

In the group of cases diagnosed between 1999 and 2010, the 5-year overall survival for all types of tumours was 78% (95% confidence interval [CI], 74%-82%), with a median duration of follow-up of 85 months. There were no significant differences in survival based on sex (Fig. 3).
 in patients aged 0-14 years.")
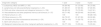
The 5-year survival in the most frequent diagnostic categories was: 74% (67%-81%) in CNS tumours; 80% (72%-88%) in leukaemias, MPD and MDD; 87% (80%-95%) in lymphomas and reticuloendothelial neoplasms; and 68% (53%-84%) in neuroblastomas and other peripheral nervous cell tumours (Table 3).
One-, three- and five-year survival for different diagnostic categories with case counts greater than 20 expressed as percentage and 95% confidence interval. Age 0-14 years, 1999-2010 period.
| Diagnostic category | 1-year | 3-year | 5-year |
|---|---|---|---|
| I. Leukaemias, MDD and MPD (n = 95) | 90 (84-96) | 81 (73-89) | 80 (72-88) |
| II. Lymphomas and reticuloendothelial neoplasms (n = 83) | 91 (85-97) | 87 (80-95) | 87 (80-95) |
| III. CNS and other intracranial and intraspinal tumours (n = 158) | 88 (83-93) | 79 (72-85) | 74 (67-81) |
| IV. Neuroblastoma and other peripheral nervous cell tumours (n = 37) | 83 (71-96) | 68 (53-84) | 68 (53-84) |
| VI. Renal tumours (n = 27) | 100 | 100 | 96 (88-100) |
| VIII. Bone tumours (n = 33) | 84 (72-97) | 81 (67-95) | 69 (52-86) |
| IX. Soft tissue and other extraosseous sarcomas (n = 24) | 88 (74-100) | 70 (52-79) | 61 (41-81) |
| X. Germ cell tumours (n = 23) | 100 | 100 | 95 (85-100) |
| XI. Malignant melanomas and other malignant epithelial neoplasms (n = 20) | 90 (77-100) | 74 (55-94) | 74 (55-94) |
When we compared male and female patients, we did not find statistically significant differences in survival within each diagnostic category, although there was a trend toward a greater survival in girls in the lymphoma and reticuloendothelial neoplasm category and a greater survival in boys in the CNS tumours and the leukaemias, MDD and MPD categories (Table 4).
Five-year survival for the main diagnostic categories by sex expressed as percentage and 95% confidence interval. Age 0-14 years, 1999-2010 period.
| Diagnostic categorya | 5-year survival (95% CI) | |
|---|---|---|
| Male | Female | |
| I. Leukaemias, MMD and MPD | 80 (68-91) | 78 (65-91) |
| II. Lymphomas and reticuloendothelial neoplasms | 84 (75-94) | 90 (79-101) |
| III. CNS and other intracranial and intraspinal tumours | 74 (64-83) | 67 (56-79) |
In the comparison of 5-year survival for childhood tumours overall by diagnostic year cohort (1999-2004 vs 2005-2010), we found that survival increased with time (76% vs 81%), although the difference was not statistically significant (Fig. 3).
When we compared the two time cohorts in each diagnostic category, we found that survival improved in the most recent cohort in nearly every category, although the difference only was statistically significant in the CNS and other intracranial and intraspinal tumours category (67% vs 80%; P < .05) (Fig. 4).
 in patients aged 0-14 years.")
The hazard ratio (Cox regression) calculated to assess differences in mortality risk in patients with CNS tumours in both time cohorts was −0.51 (95% CI), which indicates that patients with CNS tumours in the 1999-2004 cohort were twice as likely to die from the tumour than patients with CNS tumours in the more recent cohort (2005-2010).
Discussion and conclusionsThe Hospital Tumour Registry is a database holding health records of patients with cancer managed in the health care facilities affiliated to our hospital. Its purpose is, among others, to facilitate studies on the incidence, mortality and survival of patients by type of tumour, age, extension of tumour at the time of diagnosis and other variables. It is also an essential tool in evaluating the quality of health care services offered to cancer patients.
In our hospital, childhood tumours amounted to 1.3% of the total tumours managed between 1999 and 2016, and in more than half of the cases the tumour was diagnosed when it was still localized and limited to the primary site. We found a higher frequency in boys compared to girls, overall and for most tumour types. These findings were consistent with the data recorded for Spain and Europe.6,7
At the national level, the Spanish Registry of Childhood Tumours (RETI-SEHOP) has been operative since 1980. It collects data through the voluntary notification of cases from departments of paediatric oncology in Spanish public hospitals. It also collects data on cases of childhood cancer recorded in Spanish population-based registries.
The most frequent diagnostic category in our hospital corresponded to CNS tumours, in disagreement with the data collected by the RETI-SEHOP, in which the leading type of cancer is leukaemia.6–9 A likely explanation is that our hospital is a national referral centre for paediatric neurosurgery. The distribution of the rest of the categories was similar to the distributions reported for all of Spain and Europe.
In our case series, the 5-year survival for childhood tumours overall in the 2005-2007 period was 78% (74%-82%), similar to the survival reported for all of Spain in the same time period (76%; 95% CI, 74%-78%).9 We did not find statistically significant differences in survival based on sex.
When we compared the diagnostic year cohorts in each diagnostic category, we found that survival improved in the more recent cohort (2005-2010) in nearly all categories, although the difference was only significant in the CNS tumours category (increase by 13 percent points in the second cohort). Patients given a diagnosis of CNS tumour in the first cohort (1999-2004) had a 2-fold risk of dying from the tumour compared to patients diagnosed in the more recent time period.
We owe the increase in overall survival in paediatric patients with cancer to improvements and advances in early diagnosis, basic and translational research, clinical trials, drug development, radiation sources, surgical techniques and multidisciplinary approaches to treatment.
Tumour registries play an important role in the recruitment of patients for these studies. Clinical research is based on collaborative studies, usually of international scope.9,10
The survival outcomes of patients aged less than 15 years in our case series were similar to those reported in larger case series. However, there are some aspects that must be taken into account. We retrieved the data from a hospital tumour registry, as opposed to a population-based registry. Furthermore, the data were collected in a tertiary care hospital that is a referral hospital at the regional and national level and carries out numerous clinical trials. All of the above can be a source of bias in calculating survival in paediatric cancer patients.
Our results were similar to those of the Spanish Registry of Childhood tumours. The data contributed by tumour registries is necessary to expand our knowledge of cancer and guarantee the quality of the care provided to patients with cancer. Our findings allow comparisons with historical cohorts and other hospitals and can guide treatment planning.
An interesting possibility for future research would be to continue analysing cases in upcoming years in order to identify trends. The ultimate purpose would be to provide data to administrations to allow improvements in resource management and planning.
Conflicts of interestThe authors have no conflicts of interest to declare.
Please cite this article as: Pilas M, Toldos Ó, María Muñoz A, Salamanca J. Cáncer en el Hospital 12 de Octubre de Madrid. Evolución en la supervivencia. Años 1999-2016. An Pediatr (Barc). 2020;93:403–410.
