


Occasionally, primary care paediatricians notice the presence of small clusters of paediatric cancer (PC), but are often frustrated by the findings after statistical analysis. The study of small areas in spatial epidemiology has led to advances in identifying clusters and the environmental risk factors involved. The purpose of this study was to describe the PC incidence and the spatial distribution at the minimum level of disaggregation possible in Murcia, presenting the first urban municipality map of PC in Spain.
Materials and methodsA population-based descriptive study was conducted on the PC cases diagnosed in children younger than 15 years, between 1998 and 2013 in the municipality of Murcia. Cases were classified by sex, age group, and tumour type. Coordinates of home addresses at the time of diagnosis were assigned to each case, and spatial and spatio-temporal analyses were carried out at the level of census tracts, using FleXScan and SatScan.
ResultsA total of 155 cases of PC were diagnosed during this period. The overall incidence of PC (138x106 of children under the age of 15) and the incidence for individual tumour types were within the expected ranges for Europe. A spatio-temporal cluster of Hodgkin lymphoma was identified.
ConclusionsSmall area analysis of PC cases may be a useful tool for the identification of PC clusters, which would allow for the generation of hypotheses regarding disease aetiology, as well as developing urban models for environmental surveillance of PC.
Ocasionalmente, los pediatras, sobre todo los de Atención Primaria, alertan de la presencia de pequeños agrupamientos de casos de cáncer pediátrico (CP) y con frecuencia sus expectativas se ven frustradas al aplicar los métodos estadísticos. El estudio de áreas pequeñas en epidemiología espacial ha permitido realizar algunos avances en la identificación de clústeres y de los factores de riesgo medioambientales implicados. El objetivo de este trabajo es describir la incidencia del CP y la distribución espacial a nivel de sección censal, así como presentar el primer mapa urbano municipal de CP de España.
Material y métodosEstudio descriptivo de base poblacional, por sexo, grupos de edad, subperiodos y tipo tumoral de los casos de CP diagnosticados en menores de 15 años, entre 1998 y 2013 en el municipio de Murcia. Georreferenciación de casos en el momento del diagnóstico y análisis de clústeres espaciales y espacio-temporales a nivel de sección censal mediante los estadísticos FleXScan y SatScan.
ResultadosUn total de 155 casos fueron diagnosticados. La incidencia global (138 por millón de niños menores de 15 años) y por tipos tumorales está dentro de los márgenes de referencia del área europea. Identificación de un clúster espacio-temporal de linfomas de Hodgkin.
ConclusionesEl análisis de áreas pequeñas de los casos diagnosticados de CP es una herramienta útil para identificar clústeres de casos que permita plantear hipótesis sobre las causas que originan la enfermedad y desarrollar modelos urbanos de vigilancia ambiental del cáncer infantil.
Sometimes paediatricians, especially those working in a primary care setting, warn of the presence of a small cluster of paediatric cancer (PC) in their health district. Most of the time, the analysis of such clusters shows that they are not statistically significant. Paediatric cancer is a multifactorial disease that results from the interaction of genetic and environmental factors during critical periods in development.1 Some risk factors (RFs) have been identified, but the aetiology of PC remains unclear. Spatial epidemiology methods have brought on advances in cluster identification and in the development of models that attempt to associate disease clusters with relevant RFs.2 The low incidence of PC, the high degree of uncertainty when it comes to the associated factors, and its occurrence in small clusters emphasise the need to perform spatial analysis of cancer incidence in smaller urban areas.3 Some experiences in this field have demonstrated its potential to identify geographical areas with a higher-than-expected incidence of cancer, allowing a deeper exploration of the postulated aetiologies.4–8 The aim of this study was to determine the incidence, generate an urban map and perform cluster analysis of PC cases in the municipality of Murcia.
Materials and methodsNew cases of PC (age<15 years) diagnosed between 1998 and 2013 in the municipality of Murcia and classified according to the International Childhood Cancer Classification (ICCC-3). The fact that the study was conducted in a single province and that there is a regional reference unit for paediatric oncology and haematology facilitated the registration of all diagnosed cases in the Medio Ambiente y Cáncer Pediátrico (Environment and Paediatric Cancer) database of the Region of Murcia (MACAPEMUR) that documents the pediatric environmental history of incident cases since 2003 and prevalent cases since 1998.1,4,9 We also searched the SELENE database (UTE Siemens-Indra, Madrid) and the OMIap primary care database (Stacks, Consulting e Ingeniería en Software, S.L.U., Barcelona). Patients that resided outside the municipality of Murcia at the time of diagnosis or that were temporarily residing in Murcia to get a second opinion or receive treatment after diagnosis were excluded from the study. We identified a total of 155 cases diagnosed between 1998 and 2013. We communicated with these patients by phone or in face-to-face interviews. We obtained the addresses of the 154 patients that agreed to participate for three different periods (prenatal, postnatal and at the time of diagnosis). One patient refused to participate in the study.
The project was approved by the Ethics and Research Committee of the Hospital Clínico Universitario Virgen de la Arrixaca. We obtained the informed consent of all the parents and of children aged more than 12 years.
PopulationThe Region of Murcia (RM) is an autonomous community in the Mediterranean coast of southeast Spain. The municipality of Murcia is the most populated in the RM, with a total of 441,354 inhabitants in 2012, of whom 77,087 were younger than 15 years. The municipality is divided into 386 census tracts (CTs)10 that contain a minimum of 67 and a maximum of 571 children (age<15 years).
Statistical methodsWe performed a statistical analysis by time period and age, sex, incidence rate (IR), standardised incidence ratio (SIR) with confidence intervals (CIs) and survival by type of tumour. We calculated the SIR by the indirect method of standardisation, using the age-specific rates in the municipality of Murcia for the entire 1998–2013 period as reference for the calculation of SIRs for each subperiod. We also calculated SIRs for the entire period for each age group (indirect method) using the age-specific rates for the entire RM as reference.
To identify the presence of clusters, we assigned each case the CT that corresponded to the patient's address at the time of diagnosis using a geographic information system software (ArcView) and the digital maps provided by the Instituto Nacional de Estadística (National Institute of Statistics).11 We assumed that the number of cases per CT fit a Poisson distribution.
The spatial distribution of incidence rates smoothed by the empirical Bayes method (EB)12 is shown in box maps in which the CTs with outliers are highlighted.
To assess spatial heterogeneity, we calculated global Moran's I statistics with EB smoothing13 and local indicators of spatial association (LISAs) using the GeoDA freeware version 0.9.9.
We applied the spatial scan method14 to identify high-incidence spatial clusters using a flexible window with the FleXScan freeware version 3.1.2.15 We used the elliptical version16 of the spatial scan statistic to identify space-time clusters by means of the SatScan software version 9.3 (http://www.satscan.org/). The settings applied were an elliptic scanning window and a maximum cluster size of 30% of the population (analyses performed with different settings yielded similar results). Statistical significance was defined as P<.05.
We performed the analysis both for the total cases and for the five most frequent types of tumours: leukaemias, lymphomas, central nervous system tumours (CNSTs) and sympathetic nervous system tumours (SNSTs).
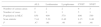
ResultsTable 1 shows the classification of cases by tumour type, sex, age, age at diagnosis in years, and survival rates. Leukaemias, CNSTs, SNSTs and lymphomas were the most common types of tumour. The 5-year survival rates were 71% (1998–2001) and 75% (2006–2009). Table 2 presents the IRs, SIRs and 95% CIs. The incidence of PC in the municipality of Murcia was 138 cases per million children (age<15 years) per year, with an incidence rate of 0.91 (0.77–1.26), similar to the rest of the RM. In terms of the types of tumour under analysis, we observed a higher SIR of leukaemia at the beginning of the period under study.
Diagnosed cases by type of tumour, sex, age, subperiod and survival rate.
| Total (%) | Sex (n) | Age groups (n) | Subperiods (n) | 5-Year survival (%) | ||||||||||
|---|---|---|---|---|---|---|---|---|---|---|---|---|---|---|
| Male | Female | <1 | 1–4 | 5–9 | 10–14 | 98–01 | 02–05 | 06–09 | 10–13 | 98–01 | 02–05 | 06–09a | ||
| Leukaemias | 39 (25.2) | 20 | 19 | 8 | 18 | 9 | 4 | 12 | 10 | 9 | 8 | 83.3 | 90.0 | 88.9 |
| ALL | 26 (16.8) | 17 | 9 | 3 | 17 | 6 | 0 | 6 | 8 | 7 | 5 | 100.0 | 100.0 | 85.7 |
| AML | 10 (6.5) | 3 | 7 | 5 | 1 | 3 | 1 | 4 | 1 | 2 | 3 | 75.0 | 0.0 | 100.0 |
| Other | 3 (1.9) | 0 | 3 | 0 | 0 | 0 | 3 | 2 | 1 | 0 | 0 | 50.0 | 100.0 | – |
| Lymphomas | 17 (11.0) | 11 | 6 | 1 | 1 | 10 | 5 | 4 | 6 | 0 | 7 | 75.0 | 83.3 | – |
| HL | 8 (5.2) | 5 | 3 | 1 | 0 | 4 | 3 | 2 | 2 | 0 | 4 | 50.0 | 100.0 | – |
| NHL | 9 (5.8) | 6 | 3 | 0 | 1 | 6 | 2 | 2 | 4 | 0 | 3 | 100.0 | 75.0 | – |
| CNS tumours | 38 (24.5) | 22 | 16 | 6 | 15 | 9 | 8 | 6 | 12 | 7 | 13 | 50.0 | 66.7 | 71.4 |
| Astrocytoma | 14 (9.0) | 8 | 6 | 0 | 6 | 5 | 3 | 3 | 6 | 2 | 3 | 33.3 | 50.0 | 100.0 |
| Medulloblastoma | 9 (5.8) | 7 | 2 | 1 | 4 | 1 | 3 | 3 | 3 | 1 | 2 | 66.7 | 66.7 | 100.0 |
| Ependymoma | 2 (1.3) | 0 | 2 | 1 | 0 | 1 | 0 | 0 | 1 | 1 | 0 | – | 100.0 | 100.0 |
| Craniopharyngioma | 2 (1.3) | 1 | 1 | 0 | 1 | 0 | 1 | 0 | 1 | 1 | 0 | – | 100.0 | 100.0 |
| Other | 11 (7.1) | 6 | 5 | 4 | 4 | 2 | 1 | 0 | 1 | 2 | 8 | – | 100.0 | 0.0 |
| SNS tumours | 17 (11.0) | 14 | 3 | 10 | 4 | 1 | 2 | 4 | 5 | 5 | 3 | 50.0 | 100.0 | 80.0 |
| Neuroblastoma | 13 (8.4) | 10 | 3 | 10 | 2 | 1 | 0 | 3 | 4 | 4 | 2 | 66.7 | 100.0 | 75.0 |
| Other | 4 (2.6) | 4 | 0 | 0 | 2 | 0 | 2 | 1 | 1 | 1 | 1 | 0.0 | 100.0 | 100.0 |
| Retinoblastoma | 4 (2.6) | 1 | 3 | 1 | 3 | 0 | 0 | 0 | 2 | 1 | 1 | – | 100.0 | 100.0 |
| Kidney tumours | 8 (5.2) | 2 | 6 | 1 | 6 | 1 | 0 | 0 | 2 | 4 | 2 | – | 50.0 | 75.0 |
| Liver tumours | 5 (3.2) | 2 | 3 | 3 | 2 | 0 | 0 | 0 | 2 | 2 | 1 | – | 50.0 | 100.0 |
| Malignant bone tumours | 9 (5.8) | 2 | 7 | 0 | 1 | 4 | 4 | 1 | 0 | 5 | 3 | 100.0 | – | 40.0 |
| Soft tissue tumours | 7 (4.5) | 5 | 2 | 3 | 2 | 1 | 1 | 3 | 2 | 0 | 2 | 100.0 | 100.0 | – |
| Germ cell tumours | 5 (3.2) | 2 | 3 | 2 | 0 | 2 | 1 | 2 | 1 | 1 | 1 | 50.0 | 100.0 | 100.0 |
| Other malignant neoplasms | 6 (3.9) | 4 | 2 | 0 | 2 | 1 | 3 | 0 | 4 | 2 | 0 | – | 100.0 | 50.0 |
| Total | 155 (100.0) | 85 | 70 | 35 | 54 | 38 | 28 | 32 | 46 | 36 | 41 | 71.9 | 82.6 | 75.0 |
Grouped according to the International Classification of Diseases for Oncology (ICD-O-3) and the International Classification of Childhood Cancer.
ALL, acute lymphoblastic leukaemia; AML, acute myeloblastic leukaemia; HL, Hodgkin lymphoma; NHL, non-Hodgkin lymphoma; n, number of cases; CNS, central nervous system; SNS, sympathetic nervous system.
Raw rates and SIRs by period for total cases and most frequent types of tumour.
| Period | 98–01 | 02–05 | 06–09 | 10–13 | Totala |
|---|---|---|---|---|---|
| Total cases | |||||
| n | 32 | 46 | 36 | 41 | 155 |
| CIR | 126.1 | 169.9 | 123.9 | 133.6 | 138.1 |
| SIR | 0.92(0.78–1.07) | 1.34 (1.14–1.56) | 0.86 (0.73–1.00) | 0.93 (0.79–1.08) | 0.91 (0.77–1.26) |
| Leukaemias | |||||
| n | 12 | 10 | 9 | 8 | 39 |
| CIR | 47.3 | 36.9 | 31.0 | 26.1 | 34.8 |
| SIR | 1.43 (1.01–1.90) | 1.07 (0.76–1.43) | 0.87 (0.62–1.16) | 0.73 (0.52–0.98) | 0.81 (0.71–1.34) |
| Lymphomas | |||||
| n | 4 | 6 | 0 | 7 | 17 |
| CIR | 15.8 | 22.2 | – | 22.8 | 15.2 |
| SIR | 1.02 (0.59–1.54) | 1.47 (0.86–2.22) | – | 1.51 (0.86–2.29) | 0.95 (0.58–1.53) |
| CNSTs | |||||
| n | 6 | 12 | 7 | 13 | 38 |
| CIR | 23.6 | 44.3 | 24.1 | 42.4 | 33.9 |
| SIR | 0.72 (0.51–0.96) | 1.31 (0.93–1.76) | 0.70 (0.50–0.94) | 1.24 (0.87–1.65) | 0.95 (0.71–1.34) |
| SNSTs | |||||
| n | 4 | 5 | 5 | 3 | 17 |
| CIR | 15.8 | 18.5 | 17.2 | 9.8 | 15.2 |
| SIR | 1.11 (0.65–1.68) | 1.21 (0.71–1.83) | 1.08 (0.63–1.64) | 0.64 (0.37–0.97) | 1.08 (0.58–1.53) |
n, number of cases; SIR, standardised incidence ratio with 95% confidence intervals; CIR, crude incidence rate (per million children aged less than 15 years in the municipality of Murcia); CNST, central nervous system tumour; sympathetic nervous system tumour.
In bold: SIR outside the CIs of the overall SIR.
Fig. 1 shows the box map of the overall incidence rates of PC smoothed by the EB method. A total of nine CTs were identified as upper outliers (pictured red in the map). The Moran's I statistics for overall PC, leukaemia, lymphoma, CNSTs and SNSTs were I=0.023 (P=.18), I=−0.060 (P=.47), I=−0.017 (P=.34), I=−0.044 (P=.05) and I=−0.011 (P=.47), respectively.

Fig. 2 shows the LISAs for the four most frequent types of tumour. It highlights the CTs with high LISAs surrounded by other CTs with high values (high–high). We did not find any high–high CTs for leukaemia or SNSTs. We found two high–high CTs for CNSTs, indicating the presence of a probable cluster. We also found one high–high CT for lymphoma.
. Sections in blue (low–low) correspond to census tracts with low incidence rates surrounded by other low-incidence areas. We found high-incidence hot spots for CNSTs and lymphoma. The analysis of lymphoma cases grouped together Hodgkin and non-Hodgkin lymphoma cases. EB, empirical Bayes method; LISA, local indicator of spatial association; CNSTs, central nervous system tumours.")
LISAs with EB smoothing. Most frequent tumour types in the municipality of Murcia.
Sections in red correspond to census tracts with high incidence rates of paediatric cancer surrounded by other high-incidence areas (high–high). Sections in blue (low–low) correspond to census tracts with low incidence rates surrounded by other low-incidence areas. We found high-incidence hot spots for CNSTs and lymphoma. The analysis of lymphoma cases grouped together Hodgkin and non-Hodgkin lymphoma cases.
EB, empirical Bayes method; LISA, local indicator of spatial association; CNSTs, central nervous system tumours.
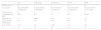
Table 3 summarises the obtained data by means of the flexible spatial scan statistic (FleXScan). None of the spatial clusters achieved significance at 95% confidence, and only CNSTs approached significance with a P-value of .06, with a total of five cases diagnosed in four contiguous CTs.
Most likely spatial cluster, flexible shape (FleXScan).
| ALL | Leukaemias | Lymphomas | CNST | SNST | |
|---|---|---|---|---|---|
| Number of census areas | 5 | 2 | 2 | 4 | 3 |
| Number of cases | 9 | 3 | 3 | 5 | 3 |
| Population in MLC | 850 | 409 | 570 | 800 | 589 |
| Scan statistic | 7.44 | 5.20 | 6.40 | 8.15 | 6.46 |
| P | .47 | .90 | .49 | .06 | .46 |
ALL, acute lymphoblastic leukaemia; MLC, most likely cluster; CNST, central nervous system tumour; SNST, sympathetic nervous system tumour.
Table 4 shows the most likely space-time clusters identified by SatScan. A small cluster (P=.04) formed by two contiguous CTs identified an area where three lymphoma cases were diagnosed within 2 years (between July 2011 and June 2013).
Most likely space-time cluster, elliptical shape (SatScan).
| ALL | Leukaemias | Lymphomas | CNST | SNST | |
|---|---|---|---|---|---|
| Number of CTs | 21 | 2 | 2 | 18 | 52 |
| Time period | From 01/07/2002 to 30/06/2007 | From 01/01/2012 to 30/06/2012 | From 01/07/2011 to 30/06/2013 | From 01/07/2001 to 30/06/2005 | From 01/07/2001 to 31/12/2007 |
| Observed cases | 14 | 2 | 3 | 6 | 7 |
| Population inside MLC | 4420 | 492 | 570 | 4092 | 10,650 |
| Expected cases | 3.11 | 0.008 | 0.018 | 0.57 | 1.07 |
| Cases/100,000 inhabitants/yr | 633 | 813 | 2632 | 367 | 101 |
| Scan statistic | 11.29 | 9.2 | 11.89 | 9.64 | 9.03 |
| P | .31 | .61 | .04 | .44 | .45 |
Statistical significance, P<.05.
CT, census tract; MLC, most likely cluster; ALL, acute lymphoblastic leukaemia; CNST, central nervous system tumour; SNST, sympathetic nervous system tumour.
Expected cases in MLC: (TC/106).
Annual cases per million: (number of cases in MLC)×106/(population in MLC)×(years in MLC)×(population in MLC)×(years in MLC).
Fig. 3 shows the location of the spatial cluster of CNSTs and the space-time cluster of lymphomas, marking the cases that constitute the cluster with red dots and the rest of cases with black dots. In the statistically significant cluster of lymphomas, the addresses at diagnosis for two cases corresponded to two contiguous buildings in the same street, while the address for the third case was at a distance of 200m from the other two.
Discussion
This is the first study of georeferenced data and small-area analysis for PC at the municipality level conducted in Spain. The overall incidence of PC is within the reference range for the European region, which varies between 130 and 160 cases per million children aged less than 15 years.17 The overall survival was 77%, similar to the survival found in other European regions.18 Our study found a statistically significant space-time cluster of three cases of lymphoma in the neighbourhood of Casillas. Further investigation revealed that all three were cases of nodular sclerosis Hodgkin lymphoma (HL). Table 5 summarises the review of the medical history of the three cases. In our opinion, unlike what occurs with cancer in adulthood, the identification of these small clusters is perceived as important by the affected individuals and a source of alarm by primary care paediatricians, and requires the analysis of georeferenced data for small areas by spatial epidemiology methods capable of detecting existing differences. The need to use differential analysis techniques in the study of PC19 stems from the low prevalence of PC, the uncertainty surrounding the associated RFs, the tendency of PC to appear in small clusters, and the importance of parental factors (genetics and lifestyle) and person-to-person contact.
Summary of the space-time cluster of lymphoma cases.
| Case 1 | Case 2 | Case 3 | |
|---|---|---|---|
| Sex | Female | Female | Male |
| Date of birth | September 2000 | May 2002 | August 2007 |
| Signs at onset | Lump in neck (April 2011) | Lump in neck (February 2012) | Lump in neck (February 2012) |
| Date of diagnosis | June 2011 | May 2012 | April 2013 |
| Age at diagnosis (years) | 10 | 9 | 5 |
| Classification | HL IIa | HL IIb | HL IIa |
| Subtype | Nodular sclerosis | Nodular sclerosis | Nodular sclerosis |
| EBV serology at diagnosis | IgG EBNA +IgG VCA +IgG early −IgM VCA − | IgG EBNA −IgG VCA −IgG early −IgM VCA − | IgG EBNA +IgG VCA +IgG early −IgM VCA − |
| Herpes simplex virus serology | IgG +IgM − | IgG −IgM − | IgG +IgM − |
| Periconceptional smoking | Both parents smoked | Both parents smoked | Both parents smoked |
| Temporary breastfeeding | 9 months | 10 months | 4 months |
| Number of siblings | 1 | 2 | 0 |
| Atopy in patientAtopy in family (father) | NoNo | UrticariaChronic urticaria | AsthmaAsthma |
EBNA, Epstein–Barr nuclear antigen; Ig, immunoglobulin; HL, Hodgkin lymphoma; VCA, viral capsid antigen; EBV, Epstein–Barr virus.
Census tracts are the smallest geographical units for which population structure data are available. They have strictly defined boundaries and result from the subdivision of the municipality for electoral purposes. The analysis and mapping of data for small geographical areas can help identify clusters and generate and test aetiological hypotheses.3
We know very little about the environmental risk factors for HL in children younger than 15 years because the incidence of disease is very low in this age group (5.6 cases/106 children<15 years).20 To date, a higher risk of HL has been associated with lower family socioeconomic status at birth, male sex (especially in early childhood), infection by Epstein–Barr virus (EBV) and increasing family size.21,22 Associations with other factors described in the literature, such as the family's genetic load for cancer and parental occupation in a wood-related industry, were not observed in our study.22 The presence of aggregated or clustered cases of LH is a known risk factor for this type of tumour.20–24 Some authors have proposed infectious aetiologies, such as EBV and herpesvirus.24,25 Although the results of studies on the person-to-person transmission of EBV have been contradictory, it is suspected that this type of transmission is more important in children than in adults, and that it only occurs in children and youth.24–26 In our study, the cervical lymphadenopathy lumps in the three cases of HL developed between April 2011 and February 2012, and an association with EBV serology could not be established with certainty (Table 5). Other factors have not been studied as extensively, such as prolonged breastfeeding as a protective factor against HL independent of EBV-infection status.27 Yet other factors, such as birth weight28 or maternal smoking during pregnancy,29 have been studied but with inconclusive results.
There are some limitations to our study. Census tracts are dynamic and change through time. However, by using small units we can partly reduce the ecological bias, as they favour homogeneity and the potential future detection of differences in health.30 The 2012 population was used as the reference for the calculations. During the period under study, there were changes in population that we did not take into account due to a change in the number of CTs. The potential noise generated in the statistics by this problem is negligible, as the temporal window of the space-time cluster for LH was set as 2012. Another limitation that must be considered is the small sample size, which is due to the municipal scope of our study and the low prevalence of PC. We tried to compensate for this limitation by obtaining high-quality data with the help of experts in environmental health and cancer by means of personal interviews. Yet another limitation is that the results of this study are based on the address at the time of diagnosis and do not allow us to explore the effects of the latency period of PC and the changes of residence between the pregnancy and the time of diagnosis, among other aspects. In the cluster under study, the addresses had been the same since before the pregnancy. While we did not do a thorough qualitative investigation, we learned that the three patients did not attend the same school, although they all had visited the same public playground and the same health care centre.
This study is part of an ongoing research project that aims at improving the environmental health and quality of life of PC survivors in the RM,1,4,31 and includes a thorough and careful pediatric environmental history of the three cases identified in the cluster. This entails visiting the residence and neighbourhood of the patients after adding it to the informed consent, and a qualitative study of the discussion with the families held in 2015 for the purpose of generating and testing hypothesis based on the analysis of the exposure to carcinogenic agents from the periconceptional period and pregnancy to the time of diagnosis and the present.
Small-area analysis could be a useful tool for studying PC clusters, and may help better address the alerts and concerns of paediatricians, develop hypotheses about the aetiology of PC, and maintain a environmental surveillance system for PC.
FundingThis study was partially funded by the following grants: MD 001452 (PI, Dr. Luz Claudio; National Center on Minority Health and Health Disparities of the National Institutes of Health) and project ECO2012-36032-C03-01.
Conflict of interestsThe authors have no conflicts of interest to declare.
Please cite this article as: Ortega-García JA, López-Hernández FA, Cárceles-Álvarez A, Santiago-Rodríguez EJ, Sánchez AC, Bermúdez-Cortes M, et al. Análisis en áreas pequeñas del cáncer pediátrico en el municipio de Murcia. An Pediatr (Barc). 2016;84:154–162.
