


There are still no effective biomarkers for the diagnosis of central precocious puberty (CPP), and single metabolic indicators (such as vitamin D or insulin) are susceptible to interference from metabolic interactions. We conducted a study to assess the correlation between the vitamin D/insulin ratio (VDIR) and CPP and the screening potential of the VDIR.
MethodsCase-control study in a sample of 170 girls aged 6–10 years, including 85 girls with CPP and 85 girls with normal growth and development. We collected data on growth and developmental indicators and laboratory test results for both groups. The association between the VDIR and CPP/gonadal development was assessed by means of multivariate logistic and linear regression analyses. The diagnostic value of VDIR was evaluated by means of receiver operating characteristic (ROC) curve analysis.
ResultsThe VDIR in the CPP group was lower than in the control group (3.45 vs 6.18). The area under the ROC curve (AUC) of the VDIR for diagnosis of CPP was 0.731, with a sensitivity of 70.59% and a specificity of 67.06%, higher compared to vitamin D alone (AUC = 0.682) or insulin alone (AUC = 0.690). The multivariate logistic/linear regression analysis revealed that for every 1-unit increase in VDIR, there was a 0.814-fold decrease in the risk of CPP and a 233.54 mm3 decrease in uterine volume.
ConclusionBy integrating the metabolic interactions between vitamin D and insulin, VDIR shows promising value in assessing the risk of CPP. As a potential biomarker, it may offer dual clinical value by enabling early screening of high-risk individuals prior to the definitive diagnosis, as well as providing guidance for personalized interventions.
El diagnóstico de la pubertad precoz central (PPC) aún carece de biomarcadores efectivos, y los indicadores metabólicos individuales (como la vitamina D o la insulina) son susceptibles a la interferencia de las interacciones metabólicas. Este estudio investiga la correlación entre el ratio vitamina D/insulina (RVDI) y la PPC y evalúa el potencial del RVDI para el cribado.
MétodosEstudio de casos y controles que incluyó a 170 niñas de 6 a 10 años de edad, de las cuales 85 presentaban PPC y 85 tenían un crecimiento y desarrollo normales. Se recogieron datos sobre indicadores de crecimiento y desarrollo y de los resultados de las pruebas de laboratorio en ambos grupos. La relación entre el RVDI y la PPC/desarrollo gonadal se evaluó mediante análisis de regresión logística y lineal multivariantes. El valor diagnóstico del RVDI se evaluó mediante el análisis de curvas características operativas del receptor (ROC).
ResultadosEl RVDI fue inferior en el grupo de PPC que en el grupo control (3,45 vs. 6,18). El área bajo la curva ROC (AUC) del RVDI para el diagnóstico de la PPC fue de 0,731, con una sensibilidad del 70,59% y una especificidad del 67,06%, superior a la de la vitamina D (AUC = 0.682) o la insulina (AUC = 0.690) por separado. El análisis de regresión logística/lineal multivariante reveló que por cada aumento de 1 unidad en el RVDI, el riesgo de PPC disminuía 0,814 veces y el volumen uterino disminuía 233,54 mm3.
ConclusiónAl integrar las interacciones metabólicas entre la vitamina D y la insulina, el RVDI muestra una utilidad prometedora para la evaluación del riesgo de PPC. Como biomarcador potencial, puede ofrecer una utilidad clínica dual: por un lado, la detección temprana de individuos de alto riesgo antes del diagnóstico definitivo, y por otro, la orientación del manejo personalizado.

The pathogenesis of central precocious puberty (CPP) involves the combined effects of genetic susceptibility, exposure to environmental endocrine disruptors and nutritional/metabolic imbalances.1 Recent studies have found that vitamin D deficiency (VDD) and insulin resistance (IR) play significant roles in the onset of CPP.2,3 However, existing studies predominantly analyze the effects of vitamin D or insulin on CPP in isolation, overlooking the potential interactions and synergistic effects between the two. Previous studies have found that vitamin D can enhance insulin sensitivity by upregulating insulin receptor expression.4,5 Inhibited vitamin D-binding protein (VDBP) may also increase vitamin D bioavailability under IR conditions.6 This bidirectional regulation may be a source of bias when assessments are made using a single indicator.
Based on this, we conducted a study proposing the novel use of the VDIR as an integrated biomarker with the aim of overcoming the limitations of using a single indicator. The choice of the vitamin D/insulin ratio (VDIR) is based on the following theoretical foundations: First, the synergistic effects of vitamin D and insulin on glucose and lipid metabolism may impact the pace of gonadal development together.7 Second, the use of a ratio can minimize the effect of metabolic differences between individuals. This is particularly important in cases such as obese children, in whom VDD and compensatory hyperinsulinemia can distort results, leading to a risk of “false negatives”.8 Our hope was that establishing a dose-response relationship between the VDIR and the risk of CPP would allow for more accurate identification of high-risk groups.
Material and methodsStudy sample and groupsThe study included 170 girls who visited the hospital’s Growth and Development Clinic for evaluation between June 2023 and December 2024. Among them, 85 girls diagnosed with CPP were selected as the case group, and 85 girls with normal growth and development were included as the control group. The diagnosis for the case group was based on the “Expert consensus on the diagnosis and treatment of central precocious puberty (2022)”,9 which included: (1) breast development (Tanner stage B2 or higher) before 7.5 years or menarche before 10.0 years; (2) bone age (BA) advanced by at least 1 year relative to chronological age (CA); (3) a peak level of luteinizing hormone (LH) of 5 IU/L or greater and a peak LH /peak follicle-stimulating hormone (FSH) ratio greater than 0.6 in the gonadotropin-releasing hormone (GnRH) agonist stimulation test; (4) pelvic ultrasound showing enlarged uterine and ovarian volumes, with visualization of multiple follicles measuring 4 or more mm in diameter in the ovaries; (5) accelerated linear growth. The control group consisted of girls who, after a comprehensive evaluation, were deemed to be in the normal stage of growth and development. All children were brought for examination at the request of their parents, who wanted to understand their growth and developmental status. To control for potential confounding factors, especially the impact of age on sex hormone levels and physical development, we used a 1:1 age-matching approach.
The inclusion criteria were: (1) girl aged 6–10 years; (2) consent to the necessary serological, imaging, and ultrasound tests. The exclusion criteria included: (1) age less than 6 years or greater than 10 years (to avoid the effects of mini-puberty and normal pubertal development); (2) incomplete precocious puberty, rapidly progressing puberty, peripheral precocious puberty, and precocious puberty caused by organic central lesions (such as isolated premature thelarche, hypothalamic-pituitary lesions, adrenal tumors, ovarian tumors, or exogenous estrogen intake); (3) chronic disease affecting vitamin D or insulin metabolism (such as hypothyroidism, diabetes, adrenal diseases, liver or kidney diseases); (4) genetic disease affecting vitamin D or insulin metabolism (such as Williams syndrome, mitochondrial diseases); (5) treatment in the past 3 months with hormones or drugs that interfere with vitamin D/insulin metabolism (such as growth hormone, metformin, vitamin D); (6) failure to undergo relevant tests or missing data.
The study was approved by the ethics committee of the hospital (ethics approval no. 2024-119-01; April 15, 2024). Since the study was a retrospective analysis based on the review of electronic health records, involved only previously collected clinical data and laboratory test results and no prospective interventions, personal identifiable data or commercial interests, the ethics committee granted a waiver of informed consent.
Sample size calculationThe sample size was determined based on pilot study data (VDIR AUC = 0.70), calculated using the PASS software version 15.0 (α = 0.05; power = 0.80). The minimum required sample size was 76 per group.
Data collectionResearchers extracted all the study data retrospectively from the electronic medical record system of the hospital with the approval of the ethics committee. Physical development was assessed by two pediatric endocrinologists, who measured height (cm) and weight (kg) using standardized instruments and calculated the body mass index (BMI) and BMI z scores. BA was assessed with the Greulich and Pyle method and interpreted independently by two radiologists.10 Two pediatric endocrinologists performed independent sexual development assessments using a standardized Tanner staging chart. Disagreements were resolved by a third physician, blinded to the previous assessments. Pelvic ultrasounds were performed with the GE Voluson 730 ultrasound machine (probe frequency, 7.5 MHz), measuring uterine volume (length × width × anteroposterior diameter × 0.523), bilateral ovarian volume (using the ellipsoid formula), and the number of follicles with a diameter greater than 4 mm.
All participants fasted for 8 h before venous blood collection in the morning. In conformity with clinical guidelines and the indications in the technical datasheet of the drug, the GnRH agonist stimulation test was performed using gonadorelin (dose of 2.5 µg/kg up to a maximum dose of 100 µg; Maanshan Fengyuan Pharmaceutical Co., National Drug Approval No. H10960063). Venous blood samples were collected at 0 (baseline), 30, 60, and 90 min after injection, and serum levels of LH and FSH (both baseline and post-stimulation) were measured by chemiluminescence immunoassay (Roche Cobas e801 analyzer). Levels of 25(OH) D, fasting insulin (FIns), fasting blood glucose (FBG), estradiol (E2), and testosterone (T) were determined by electrochemiluminescence immunoassay (Cobas 8000, Roche). We calculated derived indices: The Homeostatic Model Assessment of Insulin Resistance11 (HOMA-IR = [FBG × FIns]/22.5) and the Homeostatic Model Assessment of Insulin Sensitivity12 (HOMA-IS = 20 × FIns/[FBG − 3.5]). We classified vitamin D status according to international consensus recommendations: 25(OH)D levels of less than 30 nmol/L were interpreted as VDD, of 30–50 nmol/L as vitamin D insufficiency, and greater than 50 nmol/L as vitamin D sufficiency.13 The diagnostic criteria for IR were defined based on breast development stages in girls: HOMA-IR of 2.1 or greater for Tanner stages I and II, of 3.3 or greater for Tanner stages III and IV and of 2.6 or greater for Tanner stage V.14
Statistical analysisThe statistical analysis was performed with the software SPSS 26.0 and MedCalc 20.0. For non-normally distributed continuous variables, we used the median and interquartile range (IQR) to describe the data and the Mann-Whitney U test to compare groups. For categorical variables, we used proportions (percentages) and analyzed them with the χ2 test or the Fisher exact test. The association between the VDIR and CPP/gonadal development indicators was assessed using multivariate logistic/linear regression analysis (adjusting for CA, BA, height, weight and BMI). We assessed diagnostic performance using receiver operating characteristic (ROC) curve analysis, calculating the area under the ROC curve (AUC), optimal cut-off values (using the maximum Youden index method) and predictive values. We used the DeLong test to compare differences in AUCs.
ResultsAfter obtaining approval from the institutional ethics committee, we selected a total of 568 girls who underwent growth and development evaluations from the hospital’s electronic health record system. Based on the predefined inclusion and exclusion criteria, 232 participants were ultimately included, of which 139 had a diagnosis of CPP and 93 had normal growth and development. After matching controls for age, the final sample included 85 girls with CPP and 85 controls (Fig. 1).

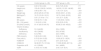
Table 1 presents the physical development and metabolic indicators for both groups. The physical development indicators (height, weight, BMI, BA, etc.) were higher in the CPP group compared to the control group. In the CPP group, the 25(OH)D level was lower (40.96 vs 51.41 nmol/L in the control group), and the proportion of VDD increased to 22.4% (compared to 8.2% in the control group). In addition, FIns levels (10.90 vs 8.72 nmol/L) and the HOMA-IR (2.61 vs 2.11) were significantly higher in the CPP group. However, there was not a statistically significant difference in the proportion of IR between groups (54.1% vs 41.2%; P = .091). Notably, the VDIR was significantly lower in the CPP group (3.45 vs 6.18).
Physical development and metabolic indicators in cases and controls.
| Control group (n = 85) | CPP group (n = 85) | P | |
|---|---|---|---|
| CA (years) | 8.00 (7.00−9.00) | 8.00 (7.25−9.00) | .171 |
| Height (cm) | 133.40 (126.50−140.80) | 140.00 (131.20−146.80) | .002 |
| Height z | 0.95 (0.46−1.70) | 1.76 (1.01−2.21) | <.001 |
| Weight (kg) | 29.00 (25.00−37.50) | 35.00 (29.01−41.90) | <.001 |
| BMI (kg/m2) | 16.72 (15.00−19.51) | 18.73 (16.42−20.35) | .002 |
| BMI z | 0.81 (−0.16 to 1.71) | 1.61 (0.71−2.28) | .001 |
| BA (years) | 9.00 (8.70−11.00) | 11.00 (9.50−12.50) | <.001 |
| BA − CA (years) | 1.54 (0.81−2.34) | 2.50 (2.00−3.00) | <.001 |
| 25 (OH)D (nmol/L) | 51.41 (40.53−64.70) | 40.96 (31.60−48.22) | <.001 |
| Vitamin D status | <.001 | ||
| Sufficiency | 51.8 (44/85) | 22.4 (19/85) | |
| Insufficiency | 40.0 (34/85) | 55.2 (47/85) | |
| Deficiency | 8.2 (7/85) | 22.4 (19/85) | |
| FBG (mmol/L) | 5.36 (5.00−5.50) | 5.36 (5.11−5.60) | .315 |
| FIns (mIU/L) | 8.72 (5.34−10.25) | 10.90 (8.72−18.20) | <.001 |
| HOMA-IR | 2.11 (1.23−2.49) | 2.61 (2.00−4.22) | <.001 |
| HOMA-IS | 94.98 (57.73−131.84) | 115.96 (80.82−207.14) | <.001 |
| Proportion of IR | 41.2 (35/85) | 54.1 (46/85) | .091 |
| VDIR | 6.18 (4.15−10.99) | 3.45 (1.97−6.01) | <.001 |
Abbreviations: BA, bone age; BMI, body mass index; CA, chronological age; CPP, central precocious puberty; FBG, fasting blood glucose; FIns, fasting insulin; HOMA, Homeostatic Model Assessment (IR, insulin resistance; IS, insulin sensitivity); VDIR, vitamin D to insulin resistance ratio.
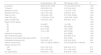
The sex hormone levels and gonadal development indicators were significantly higher in the CPP group compared to the control group (Table 2). The CPP group had higher levels of E2, T, baseline LH, baseline FSH and peak LH and a higher peak LH/peak FSH ratio, while the difference in peak FSH values was not statistically significant. It is worth noting that the group of girls with CPP in our study included two subtypes: those who developed breast tissue before age 7.5 years and those who experienced menarche before age 10 years. In some cases, baseline LH levels had already reached pubertal levels, allowing for a clinical diagnosis of CPP without the need for a GnRH agonist stimulation test. Regarding gonadal development, uterine volume and bilateral ovarian volume were significantly greater in the CPP group compared to the control group (uterine volume, 4125.18 vs 1281.41; ovarian volume: left, 2.80 vs 2.00 and right, 3.11 vs 2.00). The proportion of girls with a non-linear endometrial midline pattern was higher in the CPP group (55.3% vs 24.7%), but there was no significant difference in endometrial thickness or the number of large follicles (>4 mm). Regarding secondary sexual characteristics, we found a significantly higher proportion in the CPP group of girls with breast development at Tanner stage B4 (43.5% vs 12.9%) and of menarche (44.7% vs 0%).
Sex hormone levels and gonadal development in cases and controls.
| Control group (n = 85) | CPP group (n = 85) | P | |
|---|---|---|---|
| E2 (pmol/L) | 29.90 (18.40−70.90) | 131.00 (34.50−201.00) | <.001 |
| T (nmol/L) | 0.09 (0.09−0.10) | 0.15 (0.09−0.42) | <.001 |
| Baseline LH (IU/L) | 0.21 (0.20−0.42) | 1.76 (0.75−7.04) | <.001 |
| Baseline FSH (IU/L) | 2.30 (1.64−3.35) | 4.69 (2.87−6.31) | <.001 |
| Peak LH (IU/L) | 3.92 (2.86−4.76) | 9.77 (6.09−23.98) | <.001 |
| Peak FSH (IU/L) | 11.65 (9.04−16.75) | 12.25 (9.59−16.59) | .582 |
| Peak LH /peak FSH | 0.32 (0.24−0.48) | 0.93 (0.61−2.13) | <.001 |
| Breast Tanner staging | <.001 | ||
| B1 | 9.4 (8/85) | 1.2 (1/85) | <.001 |
| B2 | 57.6 (49/85) | 38.8 (33/85) | <.001 |
| B3 | 20.0 (17/85) | 16.5 (14/85) | <.001 |
| B4 | 12.9 (11/85) | 43.5 (37/85) | <.001 |
| Proportion of menarche | – | 44.7 (38/85) | <.001 |
| Age of menarche (years) | – | 9.00 (8.94−9.12) | <.001 |
| Proportion of non-linear endometrial midline | 24.7 (21/85) | 55.3 (47/85) | <.001 |
| Endometrial thickness (mm) | 3.00 (2.60−4.70) | 4.49 (2.40−6.00) | .240 |
| Uterine volume (mm3) | 1281.41 (768.00−2269.41) | 4125.18 (2027.90−15 050.44) | <.001 |
| Ovarian volume (mm3) | |||
| Left | 2.00 (1.39−3.12) | 2.80 (2.00−3.70) | .013 |
| Right | 2.00 (1.30−3.36) | 3.11 (1.85−3.95) | .015 |
| No. large follicles | 8.00 (5.00−11.00) | 9.00 (8.00−12.00) | .090 |
Abbreviations: CPP, central precocious puberty; E2, estradiol; LH, luteinizing hormone; FSH, follicle-stimulating hormone; T, testosterone.
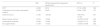
After adjusting for CA, BA, height, weight and BMI, we found that the VDIR was independently and inversely associated with the risk of CPP (OR = 0.814; 95% CI, 0.715−0.926) (Table 3). When we analyzed the association with gonadal development indicators, we found that each unit increment in VDIR was associated with a reduction in uterine volume of 233.54 mm3 (95% CI, −445.79 to −21.29). However, we did not find significant associations with the proportion of non-linear endometrial midline patterns, endometrial thickness, mean ovarian volume or the number of follicles with a diameter greater than 4 mm.
Association of VDIR with CPP and gonadal development.
| B/β | OR/Nonstandardized regression coefficient B | 95% CI | P | |
|---|---|---|---|---|
| CPP | −0.206 | 0.814 | 0.715−0.926 | .002 |
| Proportion of non-linear endometrial midline | −0.099 | 0.905 | 0.792−1.036 | .147 |
| Uterine volume | −0.185 | −233.54 | −445.79 to −21.29 | .031 |
| Mean ovarian volume | −0.073 | −0.022 | −0.078 to 0.035 | .443 |
| Endometrial thickness | −0.089 | −0.064 | −0.238 to 0.110 | .463 |
| No. large follicles | −0.130 | −0.120 | −0.326 to 0.086 | .252 |
Abbreviations: CPP, central precocious puberty; VDIR, vitamin D to insulin ratio.
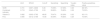
The ROC curve analysis (Table 4, Fig. 2) demonstrated that the VDIR offered the best diagnostic performance for the prediction of CPP, with an AUC of 0.731 (95% CI, 0.657−0.806), a sensitivity of 70.59% and a specificity of 67.06% (Youden index, 0.38). Although the combined indicator (Vitamin D combined with FIns) improved specificity to 78.82% and achieved a positive predictive value of 73.53%, its sensitivity was significantly reduced (58.82%). In contrast, vitamin D alone exhibited a higher sensitivity (76.47%), while the insulin level exhibited a higher specificity (78.82%), showing an imbalance between sensitivity and specificity.
Diagnostic performance of vitamin D, FIns and related derived indicators for CPP.
| AUC | 95%CI | Cut-off | Sensitivity | Specificity | Youden index | Positive predictive value | |
|---|---|---|---|---|---|---|---|
| VDIR | 0.731 | 0.657−0.806 | 5.06 | 70.59% | 67.06% | 0.38 | 68.18% |
| Combined indicator | 0.719 | 0.643−0.796 | 0.53 | 58.82% | 78.82% | 0.38 | 73.53% |
| Vitamin D | 0.682 | 0.602−0.762 | 48.65 | 76.47% | 55.29% | 0.32 | 63.11% |
| FIns | 0.690 | 0.612−0.768 | 10.85 | 50.59% | 78.82% | 0.29 | 70.49% |
Abbreviations: AUC, area under the curve; CPP, central precocious puberty; FIns, fasting insulin; VDIR, vitamin D to insulin ratio.

This case-control study systematically explored the correlation between the VDIR and CPP and the diagnostic value of the former. We found that VDIR levels were significantly lower in the CPP group compared to healthy controls, with a diagnostic AUC of 0.731 (sensitivity, 70.59%; specificity, 67.06%), outperforming vitamin D or FIns alone. Multivariate logistic regression further confirmed that VDIR was independently and inversely associated with the risk of CPP. These findings suggest that, by integrating the metabolic interactions between vitamin D and insulin, the VDIR may serve as a potential biomarker for CPP.
In recent years, multiple studies have indicated a close association between VDD, IR and the onset of CPP.15,16 Reduced vitamin D levels may upregulate leptin expression, activating the hypothalamic-pituitary gonadal (HPG) axis and accelerating pubertal onset.17,18 At the same time, insulin can stimulate the synthesis and release of GnRH in hypothalamic neurons and enhance the sensitivity of ovarian granulosa cells to gonadotropins, further promoting gonadal development.19,20 Our study found that the proportion of VDD was significantly higher in the CPP group compared to the control group, with concurrently elevated FIns levels and IR. This suggests that the imbalance between vitamin D and insulin may be a key mechanism driving CPP. Specifically, VDD exacerbates IR by downregulating insulin receptor expression, while IR inhibits VDBP, leading to a transient increase in free active vitamin D but also accelerating renal excretion.5,6,21 Ultimately, this forms a vicious cycle of VDD and IR. VDD and IR synergistically activate the HPG axis and ovarian function, jointly contributing to the abnormal advancement of puberty. Therefore, based on the bidirectional regulatory mechanism of vitamin D and insulin, and considering that metabolic interactions can easily influence a single indicator, we propose the VDIR as an integrated marker reflecting their synergistic imbalance.
Although there is a correlation between the VDIR and precocious puberty, it is important to note that children in the CPP group generally had higher body weights and BMIs. Obesity has been widely recognized as an independent risk factor for early pubertal onset.22 Obese children frequently also have metabolic alterations such as IR and VDD, which may serve as confounding factors underlying the association between VDIR and precocious puberty.23,24 In our study, we adjusted the regression analysis for potential confounders, including the BMI, and the VDIR still emerged as an independent factor associated with CPP. This suggests that the association may not be entirely driven by obesity, and the ratio-based nature of the VDIR may help offset individual differences in baseline metabolism (e.g., BMI and prepubertal hormonal fluctuations). However, the BMI may still influence the VDIR indirectly by altering levels of insulin and vitamin D substrates, which warrants further investigation into the underlying mechanisms in this association.
At the level of gonadal development, the negative correlation between the VDIR and uterine volume suggests that metabolic imbalance may directly impact gonadal maturation. In the CPP group, the peak LH/peak FSH ratio was elevated, and levels of sex hormones such as E2 and T were significantly increased, indicating excessive activation of the HPG axis. Although the VDIR was not significantly associated with ovarian volume or endometrial thickness, its relationship with uterine volume may reflect the interaction between metabolic signals (e.g., insulin-mediated ovarian IGF-1R pathways) and local sex hormone synthesis.25–28 Previous studies have found that decreased vitamin D levels may further increase uterine volume in girls with CPP by affecting circulating E2 levels.29 Similarly, animal model studies have shown that insulin signaling is crucial for the development of preovulatory follicles and endometrial proliferation.30 The synergistic effect of the imbalance between vitamin D and insulin may accelerate gonadal development, but the specific mechanisms underlying this need to be further elucidated.
The findings of our study suggest that the VDIR may have significant translational value in screening for CPP in clinical practice. Its high AUC and better balance of sensitivity and specificity make it significantly superior to single indicators, so it could serve as an ancillary screening tool for CPP. Based on the cut-off value, we would recommend integrating the VDIR into routine pediatric health checkups for early screening of children with suspected CPP (e.g., those with early breast development or advanced BA). In those with positive results, the evaluation can continue with a pelvic ultrasound. The VDIR holds promise as a clinical screening tool to help identify individuals that may be at high risk, offering a more comprehensive metabolic marker for determining the need of the GnRH agonist stimulation test. This may help optimize resource allocation and reduce unnecessary examinations. Since some CPP patients already meet the diagnostic threshold based on baseline LH levels, this study does not recommend using the VDIR as a substitute for the stimulation test, but rather as a preliminary risk assessment or stratification tool. In the case of high-risk groups (e.g., positive family history or rapidly progressing precocious puberty), the combined testing of vitamin D and FIns can increase the specificity to 78.82%, guiding clinical decision-making to reduce false positives.
However, there are certain limitations to this study. First, the sample was limited to a single-center cohort of girls, and further studies are required before generalizing its findings to the male population and other ethnic groups. Second, the cross-sectional design makes it difficult to establish causality or the temporal sequence in the relationship between the VDIR and CPP. Additionally, the sensitivity and specificity of the VDIR are still below the ideal threshold (>80% for both). Prospective multicenter studies are needed to refine the clinical translation pathway, establish a dynamic monitoring model based on the VDIR and explore the specific mechanisms by which the VDIR modulates the HPG axis using various techniques.
ConclusionThis study, which combines the dual pathological mechanisms of VDD and IR, reveals the potential impact of vitamin D-insulin interaction on CPP. It provides a more comprehensive risk assessment and screening tool for clinical practice while offering a theoretical basis for developing personalized intervention plans (such as vitamin D supplementation combined with insulin sensitivity regulation).
- 1
The vicious cycle of “vitamin D deficiency and worsening insulin resistance” may be a key mechanism driving central precocious puberty
- 2
The vitamin D/insulin ratio, as an integrated indicator reflecting the synergistic effect of their imbalance, can effectively overcome the limitations of using a single indicator.
- 3
The vitamin D/insulin ratio is an independent risk factor for the development of central precocious puberty and is strongly associated with uterine volume growth.
- 4
The diagnostic performance of vitamin D/insulin ratio for central precocious puberty is superior compared to the performance of either as a single indicator or their mere combination.
- 1
JS and HRZ wrote the manuscript, WHS and JBL participated in the literature search, JS and SQJ participated in the study design, YX and WW participated in the diagnosis and treatment of the patients.
Informed consentThe study was a retrospective analysis based on the participants’ historical health records and related information, and did not involve any prospective interventional treatments. It does not affect participants’ personal privacy or involve any commercial interests, and therefore received an ethical waiver for informed consent from the ethics committee.
Research ethicsThe study is a single-center retrospective case-control study, approved by the Ethics Committee of the Third Affiliated Hospital of Zhengzhou University (approval no: 2024-119-01), and conducted in accordance with the principles of the Declaration of Helsinki.
FundingThe authors declare that no funds, grants, or other support were received during the preparation of this manuscript.
Data availabilityThe data supporting the results of this study can be obtained from the author, but the availability of these data is limited. However, the author can provide data with a reasonable request.
The authors have no relevant financial or nonfinancial interests to disclose.
Fig. 2 in this article was created using Xiantao Academic (https://www.xiantaozi.com).
