


The prevalence of feeding disorders (FDs) and picky eating in children is high in our region, based on the parents’ perceptions. Although organic disease or a nutritional impact is rarely observed in these children, the problem frequently has an effect on family dynamics. We aimed to estimate the impact of these disorders on the stress level, quality of life and psychological health of families.
MethodsStudy of cases (FDs) and controls (healthy controls and controls with digestive disorders or other illness). We assessed parental stress and the risk of psychological distress in these families using validated scales (Parent Stress Index Short Form [PSI-SF] and Goldberg's General Health Questionnaire [GHQ-28]) and a parental opinion survey.
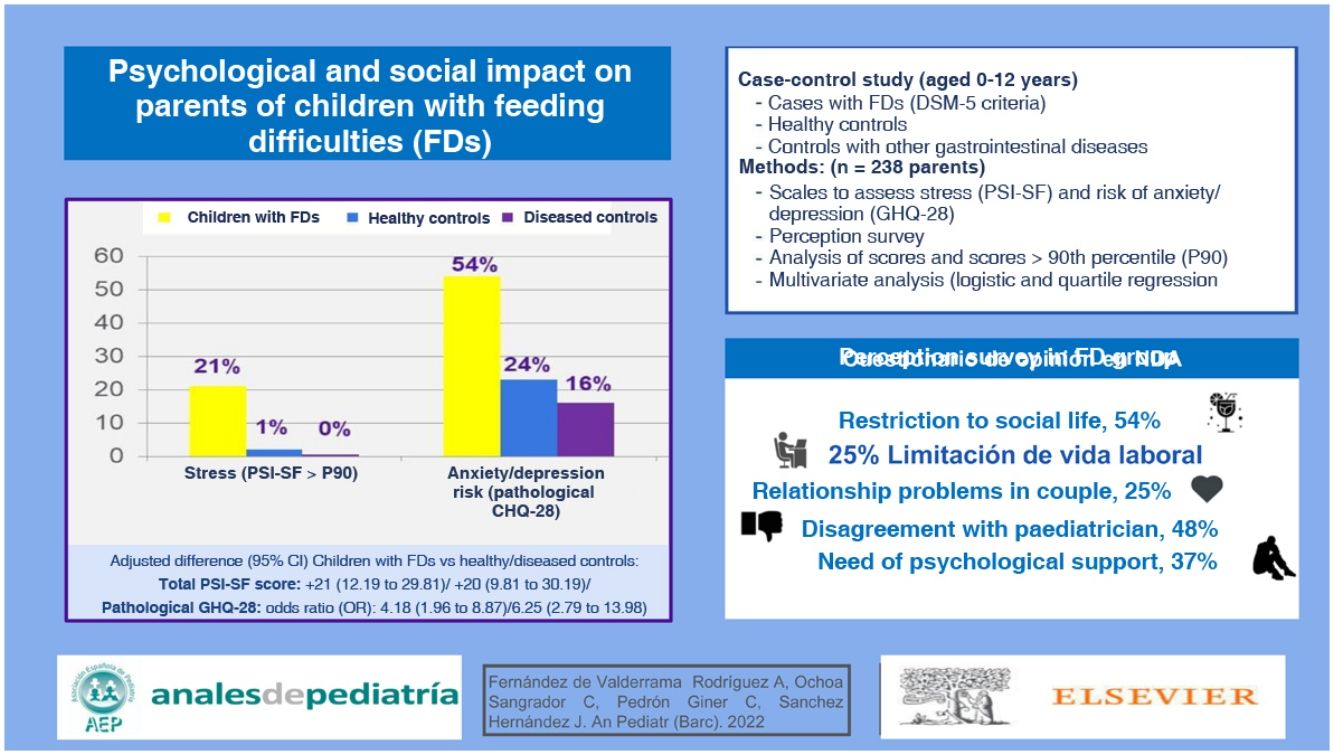
ResultsWe collected a total of 238 surveys, 102 corresponding to healthy controls, 88 to controls with digestive disorders and 48 to children with FDs. We found that 45.8% of parents in the FD group felt neglected by their paediatricians and 47.9% did not agree with the paediatrician’s recommendations. In addition, 54.2% reported limitations to their social life, 25% problems in their relationship, 47.9% feeling judged by others (12.5% by their own partner) for how they managed mealtimes, and 37.5% having sought or considered seeking psychological support. All these problems were significantly more frequent compared to controls. Based on the GHQ-28, the risk of anxiety and depression was more frequent in parents in the FD group: 54.2% compared to the reference (adjusted odds ratio [aOR] compared to controls, 4.18; 95% confidence interval [CI], 1.96−8.87; OR compared to sick controls, 6.25; 95% CI, 2.79−13.98) and 33.3% compared to the healthy control group. They also had higher stress scores (PSI-SF) compared to the healthy control group (adjusted mean difference [AMD], 21; 95% CI, 12.19−29.81) and the sick control group (AMD, 20; 95% CI, 9.81−30.19).
ConclusionsParents of children with FDs have a high level of stress and risk of anxiety and depression, with repercussions at the social, family, couple and work levels. The relationship with the paediatrician may also be affected.
La prevalencia de niños con dificultades en la alimentación (NDA) o malos comedores es alta en nuestro medio, si consideramos la opinión de los padres. Aunque en la mayoría no observamos enfermedad orgánica o repercusión nutricional, es frecuente que este problema repercuta en la dinámica familiar. Nos proponemos estimar su impacto en el estrés, calidad de vida y estado de salud psicológica familiar.
MétodosEstudio de casos (NDA) y controles (controles sanos y controles con trastornos digestivos o controles enfermos). Se evaluó el estrés parental y el riesgo de afectación psicológica en estas familias, mediante escalas validadas (Parent Stres Index Short Form [PSI-SF] y General Health Questionnaire de Goldberg [GHQ-28] y una encuesta de opinión a los padres.
ResultadosSe recogieron un total de 238 encuestas; 102 correspondientes a controles sanos, 88 con trastornos digestivos, y 48 de NDA. El 45,8% de los padres de NDA se consideraban desatendidos por su pediatra y el 47,9% no estaban de acuerdo con sus recomendaciones. El 54,2% de ellos encuentra limitaciones en su vida social, el 25% problemas de pareja, el 47,9% se sienten juzgados por los demás (12,5% por sus propias parejas) sobre cómo manejan la alimentación de su hijo y un 37,5% habían solicitado o considerado ayuda psicológica. Todos estos problemas fueron significativamente más frecuentes que en los controles. Padres y madres de los NDA presentaron con mayor frecuencia riesgo de ansiedad/depresión según la escala GHQ-28: un 54,2% según valores de referencia (odds ratios ajustadas [ORa] frente a controles sanos 4,18; intervalo de confianza del 95% [IC95%]: 1,96 a 8,87; frente a controles enfermos OR 6,25; IC95% 2,79 a 13,98) y un 33,3% según los valores de nuestros controles sanos. Asimismo, presentaron mayores puntuaciones de estrés (PSI-SF) que los controles sanos (diferencia de medias ajustada [DMA] 21; IC95% 12,19 a 29,81) y controles enfermos (DMA 20; IC95% 9,81 a 30,19).
ConclusionesLos padres y madres de los NDA tienen niveles elevados de estrés y riesgo de ansiedad y depresión, con repercusión a nivel social, familiar, de pareja, y laboral. Además, la relación con el pediatra puede verse afectada.
In our society, parents frequently believe that their children have feeding difficulties, and the broad term “picky eater” is commonly used to refer to this. The terms, definitions and standardised management of these difficulties are constantly being revised and, in most cases, difficulties correspond to subjective descriptions by the parents that are not accompanied by nutritional disorders or organic disease.1,2 In most cases, they occur in children with normal development, with no apparent problem except at mealtimes.
The prevalence of feeding difficulties is high; the most studied form involves the group of picky eaters, with substantial variation in the reported prevalence, which ranges from 19% to 60% from age 1 through preadolescence.3–7 The overall prevalence of feeding disorders in patients with neurologic disorders is as high as 80%.8
Assessing whether the child exhibits adequate height and weight gain is one of the first strategies with which paediatricians attempt to determine whether they have to approach a disorder as probably functional or organic. However, in families with children that have feeding difficulties (FDs), the fact that these difficulties are not reflected on weight or height does not keep the family from experiencing them as a problem, eliciting levels of anxiety that may exceed those generated by other diseases classified as organic. Identifying this impact would allow the paediatrician to apply a more holistic approach to the problem, focusing not only on the child, but also in the family environment.
Parents exhibit baseline stress levels in association with the responsibilities acquired from the moment they take on the parental role. This stress can have an impact on their self-esteem, social life and personal development. When they subjectively perceive that the child is not eating properly, their stress levels may increase. Previous studies have shown that FDs in children may be associated with problems in parent-child interactions,1 and it is difficult to determine whether these relational problems are the result or the cause of the FDs. Our aim was to assess this impact by analysing parental stress and the psychological repercussions in affected families through the use of validated scales.
MethodsWe conducted a case-control study once it was approved by the ethics committee of our hospital (file no. 1607). The cases were patients given a diagnosis of FD managed by a specialist (paediatric gastroenterology clinic). We established 2 control groups: healthy controls (HCs) and diseased controls (DCs). Healthy controls were children aged 0–12 years that visited the paediatric primary care clinic for preventive checkups without underlying disease. Diseased controls were patients aged 0–12 years with other diseases, functional (abdominal pain, constipation, colic) or organic (coeliac disease), followed up in specialty clinics. We did not use any method for matching patients by age or sex in the sample selection.
The inclusion criterion was accurate diagnosis prior to enrolment: Diagnostic and Statistical Manual of Mental Disorders, fifth edition (DSM-5) criteria for children with FDs9 and European Society for Paediatric Gastroenterology Hepatology and Nutrition (ESPGHAN) 201210 and ROMA III criteria11,12 for DCs, excluding patients with any other organic or psychiatric disease.
Based on the DSM-5, the criteria for diagnosis of avoidant/restrictive food intake disorder are:
- A)
Persistent failure to meet appropriate nutritional and/or energy needs associated with one (or more) of the following: significant weight loss, significant nutritional deficiency, dependence on enteral nutrition or oral nutritional supplements and marked interference in psychosocial functioning.
- B)
The disturbance is not better explained by lack of available food or by an associated culturally sanctioned practice.
- C)
The disturbance does not occur exclusively during the course of anorexia nervosa or bulimia nervosa, and there is no disturbance in the perception of one’s own body weight or shape.
- D)
The eating disturbance is not attributable to a concurrent medical condition, or its severity exceeds that routinely associated with the medical condition.
After obtaining informed consent, the data were collected through an anonymous questionnaire, copies of which were provided to both parents when patients visited the clinic in the 2017–2019 period. A postage-paid envelope was also provided for submission of the questionnaire by regular post. The questionnaire comprised 4 distinct sections:
- -
General patient data (age, sex, birth and current anthropometric measurements, parental relationship/household structure and parental employment).
- -
Impact of the disturbance at the family level (need of medical care, medication, impact on social life, impact on couple relationship) assessed through an in-house questionnaire with multiple-choice answers: not at all, a little, a fair amount, a lot (Appendix B of supplemental material).
- -
Assessment of parental stress by means of the Parent Stress Index Short Form (PSI-SF) developed by Abidin (adapted to Spanish by Díaz-Herrero et al).13,14 This instrument assesses the stress experienced by respondents in their parenting role. It consists of 36 items rated on a 5-point Likert scale (1, strongly disagree to 5, strongly agree). Thus, the maximum possible score in the scale is 180 points, and the minimum 36 points. Higher scores indicate greater stress. Based on the recommendations of the authors, responses with scores exceeding the 85th percentile were considered indicative of high stress and responses above the 90th percentile of clinically significant stress. The instrument includes 3 subscales: (a) Parental distress (PD), which assesses the distress experienced by parents in their role as father/mother caused by personal factors and directly related to the parenting role; (b) Parent-Child Dysfunctional Interaction (PCDI), which assesses the perception of parents of the degree to which the child meets or does not meet their expectations and the reinforcement experienced from interactions with the child, and (c) Difficult child (DC), which assesses the perceived ease of difficulty of controlling the child based on the child’s behavioural traits.
- -
Goldberg General Health Questionnaire (GHQ-28)15: instrument developed to assess social dysfunction, somatic symptoms, anxiety and depression. It has 2 main applications: estimating the prevalence of psychiatric disorders in a given population, and identifying cases of psychiatric disease in community or non-psychiatric clinical settings. The test can be used as a screening method, but not for diagnosis or assessment of clinical severity. It comprises 28 items grouped in four 7-item subscales, which assess the following domains: subscale A (somatic symptoms), subscale B (anxiety and insomnia), subscale C (social dysfunction) and subscale D (severe depression). Each item has 4 possible answers. The GHQ was scored on a Likert scale, assigning values of 0, 1, 2 and 3 to each of the 4 possible answers (a, b, c, d). A higher score indicates poorer mental health. With this approach, the maximum possible score in the questionnaire is 84 points and the minimum 0 points. The total score is obtained by the simple addition of the scores of each of the items. For its interpretation, the cut-off points recommended by the author to establish case vs non-case status is 5 out of 6 for each subscale, and 23 out of 24 in the overall scale, although these thresholds are not fixed.
We estimated that we needed a sample size of at least 40 cases and 80 controls to detect differences in the scales equivalent to 0.6 standard deviations and odds ratio (OR) greater than 3 for scale scores in the pathological range. We performed a descriptive analysis of all variables, overall and by group, obtaining absolute and relative frequencies for qualitative variables and measures of central tendency and dispersion for quantitative variables. We calculated 95% confidence intervals (CIs) for all of the estimates. We compared qualitative data by means of the chi square or exact test and quantitative data by analysis of variance (ANOVA) or nonparametric alternatives. We fitted unconditional logistic regression models for categorised scores and ordinal regression models for quantitative scores to assess the degree of parental stress associated with each group, adjusting for age, sex and social/family-related factors (paternal-maternal role, employment status and educational attainment). We used reference cut-off points and cut-off points estimated with data obtained from the HC group. We then made an a posteriori comparison with the subset of patients with coeliac disease as the DC group.
ResultsWe obtained a total of 238 responses: 102 corresponded to HCs, 88 to children with gastrointestinal disease, considered the DC group (56 coeliac disease, 13 constipation, 19 abdominal pain) and 48 to children with FDs. The responses referred to a total of 133 patients, of who 59 were male, with no differences in sex distribution between groups (male sex: children with FDs, 48%; HCs, 42.3%; DC, 44.8%). Table 1 presents the characteristics of each of the groups. The age was greater in the DC group. We obtained responses from a total of 130 mothers and 108 fathers, without significant differences in the distribution between the 3 groups. Children with children with FDs had a lower birth weight and birth height compared to healthy controls, with no other significant differences in their characteristics. We did not find differences between groups in relation to preterm birth, birth order or low birth weight after term birth, or in the family history of similar disease (coeliac disease, functional gastrointestinal disorder or FD). There were also no differences in nutritional status between the 3 groups. We found a significant difference in the use of nasogastric feeding (18.8% of children with FDs vs 0% of DCs), although we did not determine whether its use predated or occurred after diagnosis.
Gestational age and anthropometric characteristics of patients included in the study.
| Healthy controls (n = 59) | Children with FDs (n = 25) | Diseased controls (n = 49) | Pa | Pb | ||||
|---|---|---|---|---|---|---|---|---|
| Mean (median) | SD (IQR) | Mean (median) | SD (IQR) | Mean (median) | SD (IQR) | |||
| At birth | ||||||||
| GA (weeks) | 40 (39) | 2 (38 a 41) | 38 (39) | 4 (36−40) | 39 (40) | 2 (38−40) | .20 | .23 |
| Weight (kg) | 3.21 (3.20) | 0.50 (2.90 a 3.55) | 2.77 (2.90) | 0.75 (2.60 a 3.20) | 3.08 (3.15) | 0.56 (2.73 a 3.48) | .01 | .08 |
| Length (cm) | 50.29 (50) | 2.50 (50 a 51.75) | 47.25 (48) | 5.37 (47.75 a 50) | 50.02 (50) | 3.71 (49 a 51) | .02 | .05 |
| At time of study | ||||||||
| Age (years) | 4.49 (2.82) | 4.2 (1.98 a 4.05) | 2.93 (2.20) | 2.47 (1.67 a 3.40) | 7.08 (6.65) | 4.15 (5.19 a 8.54) | .23 | < .01 |
| Weight z | 0.57 (0.12) | 3.45 (−0.44 a 0.49) | −0.74 (−1.13) | 2.27 (−1.46 a −0.62) | 0.18 (0.13) | 0.96 (−0.28 a 0.52) | .62 | .19 |
| Height z | 1.21 (0.80) | 3.31 (0.55 a 1.19) | 0.56 (0.22) | 3.66 (−0.59 a 0.61) | 0.85 (1.10) | 1.46 (0.38 a 1.39) | .71 | .18 |
| BMI z | −0.44 (−0.54) | 1.41 (−1.14 a −0.15) | −1.68 (−1.72) | 0.94 (−1.96 a −1.34) | −0.45 (−0.48) | 0.94 (−0.69 a −0.30) | .07 | .58 |
BMI, body mass index; FD, feeding disorder; GA, gestational age; IQR, interquartile range; SD, standard deviation; z, z-score.
Bold values means p ≤ 0.05.
The median age at onset of symptoms was 6 months in the FD group and 24 months in the DC group (P < .01). In children aged less than 3 years, the caregiver chiefly in charge of feeding the child in the HC group was the mother (51.9%), followed in frequency by involvement of both parents (37%). In contrast, in the FD group, both parents were involved in 56.7% of cases while the mother was chiefly responsible in 33.3%, although these differences, which were not significant, could be due to chance. We did not find any differences between paternal versus maternal responses. We analysed parental employment status, marital status/household structure and parental educational attainment, and found that the latter was higher in the HC group (Table 2). As regards hospital-based care and visits to the paediatrician, parents of children with FDs expressed dissatisfaction with the care and the recommendations received (Table 3). When it came to social life, parents of children with FDs reported limitations in social activities and missing work as well as an impact in the couple relationship (Table 3).
Demographic characteristics of surveyed parents by group.
| Healthy controls (n = 102) | Children with FDs (n = 48) | Diseased controls (n = 88) | Pa | Pb | ||||
|---|---|---|---|---|---|---|---|---|
| n | % | n | % | n | % | |||
| Parental relationship/household | ||||||||
| Living together | 101 | 99.0 | 46 | 95.8 | 86 | 97.7 | ||
| Separated or divorced | 1 | 1.0 | 2 | 4.2 | 2 | 2.3 | .24 | .61 |
| Employment status | ||||||||
| Both parents employed | 79 | 80.6 | 28 | 58.3 | 68 | 77.3 | ||
| Only mother | 6 | 6.1 | 4 | 8.3 | 4 | 4.5 | ||
| Only father | 13 | 13.3 | 12 | 25.0 | 16 | 18.2 | ||
| Neither | 0 | 0.0 | 4 | 8.3 | 0 | 0.0 | < .01 | .01 |
| Educational attainment | ||||||||
| Primary | 5 | 4.9 | 6 | 12.5 | 11 | 12.5 | ||
| Secondary | 29 | 28.4 | 22 | 45.8 | 37 | 42.0 | ||
| University | 68 | 66.7 | 20 | 41.7 | 40 | 45.5 | .01 | .90 |
FD, feeding difficulty.
Bold values means p ≤ 0.05.
Medical care, social relationships and other.
| FD group (n = 48) | Diseased controls (n = 88) | P | ||||
|---|---|---|---|---|---|---|
| n | % | n | % | |||
| Hospital care | ||||||
| Has the child required emergency care? | A fair amount/A lota | 6 | 12.5 | 5 | 5.7 | .19 |
| Has the child required hospital admission? | Yes | 7 | 14.6 | 11 | 12.5 | .73 |
| Has the child required tube feeding? | Yes | 9 | 18.8 | 1 | 1.1 | < .01 |
| Relationship with paediatrician | ||||||
| Do you feel heard by your paediatrician? | Not at all/A littleb | 22 | 45.8 | 18 | 20.9 | < .01 |
| Did you need to insist for the paediatrician to refer your child to a specialist? | A fair amount/A lota | 21 | 43.8 | 20 | 23.0 | .01 |
| Do you agree with the recommendations given by your paediatrician? | Not at all/A littleb | 23 | 47.9 | 21 | 24.1 | .05 |
| Interpersonal relationships | ||||||
| Are you having problems in the couple due to the child’s disorder? | Not at all/A littlea | 12 | 25.0 | 2 | 2.3 | < .01 |
| Do you feel judged by others in how you manage the situation with your child? | Yes | 23 | 47.9 | 16 | 18.4 | < .01 |
| Do you feel judged by your significant other? | Yes | 6 | 12.5 | 2 | 2.3 | .02 |
| Have you sought psychological help in relation to this problem? | Yes/I’ve considered itc | 18 | 37.5 | 8 | 9.1 | < .01 |
| Have you missed work or are you unable to work due to this problem? | A fair amount/A lota | 12 | 25.0 | 1 | 1.1 | < .01 |
| Does the problem restrict your social life? | Yes | 26 | 54.2 | 31 | 35.2 | .03 |
| Other | ||||||
| Have you purchased medication/vitamin supplements not prescribed by your paediatrician? | Yes | 9 | 18.8 | 16 | 18.2 | .94 |
| Have you searched information on the problem online? | A fair amount/A lota | 22 | 45.8 | 47 | 54.0 | .36 |
FD, feeding difficulty.
Bold values means p ≤ 0.05.
When it came to parental stress levels and the risk of anxiety or depression (PSI-SF and GHQ-28), we found that parents in the group of children with FDs scored higher, with similar results when we set new thresholds based on the 90th percentile in the HC group (Tables 4 and 5). Table 6 presents the comparative analysis of the groups adjusted for differences in sex, age (less than/greater than 3 years) and respondent (father/mother); parental employment status and educational attainment were not included in the model due to evidence of colinearity. We present the adjusted mean difference in scores and adjusted ORs for values greater than the applied thresholds; it can be seen that parents of children with FDs had poorer results in all overall scores and in most subscale scores. We found sex-based differences in the GHQ-28, with a stronger anxiety/depression component in mothers (adjusted mean difference, 4; 95% CI, 0.83–7.17), but not in the PSI-SF (adjusted mean difference, 9; 95% CI, −0.17 to 18.17).
Median parenting stress (PSI-SF) and psychological risk (GHQ-28) scores.
| All scores | Healthy controls (n = 102) | children with FDs (n = 48) | Diseased controls (n = 88) | |||||
|---|---|---|---|---|---|---|---|---|
| Median | IQR | Median | IQR | Median | IQR | Pa | Pb | |
| Overall PSI-SF score | 65 | 55−76 | 82 | 68.5−107.5 | 65 | 50−80 | < .01 | < .01 |
| PD subscale | 24 | 19−75 | 30 | 23−40 | 22 | 16.5−28 | < .01 | < .01 |
| PCDI subscale | 19 | 16−24 | 23 | 17.5−29 | 18 | 15−23 | < .01 | < .01 |
| DC subscale | 22 | 19−25 | 31 | 25−36.5 | 21 | 17−28 | < .01 | < .01 |
| Overall GHQ-28 score | 16 | 12−22 | 26 | 15−34.5 | 14 | 11−21 | < .01 | < .01 |
| Subscale A | 4 | 2−7 | 7 | 3−10.5 | 4 | 2−6 | < .01 | < .01 |
| Subscale B | 5 | 2−7 | 8 | 5−11 | 4 | 2−6 | < .01 | < .01 |
| Subscale C | 7 | 6−8 | 7 | 6−9 | 7 | 6−7 | .35 | .13 |
| Subscale D | 0 | 0−1 | 2 | 0−4.5 | 0 | 0−1 | < .01 | < .01 |
| High scores | n | % | n | % | n | % | ||
|---|---|---|---|---|---|---|---|---|
| PSI-SF ≥ P85 | 1 | 1.0 | 12 | 25.0 | 0 | 0.0 | < .01 | < .01 |
| PD subscale ≥ P85 | 6 | 5.9 | 16 | 33.3 | 7 | 8.0 | < .01 | < .01 |
| PCDI subscale ≥ P85 | 2 | 2.0 | 8 | 16.7 | 2 | 2.3 | < .01 | < .01 |
| DC subscale ≥ P85 | 3 | 2.9 | 11 | 22.9 | 1 | 1.1 | < .01 | < .01 |
| PSI-SF ≥ P90 | 1 | 1.0 | 10 | 20.8 | 0 | 0.0 | < .01 | < .01 |
| PD subscale ≥ P90 | 3 | 2.9 | 13 | 27.1 | 3 | 3.4 | < .01 | < .01 |
| PCDI subscale ≥ P90 | 0 | 0.0 | 3 | 6.3 | 2 | 2.3 | .03 | .34 |
| DC subscale ≥ P90 | 2 | 2.0 | 7 | 14.6 | 0 | 0.0 | .01 | .01 |
| Abnormal GHQ-28 score | 24 | 23.5% | 26 | 54.2% | 14 | 15.9% | < .01 | < .01 |
| Subscale A | 38 | 37.3 | 29 | 60.4 | 23 | 26.1 | < .01 | < .01 |
| Subscale B | 38 | 37.3 | 35 | 72.9 | 26 | 29.5 | < .01 | < .01 |
| Subscale C | 87 | 85.3 | 39 | 81.3 | 76 | 86.4 | .53 | .43 |
| Subscale D | 5 | 4.9 | 8 | 16.7 | 6 | 6.8 | .03 | .08 |
DC, difficult child; FD, feeding difficulty; GHQ-28, General Health Questionnaire de Goldberg; IQR, interquartile range; PCDI, Parent-Child Dysfunctional Interaction; PD, parental distress; PSI-SF, Parental Stress Index Short Form.
Bold values means p ≤ 0.05.
Analysis of PSI-SF and GHQ-28 scores with healthy control group as reference.
| Children with FDs (n = 48) | Diseased controls (n = 88) | P | |||
|---|---|---|---|---|---|
| n | % | n | % | ||
| PSI-SF ≥ P90 | 23 | 47.9 | 13 | 14.8 | < .01 |
| PD subscale ≥ P90 | 20 | 41.7 | 15 | 17.0 | < .01 |
| PCDI subscale ≥ P90 | 14 | 29.2 | 8 | 9.1 | < .01 |
| DC subscale ≥ P90 | 30 | 62.5 | 21 | 23.9 | < .01 |
| GHQ-28 score ≥ P90 | 16 | 33.3 | 6 | 6.8 | < .01 |
| Subscale A ≥ P90 | 12 | 25.0 | 3 | 3.4 | < .01 |
| Subscale B ≥ P90 | 17 | 35.4 | 7 | 8.0 | < .01 |
| Subscale C ≥ P90 | 11 | 22.9 | 7 | 8.0 | .01 |
| Subscale D ≥ P90 | 14 | 29.2 | 11 | 12.5 | .01 |
| GHQ-28 score ≥ P95 | 8 | 16.7 | 2 | 2.3 | < .01 |
| Subscale A ≥ P95 | 4 | 8.3 | 1 | 1.1 | .05 |
| Subscale B ≥ P95 | 9 | 18.8 | 3 | 3.4 | < .01 |
| Subscale C ≥ P95 | 8 | 16.7 | 3 | 3.4 | .01 |
| Subscale D ≥ P95 | 8 | 16.7 | 6 | 6.8 | .08 |
DC, difficult child; FD, feeding difficulty; GHQ-28, Goldberg General Health Questionnaire-28 items; PCDI, Parent-Child Dysfunctional Interaction; PD, parental distress; PSI-SF, Parental Stress Index Short Form.
Bold values means p ≤ 0.05.
Comparative analysis of groups adjusted for age, sex and respondent (father vs mother).
| Children with FDs vs healthy controls | P | Children with FDs vs diseased controls | P | |
|---|---|---|---|---|
| All scores | DMA (95% CI) | AMD (95% CI) | ||
| Overall stress score (PSI-SF) | 21 (12.19−29.81) | < .01 | 20 (9.81−30.19) | < .01 |
| PD subscale | 5 (1.32−8.67) | .01 | 6.5 (1.79−11.20) | .01 |
| PCDI subscale | 3.5 (0.37−6.62) | .03 | 4 (0.47−7.52) | .03 |
| DC subscale | 9 (6.06−11.93) | < .01 | 9.5 (5.58−13.41) | < .01 |
| Overall GHQ-28 score | 8 (3.96−12.04) | < .01 | 11 (7.47−14.52) | < .01 |
| Subscale A | 2.5 (0.85−4.15) | < .01 | 3 (1.04−4.96) | < .01 |
| Subscale B | 4 (2.16−5.84) | < .01 | 4 (2.43−5.57) | < .01 |
| Subscale C | 0 (0.73−0.73) | 1 | 0 (0.39−0.39) | 1 |
| Subscale D | 2 (1.63−2.37) | < .01 | 2 (1.61−2.39) | < .01 |
| High scores | aOR (95% CI) | P | aOR (95% CI) | P |
|---|---|---|---|---|
| Overall stress (PSI-SF) ≥ P85 | 47.06 (5.61−394.24) | < .01 | Could not be assessed | – |
| PD subscale | 7.88 (2.78−22.33) | < .01 | 6.22 (2.28−16.99) | < .01 |
| PCDI subscale | 13.94 (2.67−72.80) | < .01 | 16.91 (3.14−91.04) | .01 |
| DC subscale | 12.05 (3.04–47.67) | < .01 | 44.96 (5.20−388.62) | < .01 |
| Overall stress (PSI-SF) ≥ P90 | 36.74 (4.33−311.20) | < .01 | Could not be assessed | – |
| PD subscale | 16.05 (3.84−67.13) | < .01 | 12.56 (3.19−49.43) | < .01 |
| PCDI subscale | Could not be assessed | – | 6.30 (0.96−41.11) | .05 |
| DC subscale | 11.25 (2.13−59.39) | < .01 | Could not be assessed | – |
| Abnormal GHQ-28 score | 4.18 (1.96−8.87) | < .01 | 6.25 (2.79−13.98) | < .01 |
| Scale A | 2.56 (1.21−5.38) | .01 | 3.86 (1.70−8.76) | < .01 |
| Scale B | 4.74 (2.18−10.32) | < .01 | 6.42 (2.93−14.06) | < .01 |
| Scale C | 0.63 (0.25−1.63) | .34 | 0.76 (0.27−2.16) | .61 |
| Scale D | 3.88 (1.19−12.58) | .02 | 2.73 (0.89−8.41) | .08 |
| GHQ-28 score ≥ P90 in catchment population | 4.14 (1.74−9.84) | < .01 | 6.83 (2.46−19.01) | < .01 |
| Subscale A | 3.39 (1.31−8.78) | .01 | 10.29 (2.68−39.47) | < .01 |
| Subscale B | 3.97 (1.69−9.37) | < .01 | 6.35 (2.40−16.78) | < .01 |
| Subscale C | 2.32 (0.92−5.91) | .08 | 3.44 (1.24−9.58) | .02 |
| Subscale D | 3.68 (1.49−9.09) | .01 | 2.88 (1.18−6.99) | .02 |
| GHQ-28 score ≥ P95 in catchment population | 3.88 (1.19−12.58) | .02 | 8.60 (1.75−42.35) | < .01 |
| Subscale A | 1.51 (0.41−7.79) | .53 | 7.91 (0.86−72.90) | .07 |
| Subscale B | 3.69 (1.23−11.07) | < .01 | 6.54 (1.68−25.49) | < .01 |
| Subscale C | 3.65 (1.11−11.99) | .03 | 5.67 (1.43−22.50) | .01 |
| Subscale D | 3.88 (1.19−12.58) | .02 | 2.73 (0.89−8.41) | .08 |
AMD, adjusted mean difference; aOR, adjusted odds ratio; CI, confidence interval; DC, difficult child; FD, feeding difficulty; GHQ-28, Goldberg General Health Questionnaire-28 items; PCDI, Parent-Child Dysfunctional Interaction; PD, parental distress; PSI-SF, Parental Stress Index Short Form.
Bold values means p ≤ 0.05.
Tables S1 to S5 of the Appendix B supplemental present the comparison between the FD group and the coeliac disease subset of the DC group. We did not find any noteworthy differences relative to the comparison with the overall DC group.
DiscussionThe results of our study show that the parents of children with FDs have high levels of stress, even exceeding the levels found in parents of patients with other gastrointestinal diseases.
In the GHQ-28, an instrument developed to detect social dysfunction, somatic symptoms, anxiety and depression, we found unexpectedly high, clinically significant scores in the HC group, so we readjusted the cut-off points to the 90th percentile obtained in this group; applying these new thresholds, 1 in 3 parents of children with FDs were at risk of mental health problems. We also found a relevant impact on the social and family life of parents of children with FDs, as a significantly greater proportion reported problems: 1 in 4 believed that the FD was affecting the couple relationship and even felt judged by their partner. At the social level, nearly 50% felt judged by others on how they managed the situation, and more than half reported restrictions in their social life due to the child’s problem. In addition, 1 in 4 reported having to miss work, and 1 in 3 having sought or considered seeking psychological support.
Primiparity, a previously described risk factor, was not found to be significant in our study, although low birth weight was.16 Tube feeding has been described as a factor that can trigger FDs,1 but we did not have the necessary data to assess the temporal association between them in our study.
The degree of dissatisfaction with the care received and the recommendations given by the paediatrician was twice as large in the group with FDs compared with the group with other gastrointestinal diseases, a difference that was statistically significant, as nearly half of the respondents felt that they had no rapport with their paediatricians and disagreed with the treatment plan, and even felt that they had to insist to get referred to a specialist.
Previous studies have described the association between stress in parents and feeding difficulties in their children. Parents feel responsible for their children to have what they consider a healthy and varied diet.4 They think that their role as carers is reflected in their ability to feed their children, and when expectations fail, food-related anxiety may increase.17 Mealtimes become stressful and negative experiences in which parents are unable to enjoy the bond with the child,18 which puts pressure on the child to eat.19 The presence of clinical symptoms in the mother (anxiety, depression or hostility) is associated with dysfunctional interaction patterns during meals.20–23 In our study, we also found differences based on sex, with an increased risk of anxiety and depressive traits in mothers, with no significant differences in overall stress levels compared to fathers. It is worth noting that while the mother was the parent usually in charge of feeding HCs before age 3 years, this was not the case in the group of children with FDs, in which both parents tended to share the responsibility of feeding the child. A possible interpretation is that fathers tend to be more actively involved in feeding the child when the child has feeding difficulties.
There is evidence that functional abdominal pain and functional constipation may cause an impairment in patient quality of life similar to the one caused by other organic diseases24 or coeliac disease.25 However, in our study, both parental stress and anxiety and depression traits were significantly greater or more frequent in the FD group compared to the group with other gastrointestinal disorders.
We are aware of limitations to our study, chiefly the small number of children with FDs and no underlying disease meeting the inclusion criteria. It is possible that the recruitment in a hospital setting of patients meeting stringent criteria in whom other functional or organic disorders have been ruled out (which guaranteed that cases were children with FDs with no underlying disease) was the reason for the scant recruitment. On the other hand, children aged less than 3 years were underrepresented in the DC group due to the greater age of patients with the selected disorders. Healthy controls were also slightly older (median difference, 0.62 years), although the difference was not statistically significant. We were unable to stratify by age because the sample was not large enough. To control for a potential age-related bias, we conducted a multivariate analysis, according to which age did not appear to be a confounder.
ConclusionsParents of poor eaters exhibit high stress levels and an increased risk of anxiety and depression, with a significant impact at the social, family, couple and employment levels. Acknowledging the sizeable impact associated with this type of disorders could contribute decisively to their resolution. As paediatricians, it is our responsibility to seek tools or strategies to identify these repercussions on affected families to be able to implement a comprehensive approach, caring not only for the child, but for the family as well.
The relationship with the paediatrician can also be affected. Taking all of these aspects into account can help us improve our clinical approach and nurture the physician-patient relationship.
FundingThis project was awarded a Є1000 grant from the Fundación Burgos por la Investigación de la Salud (CIG G-09254616) in January 2017.
Conflicts of interestThe authors have no conflicts of interest to declare.
Hernández Frutos, Esther; Hospital Santos Reyes (Aranda de Duero, Burgos). Serna Cubillo, Isabel; Centro de Salud Cristóbal Acosta (Burgos). Cilla Lizarraga, Amaia; Centro de Salud José Luis Santamaría (Burgos). Camino Fernández, Ana; Centro de Salud Los Cubos (Burgos). Elvira Pardilla, Ana; Centro de Salud Santa Clara (Burgos). Rámila de la Torre, Elsa; Centro de Salud Santa Clara (Burgos). Santamaría Marcos, Elena; Centro de Salud San Agustín (Burgos). Kannan Leis, Sara; Hospital Santa Bárbara (Soria). Alonso Vicente, Carmen; Hospital Universitario El Clínico (Valladolid). Bartolomé Porro, Juan; Hospital Río Carrión (Palencia). Galicia Plobet, Gonzalo; Hospital Universitario de Guadalajara (Guadalajara). Martínez Escribano, Beatriz; Hospital Universitario de Fuenlabrada (Madrid). Cañedo Villarroya, Elvira; Hospital Universitario Niño Jesús (Madrid). Parejo Diaz, Patricia; Segovia Health Care Area. Martínez Cuevas, Elena; Centro de Salud Gamonal Antigua (Burgos). Vecino López, Raquel; Hospital Clínico San Carlos (Madrid). Rizo Pascual, Jana; Hospital Universitario Infanta Sofía (Madrid). La Orden Izquierdo, Enrique; Hospital Universitario Infanta Elena (Valdemoro, Madrid). Balmaseda Serrano, Elena; Hospital de Albacete (Albacete). Torrecilla Cañas, Javier; Hospital Virgen de la Luz (Cuenca). Hernández Bertó, Tomás; Hospital de Albacete (Albacete). Donado Palencia, Paloma; Hospital General Universitario Ciudad Real (Ciudad Real). Martín Sacristán, Beatriz; Complejo Hospitalario de Toledo (Toledo). Crespo Madrid, Nuria; Complejo Hospitalario de Toledo (Toledo). Cuadrado Martín, Soraya; Hospital Nuestra Señora del Prado (Talavera de la Reina, Toledo).
The following is Supplementary data to this article:

