

Cerebral palsy (CP) is the most frequent cause of motor disability in the paediatric age. The aim of this article is the study of the nutritional status of patients with CP followed-up in a reference hospital, as well as the relationship between neurological and nutritional state.
Material and methodsA cross-sectional, observational, descriptive and analytical study was conducted on a sample consisting of 4–15 year old patients with CP with Gross Motor Function Classification System (GMFCS) grades III–IV–V, from a specialised paediatric hospital reference area. An interview (collection of general data, medications and nutritional habits), anthropometric study and bioimpedance (BIA) measurements were carried out.
ResultsThe study included 69 patients (recruitment 84.15%), with a mean age of 10.46±0.43 years, and 50.7% females. The distribution according to GMFCS scale was: grade III (36.2%), grade IV (29%), and grade V (34.8%). According to weight for height: moderate malnutrition 21.8% (grade V: 33.3%), severe malnutrition 5.8% (grade V: 12.6%), overweight/obesity 23.2% (grade III: 24%, grade IV: 35%). Adequate level of lean mass for height: grade III (36%), grade IV (55%), and grade V (16.7%). Fat excess: grade III (36%), grade IV (40%), and grade V (29.2%). Fat mass comparison: BIA 6.89±0.64kg versus anthropometry 5.56±4.43kg.
ConclusionsIn CP grade GMFCS V, the weight deficit associated with a decrease in lean body mass is common. Patients with CP grades GMFCS III–IV have a significant prevalence of overweight/obesity. Anthropometry is a useful tool for nutritional assessment in children with CP, although fat levels could be underestimated.
La parálisis cerebral (PC) es la causa más frecuente de discapacidad motora en edad pediátrica. El objetivo es estudiar la situación nutricional de los pacientes con PC controlados en una unidad de referencia, así como la relación entre la afectación neurológica y nutricional.
Material y métodosEstudio transversal, observacional, descriptivo y analítico en el que se han incluido pacientes con PC con grados III–IV–V (GMFCS) procedentes del área de influencia de un hospital pediátrico de referencia, con edades de 4–15 años. Se ha realizado: encuesta (con recogida de datos generales, medicaciones y hábitos nutricionales), estudio antropométrico y bioimpedanciometría (BIA).
ResultadosN=69 pacientes (reclutamiento 84,15%). Edad media 10,46±0.43 años, el 50,7% mujeres. Distribución según GMFCS: grado III (36,2%), grado IV (29%), grado V (34,8%). Según el peso para la talla: desnutrición moderada el 21,8% (grado V: 33,3%), desnutrición grave el 5,8% (grado V: 12.6%), sobrepeso/obesidad el 23,2% (grado III: 24%; grado IV: 35%). Nivel adecuado de masa magra para su talla: grado III (36%), grado IV (55%), grado V (16,7%). Exceso de grasa: grado III (36%), grado IV (40%), grado V (29,2%). Comparación de masa grasa: BIA 6,89±0,64kg Vs antropometría 5,56±4,43kg.
ConclusionesEn PC grado GMFCS V es frecuente el déficit de peso asociado a disminución de masa magra para su talla. Los pacientes con PC grados GMFCS III-IV presentan una prevalencia llamativa de sobrepeso/obesidad. La antropometría es una herramienta útil para la valoración nutricional en niños con PC, aunque los niveles de grasa tienden a infravalorarse.
Cerebral palsy (CP) is the most frequent cause of motor impairment in the paediatric age group and the third leading cause of neurodevelopmental disorders following intellectual disability and autism spectrum disorders. The term CP refers to motor sequelae that may be accompanied by other disorders and does not carry any aetiological implications or an association with a specific past medical history or adverse events.
The collaborative project known as Surveillance of Cerebral Palsy in Europe1 has reported an incidence of CP of 2–3 cases per 1000 live births. This group recommends a minimum age of 3 years for diagnosis of CP and considers age 5 years optimal.
Feeding problems are frequent in children with CP, although nutritional and feeding problems are more frequent and severe in those with more severe neurologic impairment.2,3 The reported prevalence of malnutrition varies widely between case series, ranging between 19% and 50.9%.4,5
Nutritional management aims at ensuring optimal growth, preventing malnutrition and disorders related to nutritional deficiencies, and at establishing healthy dietary habits to prevent the development of diseases associated with poor nutrition.6 An adequate nutritional status improves outcomes in motor skills, cognitive stills, communication and social interaction, and therefore overall neurodevelopmental outcomes.7,8
Nutritional and dietary measures must be safe and effective, allowing to the extent possible the enjoyment of food. All of the above requires continuous, comprehensive, coordinated and close monitoring based on a multidisciplinary approach, with participation of paediatric neurologists, gastroenterologists, nutritionists/dietitians, nursing staff, speech therapists and rehabilitation specialists.6,9
The aim of our study was to assess the nutritional status of patients with predominantly spastic CP and the degree of nutritional compromise based on the severity of CP.
Materials and methodsWe conducted a cross-sectional, observational, descriptive and inferential study. The study universe consisted of the patients aged 4–15 years with moderate to severe predominantly spastic CP managed in the paediatric neurology unit of a referral hospital.
We included patients at levels III, IV or IV of the Gross Motor Function Classification System (GMFCS) developed by Palisano et al.10 and modified according to the International Classification of Functioning, Disability and Health (ICF) of the World Health Organization (WHO), which categorises patients based on the degree of motor impairment.
We excluded patients who refused or whose parents refused to participate in the study, those outside the age range under study, and those that did not meet the diagnostic criteria for CP.
The study was approved by the Regional Ethics Committee (CEICA; PI16/039). All participating patients and/or their guardians signed an informed consent form.
After ascertaining that patients met the inclusion criteria, we contacted the patient or the guardians to schedule an office visit during which we carried out a clinical interview to collect data on variables related to the patient’s clinical condition, anthropometric values and dietary habits.
For the anthropometric assessment, we used the height calculated by means of the knee-height (KH) stature estimate equation developed by Stevenson11: height=KH×2.69+24.2cm. The other anthropometric measurements taken were the weight, arm circumference (AC), subcutaneous skinfolds (biceps, triceps [TSF], subscapular, suprailiac). These measurements were made with measuring tape (perimeter and segmental height measures), Holtain® skinfold callipers (subcutaneous folds), scale (weight) and callipers (knee height). We used the Siri equation to estimate body composition.
We calculated the z-scores for the obtained anthropometric values using the growth tables of Carrascosa et al. (2010) as Ref.12 in adherence to the recommendation made in 2017 by the European Society for Paediatric Gastroenterology, Hepatology and Nutrition (ESPGHAN) of using a standardised reference population. We calculated the body mass index (BMI) and the weight-for-height (WFH) to categorise the nutritional status of the patient based on weight: WFH=patient weight/expected weight for height (50th percentile)×100.
We evaluated the body composition of the patients using bioelectrical impedance analysis (BIA) with an Akern BIA-101 Anniversary bio-impedance analyser. This method allowed us to obtain values for the total body water (extracellular and intracellular e intracellular), fat body mass, body cell mass (total mass of living, functioning and metabolically active cells) and lean body mass (muscle mass and bone mass).13,14 Measurements are obtained by adhering electrodes to the skin to generate a small alternating current in a single or multiple frequencies, recording the resistance (opposition to the passage of the electric current) and the reactance (the delay in conduction caused by cellular membranes, tissue interfaces and non-ionic tissues).13
Patients underwent BIA following a fast of at least 4h, after avoiding physical activity for at least the last 12h and in a state of absolute rest. The measurements were made with the patient lying in the supine position with the arms abducted at 20°–30° and the legs at 45° from the trunk. The 2 current-introducing electrodes were placed in the midlines of the wrist and the ankle of the unclothed patient lying on a cot made of non-conductive material, and the voltage-sensing electrodes 4–5cm away from the source along the metacarpal and the metatarsal phalangeal lines, respectively; always homolaterally (hemibody).
In order to accurately assess lean body mass and eliminate the potential bias associated with low weight in these patients, we calculated the expected percentage of lean mass for their height. To do so, after obtaining the expected weight for their height (using the median in the growth charts of Carrascosa et al., 2010), we calculated the expected kilograms of lean mass (using the references published by Fomon15 and Haschke16) and, lastly, divided the lean body mass of the patient by the expected lean body mass (both in kg).
To classify lean body mass values, we applied the cutoffs proposed by Lohman and Going17: underfat (<10% in boys and <15% in girls), normal (11–25% in boys and 16–30% in girls) and excess fat (>25% in boys and >30% in girls).
Our statistical analysis was performed with the software SPSS Statistics version 21.0. We did a descriptive analysis, summarising the results as mean±standard deviation (SD) with the 95% confidence interval (quantitative variables) or as frequencies (qualitative variables). We tested for normality with the Kolmogorov-Smirnov and Shapiro-Wilk tests. Afterward, we performed hypothesis testing with different methods: chi square test and Fisher exact test (qualitative variables), Student t test (parametric data, quantitative and dichotomous variables), Mann-Whitney U test (nonparametric data, quantitative and dichotomous variables), analysis of variance (ANOVA) with the Bonferroni correction (parametric data, quantitative and dichotomous variables) and Kruskal-Wallis test (nonparametric data, quantitative and non-dichotomous qualitative).
ResultsA total of 82 patients met the inclusion criteria, but we were unable to locate or obtain content for participation from 13, so the final sample included 69 patients (recruitment of 84.2%). Of this total, 50.7% (n=35) were female. The distribution of patients by level of functioning based on the GMFCS was as follows: level III, 36.2% (n=25); level IV, 29.0% (n=20); level V, 34.8% (n=24). The mean age was 10.46±0.4 years (level III, 10.83±0.7 years; level IV, 10.89±0.8 years; level V, 9.73±0.7 years; P=.380).
The distribution by form of CP based on the predominant clinical pattern was: spastic, 75.4% (n = 52); mixed, 17.4% (n = 12); and dystonic, 7.2% (n = 5), although all patients exhibited spasticity (100%). The extension of paresis was: tetraparesis (59.4%; (n = 41), triparesis 21.7% (n = 15), diparesis 18.9% (n = 13). Of all patients, 73.9% (n = 51) received regular doses of botulinum toxin, with no differences in frequency between groups.
The distribution of patients by feeding modality was: exclusively oral, 87% (n = 60); exclusively enteral, 10.1% (n = 7); mixed, 2.9% (n = 2). Thirteen percent of patients in the sample (n = 9) had a gastrostomy, all of them classified as level V.
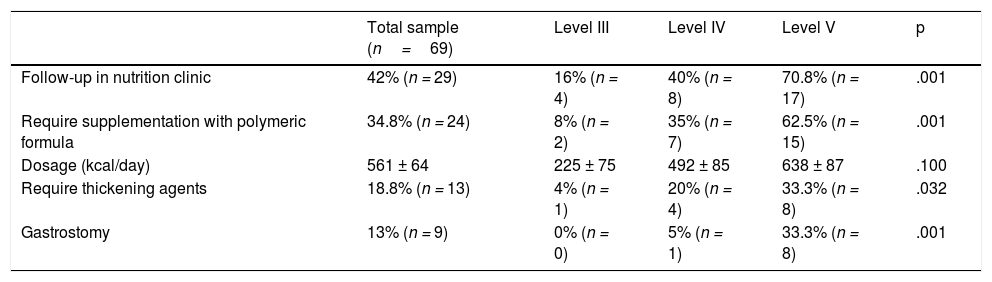
Table 1 presents information on the use of supplements and nutritional support in the sample, evincing that the use of polymeric formulas and thickening agents increased with the level of neurologic impairment.
Frequency of follow-up in specialty nutrition clinic and of use of nutritional supplementation by GMFCS level.
| Total sample (n=69) | Level III | Level IV | Level V | p | |
|---|---|---|---|---|---|
| Follow-up in nutrition clinic | 42% (n = 29) | 16% (n = 4) | 40% (n = 8) | 70.8% (n = 17) | .001 |
| Require supplementation with polymeric formula | 34.8% (n = 24) | 8% (n = 2) | 35% (n = 7) | 62.5% (n = 15) | .001 |
| Dosage (kcal/day) | 561 ± 64 | 225 ± 75 | 492 ± 85 | 638 ± 87 | .100 |
| Require thickening agents | 18.8% (n = 13) | 4% (n = 1) | 20% (n = 4) | 33.3% (n = 8) | .032 |
| Gastrostomy | 13% (n = 9) | 0% (n = 0) | 5% (n = 1) | 33.3% (n = 8) | .001 |
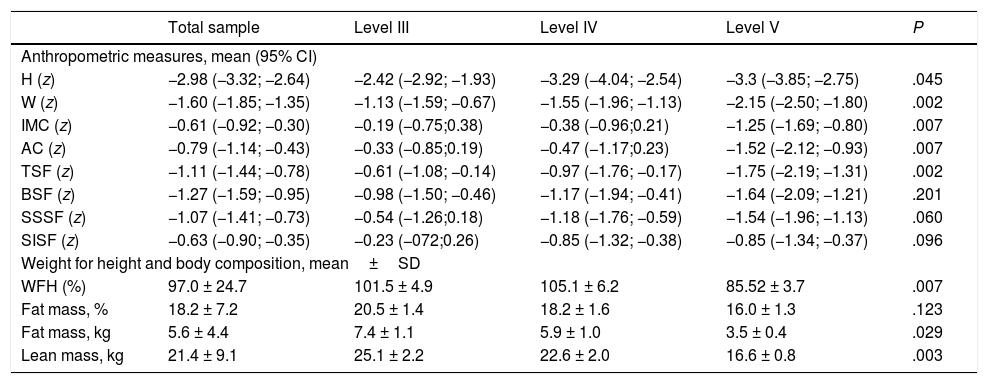
Table 2 presents anthropometric data and body composition values calculated using anthropometric measures. We found a higher frequency of anthropometric z-scores in the abnormal range in patients with more severe motor impairment, which was particularly marked in the variables most relevant for assessment of nutritional status in patients with CP: BMI, AC, TSF, WFH.
Anthropometric and body composition measures (calculated based on anthropometric measures) by GMFCS level.
| Total sample | Level III | Level IV | Level V | P | |
|---|---|---|---|---|---|
| Anthropometric measures, mean (95% CI) | |||||
| H (z) | −2.98 (−3.32; −2.64) | −2.42 (−2.92; −1.93) | −3.29 (−4.04; −2.54) | −3.3 (−3.85; −2.75) | .045 |
| W (z) | −1.60 (−1.85; −1.35) | −1.13 (−1.59; −0.67) | −1.55 (−1.96; −1.13) | −2.15 (−2.50; −1.80) | .002 |
| IMC (z) | −0.61 (−0.92; −0.30) | −0.19 (−0.75;0.38) | −0.38 (−0.96;0.21) | −1.25 (−1.69; −0.80) | .007 |
| AC (z) | −0.79 (−1.14; −0.43) | −0.33 (−0.85;0.19) | −0.47 (−1.17;0.23) | −1.52 (−2.12; −0.93) | .007 |
| TSF (z) | −1.11 (−1.44; −0.78) | −0.61 (−1.08; −0.14) | −0.97 (−1.76; −0.17) | −1.75 (−2.19; −1.31) | .002 |
| BSF (z) | −1.27 (−1.59; −0.95) | −0.98 (−1.50; −0.46) | −1.17 (−1.94; −0.41) | −1.64 (−2.09; −1.21) | .201 |
| SSSF (z) | −1.07 (−1.41; −0.73) | −0.54 (−1.26;0.18) | −1.18 (−1.76; −0.59) | −1.54 (−1.96; −1.13) | .060 |
| SISF (z) | −0.63 (−0.90; −0.35) | −0.23 (−072;0.26) | −0.85 (−1.32; −0.38) | −0.85 (−1.34; −0.37) | .096 |
| Weight for height and body composition, mean±SD | |||||
| WFH (%) | 97.0 ± 24.7 | 101.5 ± 4.9 | 105.1 ± 6.2 | 85.52 ± 3.7 | .007 |
| Fat mass, % | 18.2 ± 7.2 | 20.5 ± 1.4 | 18.2 ± 1.6 | 16.0 ± 1.3 | .123 |
| Fat mass, kg | 5.6 ± 4.4 | 7.4 ± 1.1 | 5.9 ± 1.0 | 3.5 ± 0.4 | .029 |
| Lean mass, kg | 21.4 ± 9.1 | 25.1 ± 2.2 | 22.6 ± 2.0 | 16.6 ± 0.8 | .003 |
AC, arm circumference; BMI, body mass index; BSF, biceps skin fold; CI, confidence interval; H, height; SD, standard deviation; SISF, suprailiac skinfold; SSSF, subscapular skinfold; TSF, triceps skinfold; W, weight; WFH, weight for height.
The tibial length and knee height could not be assessed in one patient that had undergone a bilateral bone surgery, so this patient underwent segmental measurements.
We did not find differences in weight, height or BMI based on sex.
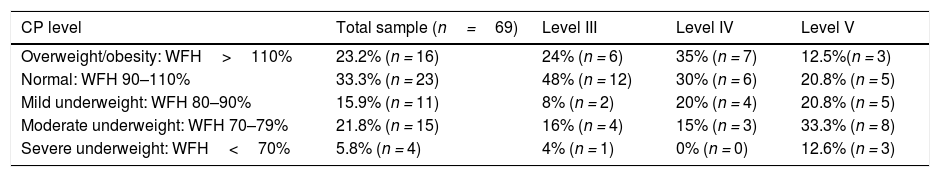
When we classified the patients based on the WFH, we found that most cases of moderate to severe undernutrition occurred in the level V group, while most cases of overweight/obesity occurred in groups III and IV III–IV (Table 3).
Nutritional status of patients by GMFCS level.
| CP level | Total sample (n=69) | Level III | Level IV | Level V |
|---|---|---|---|---|
| Overweight/obesity: WFH>110% | 23.2% (n = 16) | 24% (n = 6) | 35% (n = 7) | 12.5%(n = 3) |
| Normal: WFH 90–110% | 33.3% (n = 23) | 48% (n = 12) | 30% (n = 6) | 20.8% (n = 5) |
| Mild underweight: WFH 80–90% | 15.9% (n = 11) | 8% (n = 2) | 20% (n = 4) | 20.8% (n = 5) |
| Moderate underweight: WFH 70–79% | 21.8% (n = 15) | 16% (n = 4) | 15% (n = 3) | 33.3% (n = 8) |
| Severe underweight: WFH<70% | 5.8% (n = 4) | 4% (n = 1) | 0% (n = 0) | 12.6% (n = 3) |
WFH, weight-for-height.
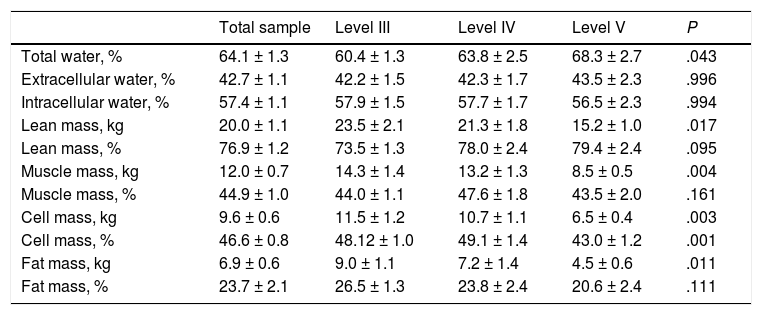
Table 4 presents the body composition data obtained by BIA. We found a significant decrease in the cellular mass in the Level V group compared to the rest of the sample. We also found a decrease in the lean body mass, muscle mass and fat mass in these patients, but only in terms of absolute amounts as opposed to the percentages of the total body mass.
Body composition calculated by bioelectrical impedance analysis (BIA) by GMFCS level.
| Total sample | Level III | Level IV | Level V | P | |
|---|---|---|---|---|---|
| Total water, % | 64.1 ± 1.3 | 60.4 ± 1.3 | 63.8 ± 2.5 | 68.3 ± 2.7 | .043 |
| Extracellular water, % | 42.7 ± 1.1 | 42.2 ± 1.5 | 42.3 ± 1.7 | 43.5 ± 2.3 | .996 |
| Intracellular water, % | 57.4 ± 1.1 | 57.9 ± 1.5 | 57.7 ± 1.7 | 56.5 ± 2.3 | .994 |
| Lean mass, kg | 20.0 ± 1.1 | 23.5 ± 2.1 | 21.3 ± 1.8 | 15.2 ± 1.0 | .017 |
| Lean mass, % | 76.9 ± 1.2 | 73.5 ± 1.3 | 78.0 ± 2.4 | 79.4 ± 2.4 | .095 |
| Muscle mass, kg | 12.0 ± 0.7 | 14.3 ± 1.4 | 13.2 ± 1.3 | 8.5 ± 0.5 | .004 |
| Muscle mass, % | 44.9 ± 1.0 | 44.0 ± 1.1 | 47.6 ± 1.8 | 43.5 ± 2.0 | .161 |
| Cell mass, kg | 9.6 ± 0.6 | 11.5 ± 1.2 | 10.7 ± 1.1 | 6.5 ± 0.4 | .003 |
| Cell mass, % | 46.6 ± 0.8 | 48.12 ± 1.0 | 49.1 ± 1.4 | 43.0 ± 1.2 | .001 |
| Fat mass, kg | 6.9 ± 0.6 | 9.0 ± 1.1 | 7.2 ± 1.4 | 4.5 ± 0.6 | .011 |
| Fat mass, % | 23.7 ± 2.1 | 26.5 ± 1.3 | 23.8 ± 2.4 | 20.6 ± 2.4 | .111 |
In this sample, 14.5% of patients (n = 10) were underfat based on the findings of BIA, while 50.7% (n = 35) had a normal fat mas and 34.8% (n = 24) excess fat. The distribution by GMFCS level was as follows (P = .104):
- •
III: 0% (n = 0) underfat, 64% (n = 16) normal fat and 36% (n = 9) excess fat.
- •
IV: 20% (n = 4) underfat, normal 40% (n = 8) normal fat, 40% (n = 8) excess fat.
- •
V: 25% (n = 6) underfat, 50% (n = 12) normal fat, 25% (n = 6) excess fat.
The distribution of male patients by body fat was: 11.8% underfat (<10%), 41.2% normal fat (11–25%), 47% excess fat (>25%). The distribution of male patients by body fat was: 17.1% underfat (<15%), 60% normal fat (16–30%), 22.9% excess fat (>30%). We did not find an association between sex and the prevalence of underfat/normal fat/excess fat established using BIA.
In the overall sample, the lean body mass was 88.7% of the lean body mass expected for height. This percentage was higher in the level III group (88.93 ± 3.5%) and the level IV group (98.31 ± 5.7%), and lower in the level V group (80.66 ± 2.8%) (P = .012). Fig. 1 shows the distribution of the percentage of lean body mass relative to the expected lean body mass by group.

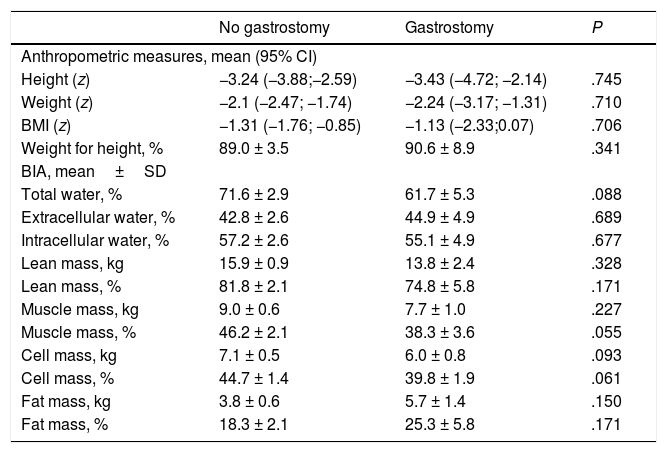
In the level V group (n = 24), 33.3% (n = 8) of patients had a gastrostomy. The mean age of patients with a gastrostomy was 9.73 ± 3.3 years (no difference between patients with and without a gastrostomy), and 50% were girls. The mean time elapsed between the placement of the gastrostomy tube and the time of the study was 43.89 ± 8.5 months. Table 5 compares the body composition and nutritional status markers in patients with and without a gastrostomy, revealing that patients with gastrostomy had lower body muscle and body cell masses.
Anthropometric and body composition assessment by bioelectrical impedance analysis (BIA) in patients at GMFCS level V with and without a gastrostomy.
| No gastrostomy | Gastrostomy | P | |
|---|---|---|---|
| Anthropometric measures, mean (95% CI) | |||
| Height (z) | −3.24 (−3.88;−2.59) | −3.43 (−4.72; −2.14) | .745 |
| Weight (z) | −2.1 (−2.47; −1.74) | −2.24 (−3.17; −1.31) | .710 |
| BMI (z) | −1.31 (−1.76; −0.85) | −1.13 (−2.33;0.07) | .706 |
| Weight for height, % | 89.0 ± 3.5 | 90.6 ± 8.9 | .341 |
| BIA, mean±SD | |||
| Total water, % | 71.6 ± 2.9 | 61.7 ± 5.3 | .088 |
| Extracellular water, % | 42.8 ± 2.6 | 44.9 ± 4.9 | .689 |
| Intracellular water, % | 57.2 ± 2.6 | 55.1 ± 4.9 | .677 |
| Lean mass, kg | 15.9 ± 0.9 | 13.8 ± 2.4 | .328 |
| Lean mass, % | 81.8 ± 2.1 | 74.8 ± 5.8 | .171 |
| Muscle mass, kg | 9.0 ± 0.6 | 7.7 ± 1.0 | .227 |
| Muscle mass, % | 46.2 ± 2.1 | 38.3 ± 3.6 | .055 |
| Cell mass, kg | 7.1 ± 0.5 | 6.0 ± 0.8 | .093 |
| Cell mass, % | 44.7 ± 1.4 | 39.8 ± 1.9 | .061 |
| Fat mass, kg | 3.8 ± 0.6 | 5.7 ± 1.4 | .150 |
| Fat mass, % | 18.3 ± 2.1 | 25.3 ± 5.8 | .171 |
BMI, body mass index; CI, confidence interval; SD, standard deviation.
Maintaining an adequate nutrition in patients with CP requires periodical and routine monitoring of nutritional status to detect actual malnutrition or its risk early on.5 However, less than half of the patients in our study were in follow-up with regular evaluations by a nutrition specialist.
Due to their accessibility, anthropometric methods are most commonly used to assess nutritional outcomes, and the weight, height, TSF and AC are the most widely recommended values for monitoring of patients with CP.4,5,18,19
When it came to stature, we found that the degree of abnormality was directly proportional to the severity of CP. This was to be expected, as the growth and body composition patterns in patients with CP differ from those of the reference population for age and sex.20 As occurred in our study, stunting tends to be more severe the more severe the neurologic impairment and the feeding difficulties.21 Measuring the height of patients at levels III to V is usually challenging due to the presence of scoliosis, spasticity and postural abnormalities. For this reason, it is recommended that height be assessed by taking segmental measurements and using an equation to estimate the stature,8,22 for which the knee height seems to be the measure least likely to be affected by least technical errors and associated with the lowest intrarater and interrater variability.19,23
It is advisable that weight assessments take into account height by using the BMI and/or the WFH. In our study, categorization based on WFH resulted in a higher proportion of patients with undernutrition in the GMFCS level V group. In contrast, we found a high prevalence of overweight/obesity with an excess of body fat in patients with GMFCS levels III to IV. Such excess weight is relatively frequent in patients at levels III to IV that have no feeding problems depending on the level of impairment of motor skills or walking.20
In 2007, Day et al. published specific weight, height and BMI tables for children with CP21 based on the level of motor impairment.4 These tables are only descriptive and have not been standardised, as there were many factors at play in the study, such as a high prevalence of malnutrition, that could affect anthropometric variables, and therefore the tables do not reflect optimal growth patterns. For this reason, the ESPGHAN recommends against the routine use of these tables to assess for nutritional problems in children with CP, and instead proposes using standardised reference population data.19
In addition to the weight, the height and their relationships, the ESPGHAN recommends routine measurement of subcutaneous skinfolds (especially the TSF) and of the AC to monitor nutritional status.19 In our sample, patients with severe neurologic impairment had the lowest TSF and AC values. The evidence on this aspect is contradictory, as some studies have found similar trends while others have found no association between the level of neurologic impairment and the variability in skinfold and circumference measures,20,24 and therefore further research is required to corroborate our findings.
In addition to calculating the z-scores corresponding to the anthropometric measures, it is also important to determine how the weight of the patient is distributed according to body composition. This can be achieved with equations that use skinfold measures, although these equations may not be very accurate in children with CP.19 Other methods are available to assess body composition, and BIA is an essential tool in clinical practice for this purpose.19 It is a safe, reliable, painless and quick method for assessment of body composition that is more accurate and with a lesser interrater and intrarater variability compared to other methods.20,25
In our study, BIA found a lower muscle mass, lean body mass and fat mass (in kg) in patients with greater impairment based on the GMFCS. This was consistent with the previous literature, in which greater neurologic impairment is associate with decreased body weight, growth and lean body mass.4
When it came to the percentage of lean body mass, we found that it was greater in patients at level V in absolute terms, but when we adjusted the lean mass for height, we found a greater decrease in this group. This is why it is important to evaluate the obtained measures relative to the age, height and sex of the patient. We found it interesting that the lean mass was greater in patients at level IV compared to patients at level III. A possible explanation is that 40% of patients in the level IV group were in follow-up by the nutrition unit, compared to 16% of patients in the level III group. Other authors have reported these positive changes in body composition once regular nutritional follow-up is initiated,26 so the ESPGHAN recommends performance of growth assessments in patients with CP every 1–3 months.19
Another parameter that can be measured by BIA is the cell mass, which is considered a good marker of nutritional status.14 As occurred in our sample, a study published in 2017 by Sung et al.27 in a series of 146 patients found a decrease in cell mass in patients with more severe neurologic impairment, especially those with level V functioning. When it comes to the fat compartment, a study published by Kuperminc et al.20 in 2008 analysed the normal percentage of body fat in patients at levels III to V, and found lower percentages of body fat compared to the percentages found in all groups.
Compared to BIA, anthropometric methods underestimate the fat body mass and overestimates the lean body mass. It has been estimated that anthropometric measures led to a systematic error of approximately 1.3kg in calculating the fat body mass,20 an error similar to the error found in our study. One possible reason is that a decrease in peripheral cutaneous skinfold measures may not necessarily indicate a decrease in adiposity, as fat tends to be stored in the abdominal region in children with CP.19,28
Gastrostomy tube feeding can be used in case oral intake does not contribute adequate amounts of nutrients, causes discomfort or is unsafe.3,19 The proportion of patients that required a gastrostomy in our sample was consistent with the 10–33% range reported in other case series.7 When comparing nutritional status in patients with and without a gastrostomy, previous studies have concluded that patients with gastrostomies have better nutritional outcomes, especially in terms of weight, BMI, fat body mass and lean body mass.2,21 However, in our sample patients with gastrostomies only exhibited an improvement in weight, with an increase in fat body mass but no increase in the lean body mass. This could be due to a greater degree of neurologic impairment in patients requiring enteral feeding, or to the higher intake of fat associated with gastrostomy tube feeding.2
The main limitation of our study was the small sample size, which was compounded by the division of the sample into groups, although the sample was representative of the catchment population of a regional referral hospital, of considerable size, and the results were statistically significant. Nevertheless, it would be interesting to expand the scope of this investigation with additional studies allowing a comparison of nutritional status with its actual impact on quality of life.
To conclude, a higher proportion of patients with CP and more severe neurologic impairment are more likely to experience undernutrition, whereas one third of patients with less severe forms of CP exhibited overweight or obesity. Although anthropometry is a widely accessible and very useful tool for nutritional assessment, BIA can be a helpful addition for the non-invasive monitoring of body composition, as traditional anthropometric methods underestimate fat body mass and overestimate lean body mass. When we adjusted the lean body mass for height, we found greater deficits in patients at level V, so it would be relevant to analyse obtained results in relation to age, height and sex. Due to all of the above, performance of both routine and individualised evaluations in patients with CP are needed to ensure adequate nutritional management and to improve the health, quality of life and developmental outcomes in these patients.
Conflicts of interestThe authors have no conflicts of interest to declare.
We thank Ana Moráis for her contribution to the development of the construct of the lean body mass adjusted for height.
Please cite this article as: Fernández JMMdZ, Arnal IR, Segura JLP, Romero RG, Martínez GR. Situación nutricional en una población con parálisis cerebral moderada-grave: más allá del peso. An Pediatr (Barc). 2020;92:192–199.
