


Cerebral palsy (CP) encompasses a group of motor disorders that can result in swallowing difficulties, affecting food intake and contributing to poor nutritional status. The goal of the study was to describe the clinical and nutritional characteristics of Spanish children with CP.
MethodsMulticenter observational study conducted in children aged 4–14 years with a diagnosis of CP. For every patient, we collected data on sociodemographic and clinical characteristics as well as anthropometric measurements, schooling modality, nutrition received at school, nutritional support and gastrointestinal comorbidities.
ResultsThe sample included a total of 112 patients with a mean age of 9.2 years old. The majority (70.5%) had been classified as Gross Motor Function Classification System (GMFCS) level IV or V. Compared to children classified as GMFCS level I, II or III, the group of children with GMFCS level IV/V had significantly lower mean z scores in body weight, height, weight-to-height ratio, body mass index and upper arm circumference and a significant lower mean arm area. A higher proportion of patients with GMFCS level IV/V attended special education schools compared to patients classified as level I to III (68.4% vs. 12.1%; P < .0001). A higher proportion of children classified as level IV/V compared to children classified as levels I to III presented dysphagia (62.0% vs. 15.2%; P < .0001), constipation (51.9% vs. 27.3%, P = .0218) and gastroesophageal reflux (31.6% vs. 3.0%; P = .0005).
ConclusionsOur study shows that Spanish children with CP, especially those with severe motor impairment, are at risk of malnutrition, present gastrointestinal comorbidities and require nutritional support.
La parálisis cerebral (PC) abarca un grupo de trastornos motores que pueden resultar en dificultades para tragar, afectando la ingesta de alimentos y contribuyendo a un deterioro del estado nutricional. El objetivo del estudio fue describir las características clínicas y nutricionales de los niños españoles con PC.
MétodosEstudio observacional multicéntrico realizado en niños de 4 a 14 años diagnosticados de PC. Se recopilaron datos sociodemográficos y clínicos, así como medidas antropométricas, modalidad escolar, nutrición recibida en la escuela, apoyo nutricional y comorbilidades gastrointestinales de todos los pacientes.
ResultadosSe incluyó un total de 112 pacientes con una edad media de 9,2 años. Un 70,5% presentaba un grado IV-V en el Sistema de Clasificación de la Función Motora Gruesa (GMFCS). En comparación con aquellos con GMFCS I-II-III, los niños con grados IV-V del GMFCS mostraron una puntuación z media significativamente menor en peso, talla, relación peso/talla, índice de masa corporal y circunferencia del brazo, y un área del brazo significativamente menor. Una proporción mayor de pacientes con GMFCS IV-V asistió a escuelas de educación especial en comparación con pacientes con GMFCS I-II-III (68,4% vs. 12,1%, p < 0,0001). Una mayor proporción de niños con GMFCS IV-V presentó disfagia (62,0% vs. 15,2%, p < 0,0001), estreñimiento (51.9% vs. 27.3%, p = 0,0218) y reflujo gastroesofágico (31,6% vs. 3,0%, p = 0,0005) en comparación con niños con GMFCS I-II-III.
ConclusionesNuestro estudio muestra que los niños españoles con PC, especialmente aquellos con mayor deterioro motor severo, están en riesgo de desnutrición, presentan comorbilidades gastrointestinales y requieren apoyo nutricional.

The term cerebral palsy (CP) describes a heterogeneous group of disorders of movement and posture characterized by abnormal muscle tone, posture and movement that limit the activity of the affected individual and attributed to nonprogressive disturbances that occurred in the developing fetal or infant brain.1,2 The motor disorders of CP are often accompanied by disorders of sensation, perception, cognition, communication and behavior, epilepsy and secondary musculoskeletal problems.1 While the motor disorder is persistent, the clinical manifestations can change over the course of disease.2,3 The global prevalence of CP in high-income countries is of approximately 2 per 1000 live births, and it is estimated to be higher in low- and middle-income countries.3
The diagnosis of CP is essentially clinical and based on neurological examination and motor evaluation findings, the presence of any of the main risk factors associated with CP and neuroimaging and head magnetic resonance imaging features.4,5 The severity of CP can be graded using the Gross Motor Function Classification System (GMFCS), which establishes the level of motor function or impairment.6 In children with CP, especially those classified at higher GMFCS levels, motor function impairment is associated with a high risk of swallowing difficulties7 that affect food intake8,9 and contribute to poor nutritional status. Motor disability can promote the development of dysphagia,10 which is estimated to affect almost all children with severe CP,11 can affect swallowing safety and efficacy and can result in poor nutritional status and respiratory tract infection due to recurrent bronchial aspiration.11,12 Consequently, the prevalence of undernutrition among children with CP is high overall (approximately 40%) and even greater in those with more severe motor impairment.7,9 As a result, children with CP might have decreased bone density and muscle mass, leading to decreased functional status.7 Children with swallowing difficulties or dysphagia might require nutritional support to overcome undernutrition.13 In this regard, previous studies have shown that nutritional support can achieve weight gain and improved nutritional status in these patients.14,15
Although nutritional assessment and intervention in these patients can be challenging, it should be part of their care. In this context, the guidelines of the European Society for Paediatric Gastroenterology, Hepatology and Nutrition (ESPGHAN) recommend routine assessment of anthropometry, body composition and laboratory parameters to screen for signs of undernutrition.16
Despite these recommendations, there is a dearth of published data on the nutritional status of children with CP in Spain, and most of the available evidence focuses on specific regions in the country.17,18 Thus, the main goal of our study was to achieve a broader perspective across different regions of the current situation of children with CP in Spain through the collection and analysis of data on their clinical and nutritional characteristics. In addition, we aimed to identify and analyse the comorbidities present in these patients and the nutritional support they had received.
MethodsStudy designWe conducted a multicenter observational study including pediatric patients with CP managed in 10 Spanish hospitals. Eligible candidates were invited to participate when they visited the facility. In this same visit, researchers informed the parents about the study and, after obtaining informed consent, examined the patients in the same visit or scheduled a study visit for a later date. All the data required for the analyses were collected in a single visit.
This study (study number: 0114-N-19) adhered to the principles of the Declaration of Helsinki and was approved by the Malaga Provincial Research Ethics Committee of the Hospital Regional Universitario de Málaga.
ParticipantsChildren aged 4–14 years with a diagnosis of CP, regardless of GMFCS level classification, who provided written consent to participation (through their legal guardian) were included in the study. We obtained written informed from patients aged 13–14 years with normal cognition. We excluded Patients without an established diagnosis of CP.
We categorized patients according to the GMFCS,6 which ranges from level I (least affected) to level V (most severely affected).
Study variablesFor each patient, we collected data on sociodemographic characteristics (age, sex), clinical characteristics (gestational age, multiple gestation, age at diagnosis, evolution time since diagnosis) and anthropometric measurements (birth weight, current weight, height, estimated height by tibia length, weight-to-height ratio, body mass index [BMI], upper arm circumference, triceps skinfold thickness). Anthropometric measurements were obtained through standardized techniques such as the use of measuring tape for perimeter and segmental height measures, skinfold calipers for subcutaneous folds and scales for body weight.
Malnutrition was evaluated by means of the Waterlow weight-for-height index and anthropometric values. The Waterlow classification was used to assess nutritional status in terms of wasting and the degree of stunting, considering the current weight of the patient in relation to the median weight of the reference population for the patient’s height,19 classifying patients into the following categories: obesity, normal weight and mild, moderate, and severe undernutrition. Malnutrition was also evaluated based on anthropometric measurement z scores, defining undernutrition as a z score of −2 or lower.
We also collected data on variables related to schooling modality (special education, integration school, mainstream school), the number of meals and the type of nutrition provided at school (homemade food, homemade food with modified texture, gastrostomy), feeding method (oral, gastrostomy, mixed), need for supplementation with enteral formula, oral nutritional supplements (ONS) or both, and gastrointestinal comorbidities (dysphagia, constipation, gastroesophageal reflux). We used the Eating and Drinking Ability Classification System (EDACS) to assess the eating and drinking ability of children with CP.20 Patients were classified into five levels (I to IV) according to the severity of their limitations in terms of safety and efficacy. The EDACS scale has been translated into Spanish and validated, and has been used previously in a Spanish cohort of children with CP.17
Sample size calculationBased on data published by Fernández-Jaén et al.,21 for a confidence level (1–α) of 95% and a precision of 10% and estimating the prevalence of undernutrition in patients with CP at 45%, we calculated that the minimum sample size required was of 103 patients.
Statistical analysisWe calculated measures of central tendency (mean, median) and dispersion (standard deviation [SD], interquartile range [IQR]) to summarize quantitative data. Categorical data were described in terms of absolute and relative frequencies. We have expressed anthropometric parameters as z scores using the growth data published by Sánchez González et al. as reference22. The arm area was calculated based on the upper arm circumference . We classified patients into two subgroups according to CP severity, as previously described: GMFCS I-III and GMFCS IV-V.23,24 The fit of the variables to a normal distribution was assessed using the Shapiro–Wilk and Kolmogorov–Smirnov tests. For continuous variables, we used the Student t test or analysis of variance to analyze differences between subgroups if the data were normally distributed data or otherwise the nonparametric Mann–Whitney U or Kruskal–Wallis test. For qualitative variables, we used the χ2 or Fisher exact test. We performed all the analyses on the available data without using any substitution technique for missing values. The statistical analysis was performed with the SAS software, version 9.4 (SAS Institute Inc, Cary, NC, USA). P values of less than 0.05 were considered statistically significant.
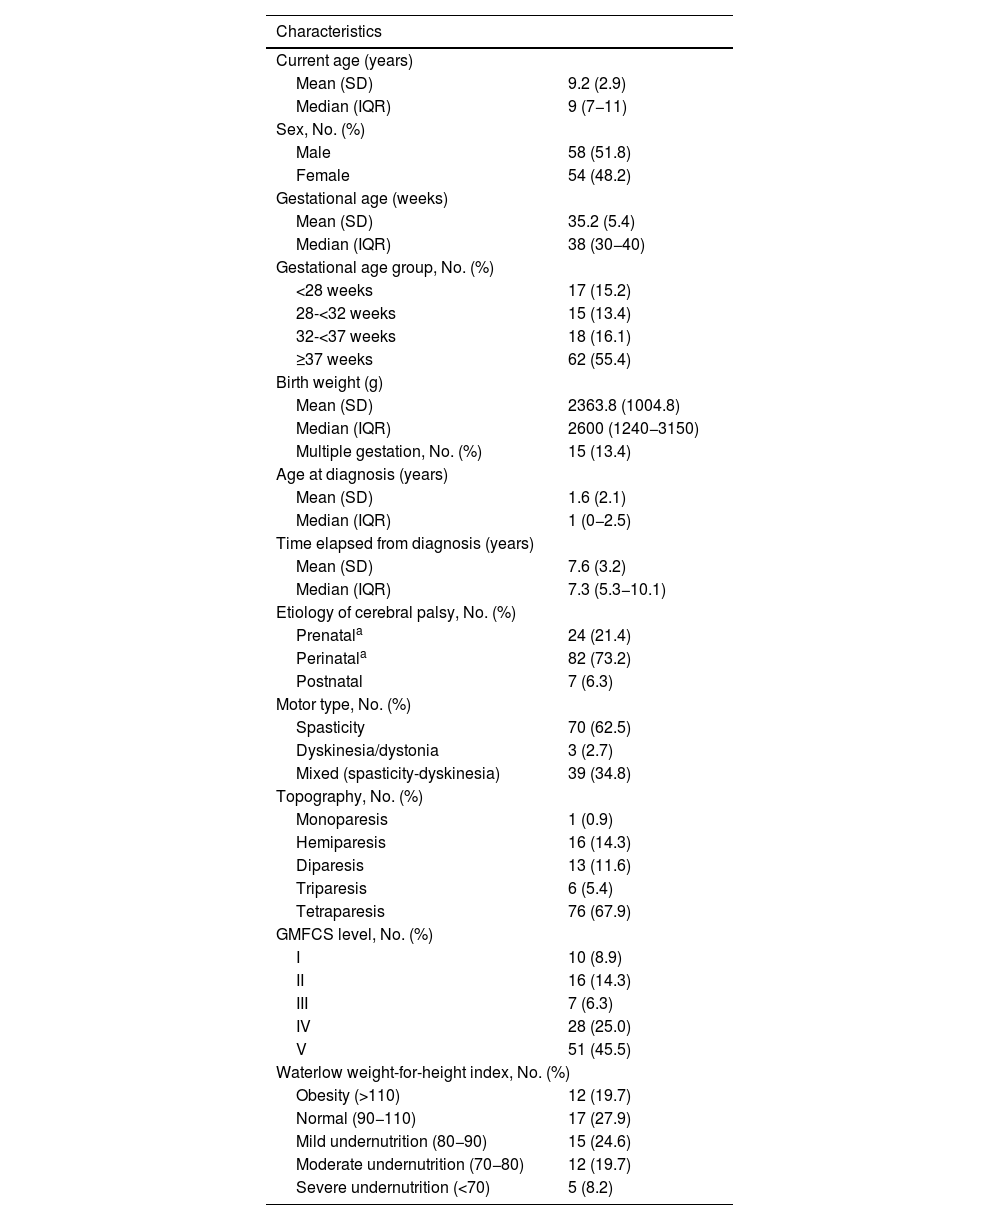
ResultsPatient characteristicsA total of 112 patients with a mean age of 9.2 years (SD, 2.9) managed in 10 Spanish hospitals participated in the study (Table 1). According to the GMFCS, 33 patients were classified as GMFCS I-III and 79 patients as GMFCS IV-V.
Patients and disease characteristics at the time of the study visit.
| Characteristics | |
|---|---|
| Current age (years) | |
| Mean (SD) | 9.2 (2.9) |
| Median (IQR) | 9 (7−11) |
| Sex, No. (%) | |
| Male | 58 (51.8) |
| Female | 54 (48.2) |
| Gestational age (weeks) | |
| Mean (SD) | 35.2 (5.4) |
| Median (IQR) | 38 (30−40) |
| Gestational age group, No. (%) | |
| <28 weeks | 17 (15.2) |
| 28-<32 weeks | 15 (13.4) |
| 32-<37 weeks | 18 (16.1) |
| ≥37 weeks | 62 (55.4) |
| Birth weight (g) | |
| Mean (SD) | 2363.8 (1004.8) |
| Median (IQR) | 2600 (1240−3150) |
| Multiple gestation, No. (%) | 15 (13.4) |
| Age at diagnosis (years) | |
| Mean (SD) | 1.6 (2.1) |
| Median (IQR) | 1 (0−2.5) |
| Time elapsed from diagnosis (years) | |
| Mean (SD) | 7.6 (3.2) |
| Median (IQR) | 7.3 (5.3−10.1) |
| Etiology of cerebral palsy, No. (%) | |
| Prenatala | 24 (21.4) |
| Perinatala | 82 (73.2) |
| Postnatal | 7 (6.3) |
| Motor type, No. (%) | |
| Spasticity | 70 (62.5) |
| Dyskinesia/dystonia | 3 (2.7) |
| Mixed (spasticity-dyskinesia) | 39 (34.8) |
| Topography, No. (%) | |
| Monoparesis | 1 (0.9) |
| Hemiparesis | 16 (14.3) |
| Diparesis | 13 (11.6) |
| Triparesis | 6 (5.4) |
| Tetraparesis | 76 (67.9) |
| GMFCS level, No. (%) | |
| I | 10 (8.9) |
| II | 16 (14.3) |
| III | 7 (6.3) |
| IV | 28 (25.0) |
| V | 51 (45.5) |
| Waterlow weight-for-height index, No. (%) | |
| Obesity (>110) | 12 (19.7) |
| Normal (90−110) | 17 (27.9) |
| Mild undernutrition (80−90) | 15 (24.6) |
| Moderate undernutrition (70−80) | 12 (19.7) |
| Severe undernutrition (<70) | 5 (8.2) |
Abbreviations: GMFCS, Gross Motor Function Classification System; IQR, interquartile range; SD, standard deviation.
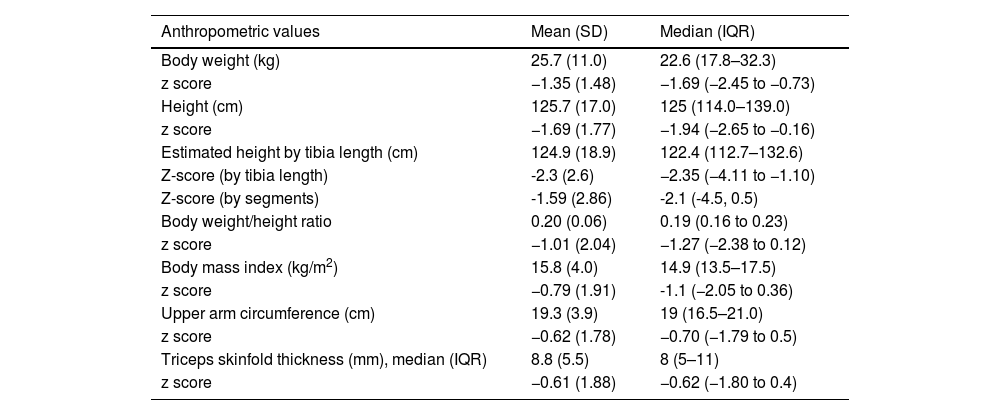
In the total sample, the mean body weight and height of the patients at the time of the study visit were 25.7 kg (SD, 11.0) and 125.7 cm (SD, 17.0), respectively (Table 2).
Patients’ anthropometric measurements at the study visit.
| Anthropometric values | Mean (SD) | Median (IQR) |
|---|---|---|
| Body weight (kg) | 25.7 (11.0) | 22.6 (17.8–32.3) |
| z score | −1.35 (1.48) | −1.69 (−2.45 to −0.73) |
| Height (cm) | 125.7 (17.0) | 125 (114.0–139.0) |
| z score | −1.69 (1.77) | −1.94 (−2.65 to −0.16) |
| Estimated height by tibia length (cm) | 124.9 (18.9) | 122.4 (112.7–132.6) |
| Z-score (by tibia length) | -2.3 (2.6) | −2.35 (−4.11 to −1.10) |
| Z-score (by segments) | -1.59 (2.86) | -2.1 (-4.5, 0.5) |
| Body weight/height ratio | 0.20 (0.06) | 0.19 (0.16 to 0.23) |
| z score | −1.01 (2.04) | −1.27 (−2.38 to 0.12) |
| Body mass index (kg/m2) | 15.8 (4.0) | 14.9 (13.5–17.5) |
| z score | −0.79 (1.91) | -1.1 (−2.05 to 0.36) |
| Upper arm circumference (cm) | 19.3 (3.9) | 19 (16.5–21.0) |
| z score | −0.62 (1.78) | −0.70 (−1.79 to 0.5) |
| Triceps skinfold thickness (mm), median (IQR) | 8.8 (5.5) | 8 (5–11) |
| z score | −0.61 (1.88) | −0.62 (−1.80 to 0.4) |
Abbreviations: IQR, interquartile range; SD, standard deviation.
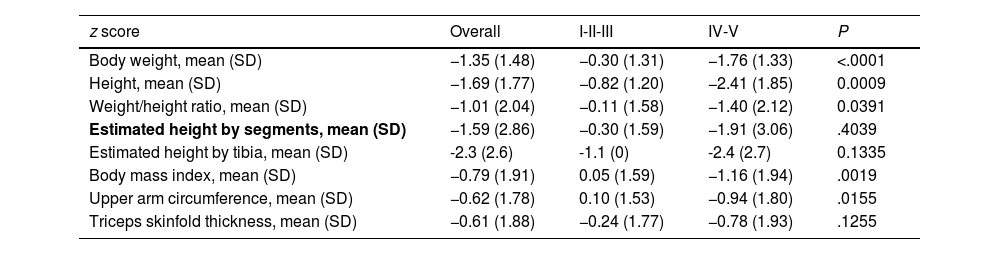
Fig. 1(a–g) presents the mean z score values for each of the anthropometric measurements and the mean GMFCS level. Overall, patients with GMFCS IV-V had significantly lower mean z scores in every anthropometric parameter (P < .05) except the height estimated based on the tibia length and the triceps skinfold thickness (Table 3).
 and the mean arm area (h) by GMFCS level. GMFCS, Gross Motor Function Classification System.")
Mean z score anthropometric measurements according to GMFCS group.
| z score | Overall | I-II-III | IV-V | P |
|---|---|---|---|---|
| Body weight, mean (SD) | −1.35 (1.48) | −0.30 (1.31) | −1.76 (1.33) | <.0001 |
| Height, mean (SD) | −1.69 (1.77) | −0.82 (1.20) | −2.41 (1.85) | 0.0009 |
| Weight/height ratio, mean (SD) | −1.01 (2.04) | −0.11 (1.58) | −1.40 (2.12) | 0.0391 |
| Estimated height by segments, mean (SD) | −1.59 (2.86) | −0.30 (1.59) | −1.91 (3.06) | .4039 |
| Estimated height by tibia, mean (SD) | -2.3 (2.6) | -1.1 (0) | -2.4 (2.7) | 0.1335 |
| Body mass index, mean (SD) | −0.79 (1.91) | 0.05 (1.59) | −1.16 (1.94) | .0019 |
| Upper arm circumference, mean (SD) | −0.62 (1.78) | 0.10 (1.53) | −0.94 (1.80) | .0155 |
| Triceps skinfold thickness, mean (SD) | −0.61 (1.88) | −0.24 (1.77) | −0.78 (1.93) | .1255 |
Abbreviation: SD, standard deviation.
In addition, the mean arm area in the total sample was 3072.44 mm2 (SD, 1328.21), and was significantly higher in patients with GMFCS I-III (mean, 3688.01; SD:1541.26) compared to patients with GMFCS IV-V (mean, 2805.15; SD: 1134.77) (P = .0007) (Fig. 1h).
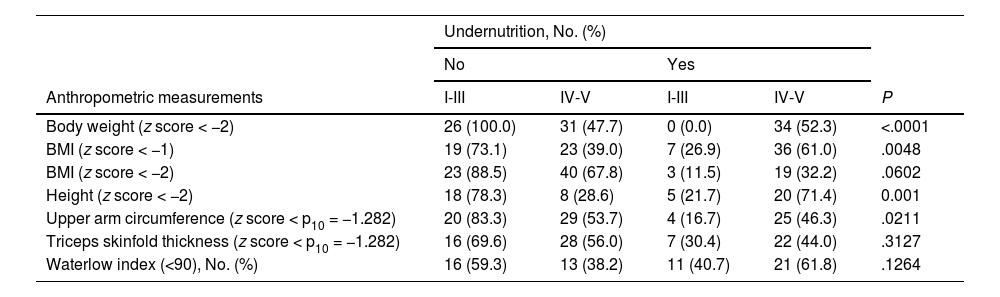
Nutritional statusThe analysis of nutritional status showed that, based on the anthropometric characteristics (Table 3), approximately 26-52 % of the patients had undernutrition. In addition, based on body weight, BMI (z-score < -1), height and upper arm circumference, there was a statistically significant higher proportion of undernourished patients in the GMFCS IV-V group compared to the GMFCS I-III group (Fig. 2, Table 4). When we considered undernutrition defined as a Waterlow index of less than 80, we found a higher proportion of patients with undernutrition in the GMFCS IV-V group (n = 13; 38.2%) compared to the GMFCS I-III group (n = 4; 14.8%) (P = .0502).

Undernutrition in study patients according to different anthropometric measurements and GMFCS level.
| Undernutrition, No. (%) | |||||
|---|---|---|---|---|---|
| No | Yes | ||||
| Anthropometric measurements | I-III | IV-V | I-III | IV-V | P |
| Body weight (z score < −2) | 26 (100.0) | 31 (47.7) | 0 (0.0) | 34 (52.3) | <.0001 |
| BMI (z score < −1) | 19 (73.1) | 23 (39.0) | 7 (26.9) | 36 (61.0) | .0048 |
| BMI (z score < −2) | 23 (88.5) | 40 (67.8) | 3 (11.5) | 19 (32.2) | .0602 |
| Height (z score < −2) | 18 (78.3) | 8 (28.6) | 5 (21.7) | 20 (71.4) | 0.001 |
| Upper arm circumference (z score < p10 = −1.282) | 20 (83.3) | 29 (53.7) | 4 (16.7) | 25 (46.3) | .0211 |
| Triceps skinfold thickness (z score < p10 = −1.282) | 16 (69.6) | 28 (56.0) | 7 (30.4) | 22 (44.0) | .3127 |
| Waterlow index (<90), No. (%) | 16 (59.3) | 13 (38.2) | 11 (40.7) | 21 (61.8) | .1264 |
Abbreviations: BMI, body mass index; GMFCS, Gross Motor Function Classification System; p10, 10th percentile.
Fifty-six (51.4%) patients attended special education schools, while 27 (24.8%) attended integration schools and 26 (23.9%) mainstream schools. A higher proportion of patients in the GMFCS IV-V group were enrolled in special education compared to patients in the GMFCS I-III group (68.4% vs. 12.1%; P < .0001) (Supplementary Fig. S1a).
At school, 80 patients (73.4%) had at least one meal, while 30 (27.6%) had at least two meals, most frequently lunch (n = 51, 46.8%) and mid-morning snacks (n = 50, 45.9%), followed by breakfast (n = 12; 11.0%).
Regarding the type of nutritional support, most patients received normal nutrition (n = 44; 64.7%), while 11 (16.2%) received adapted nutrition and 13 (19.1%) fed through a gastrostomy tube (Supplementary Fig. S1b).
Feeding modality and nutritional supportMost patients in the study (n = 87; 77.7%) fed orally, while 17 (15.2%) were fed via a gastrostomy tube and 8 (7.1%) received mixed feeding. Furthermore, 46 patients (41.1%) required nutritional support, and most of them (n = 42, 91.3%) were classified as GMFCS level IV-V (P < 0.001). In these patients, the most common route of administration of nutritional support was oral for patients with GMFCS level IV (81.8%) and enteral for those with GMFCS V (45.2%) (Table 5).
Nutritional support according to GMFCS level.
| I | II | III | IV | V | |
|---|---|---|---|---|---|
| No, No. (%) | 10 (100.0) | 14 (87.5) | 5 (71.4) | 17 (60.7) | 20 (39.2) |
| Yes, No. (%) | 0 (0.0) | 2 (12.5) | 2 (28.6) | 11 (39.3) | 31 (60.8) |
| Enteral | 0 (0.0) | 0 (0.0) | 0 (0.0) | 1 (9.1) | 14 (45.2) |
| Oral | 0 (0.0) | 0 (0.0) | 2 (100.0) | 9 (81.8) | 13 (41.9) |
| Mixed | 0 (0.0) | 2 (100.0) | 0 (0.0) | 1 (9.1) | 4 (12.9) |
Abbreviation: GMFCS, Gross Motor Function Classification System.
The analysis of comorbidities revealed that 54 patients (48.2%) had dysphagia, 50 (44.6%) constipation and 26 (23.2%) gastroesophageal reflux. In addition, 30 patients (26.8%) presented only one of these gastrointestinal comorbidities, while 26 (23.2%) had two and 16 (14.3%) had three concomitant gastrointestinal comorbidities.
The analysis according to GMFCS classification revealed that a significantly higher proportion of patients in the GMFCS IV-V subgroup compared to the GMFCS I-III subgroup had dysphagia (62.0% vs. 15.2%; P = .0001), constipation (51.9% vs. 27.3%; P = .0218) and gastroesophageal reflux (31.6% vs. 3.0%; P = .0005).
According to the EDACS score, half the patients (n = 51; 50%) ate and drank with safety and efficiency limitations (EDACS ≥ III). We classified patients further according to both the EDACS and the GMFCS subgroups, finding that a significantly higher proportion of patients with more severe motor impairment based on the GMFCS had eating and drinking difficulties (P < .0001) (Fig. 3).
Discussion
Children with CP have impaired motor function, which can lead to feeding difficulties that in turn may result in a poor nutritional status and, therefore, the need of nutritional support. With this in mind, we aimed to study the clinical and nutritional status of children with CP in Spain.
To the best of our knowledge, this is the first multicenter study carried out in Spain describing different nutritional aspects in children with CP. The results of our study show that approximately 70% of children with CP managed in Spanish pediatric neurology units who also received specialized gastroenterology and nutrition care exhibited severe motor impairment (GMFCS IV-V). Overall, these patients had significantly lower values for all anthropometric measurements compared to patients with GMFCS levels I-III, as previously described in the literature.24–27
Regarding their nutritional status, 28% of patients exhibited moderate or severe undernutrition based on the Waterlow index, while up to 52% had undernutrition based on other anthropometric measurements. The proportion of patients with undernutrition was significantly higher among those with GMFCS levels IV-V compared to those with GMFCS levels I-III. Previous studies in the field have yielded similar results. In a Spanish study in students with neurologic disabilities (58% children with CP), Costa el al found that approximately 64% had a GMFCS level IV-V and, overall, 56% had undernutrition according to the weight-for-age z score.18 Although these results are similar to our own, their study was carried out in a single school and not all children had a diagnosis of CP, so the data may not be directly comparable. Similarly, in another study conducted in a single center in Spain, Martínez de Zabarte Fernández et al. reported that approximately 28% of children with CP had moderate-to-severe undernutrition according to the Waterlow weight index, with a greater prevalence (74%) in those with GMFCS levels IV-V.28 Similar results have also been observed in other settings. For example, Ruiz Brunner et al. reported a prevalence of malnutrition of approximately 58% with moderate-to-severe undernutrition in 54% of patients, which was more frequent in children with GMFCS levels IV-V compared to children with GMFCS levels I-III.23 In contrast, other authors have reported a lower prevalence of undernutrition (22%–34%).29,30 In this context, it is worth noting that the ESPGHAN guidelines suggest that the identification of undernutrition in children should be based on anthropometric measurements.16 However, Bell et al. observed that the pediatric Subjective Global Nutrition Assessment (SGNA) identified more children as potentially malnourished compared to anthropometric measurements such as BMI, heigh, and weight.31 Although our results regarding undernutrition were similar to those reported by several other authors,18,23,31 we might have underestimated the prevalence of undernutrition in our study.
In the total sample under study, 41% of the patients needed nutritional support, most of who had severe motor function impairment (GMFCS IV-V). The majority of these patients required oral nutritional support, although 45% of those with GMFCS level V required enteral nutritional support. The need for nutritional support in these patients should be evaluated individually considering their global nutritional status and energy requirements and the presence of gastrointestinal comorbidities and nutritional red flags.32,33 Therefore, a multidisciplinary approach would be advisable.
In our cohort, almost half of the patients had gastrointestinal comorbidities, which based on the previous literature are frequent among children with CP.34 The most common gastrointestinal comorbidity in our study was dysphagia, present in 48% of patients, with a higher prevalence in the GMFCS IV-V group, as previously reported.29 Thus, half of all patients in our cohort exhibited eating and drinking limitations (EDACS ≥ III), of who 92% were classified as GMFCS IV-V. Similarly, in a recently published study, García Ron et al. assessed the nutritional status of 44 Spanish patients with CP and reported that 39% of patients had GMFCS levels IV-V and 43% were classified as EDACS ≥ II.17 Our results showed a higher proportion of patients in each of these groups (70% and 80%, respectively); however, it is worth noting that the study by García Ron et al. was carried out in a single center. Despite these differences, the data demonstrate that most Spanish children with CP have eating and drinking difficulties and some degree of undernutrition.
Overall, our results on the nutritional status of patients correlate with the fact that patients with a higher GMFCS level in our cohort were also classified in a higher EDACS level. In these patients, more severe motor impairment would result in eating and drinking dysfunction, leading to decreased nutrient intake and, consequently, to an undernourished status, explaining the increased need of nutritional support, which was enteral in a higher proportion of patients with GMFCS level V. Thus, clinicians should be aware of this situation and routinely assess children with CP for undernutrition red flags or comorbidities such as dysphagia. In addition, it could be useful to promote a multidisciplinary approach.
Our study has some limitations. We cannot rule out selection bias, as patients were not included in the study by random selection. Consequently, children with GMFCS levels IV-V may have been overrepresented in the sample. This could be due to the fact that they are more frequent patients at the specialist’s office. However, more than 100 patients from 10 different centers participated in the study. Therefore, we believe that our results are representative of the situation of children with CP receiving gastroenterology and nutrition care in Spain and of routine clinical practice, reflecting the nutritional status of children with CP and the care they receive. In addition, follow-up data were not available as all the data were collected in a single visit. Notwithstanding, this study contributes relevant information about the current prevalence of undernutrition in this population based on the degree of motor impairment, as well as other results of interest concerning symptoms and comorbidities that could be useful to generate new hypotheses. Further follow-up studies would be useful to assess the evolution of nutritional status in patients receiving nutritional support.
In conclusion, our study highlights the prevalence of undernutrition and gastrointestinal comorbidities in the pediatric population with cerebral palsy in Spain, even in cases of mild impairment based on the GMFCS. Until now, data has been scarce or focused on specific geographic areas, whereas this work provides a broader perspective across different regions in the country. The results suggest a need for closer monitoring of nutritional status and gastrointestinal comorbidities, including dysphagia, by the specialists involved in their care, such as neurologists and gastroenterologists. This underscores the importance of allocating more healthcare resources to address these issues associated with CP.
FundingThis work was supported by Danone Nutricia.
The authors would like to thank Outcomes’10 for support with medical writing, funded by Danone Nutricia.
Xenia Alonso Curco; Pediatric Neurology, Hospital Sant Joan de Deu, Barcelona, Spain
Gema Arriola; Pediatric Neurology, Hospital Universitario de Guadalajara, Guadalajara, Spain
Estibaliz Barredo Valderrama; Pediatric Neurology, Hospital General Universitario Gregorio Marañón, Madrid, Spain
Bárbara Blanco Martínez; Pediatric Neurology, Hospital Universitario Virgen del Rocío, Seville, Spain
Andrés Bodas Pinedo; Pediatric Gastroenterology, Hospital Clínico San Carlos, Madrid, Spain
Gonzalo Galicia Poblet; Pediatric Gastroenterology, Hospital Universitario de Guadalajara, Guadalajara, Spain
Ainhoa García Ribes; Pediatric Neurology, Hospital Universitario de Cruces, Bizkaia. Universidd de Alcalá, Madrid, Spain
Adrián García Ron; Pediatric Neurology, Hospital Clínico San Carlos, Madrid, Spain
Ignacio Málaga Dieguez; Pediatric Neurology, Hospital Universitario Central de Asturias, Oviedo, Spain
Alejandro Rodríguez Martínez; Pediatric Gastroenterology, Hospital Universitario Virgen del Rocío, Seville, Spain
Cesar Ruiz García; Pediatric Neurology, Hospital Regional Universitario de Málaga, Malaga, Spain
Mariela de los Santos; Pediatric Gastroenterology, Hospital Sant Joan de Deu, Barcelona, Spain
Mar Tolín Hernani; Pediatric Gastroenterology, Hospital General Universitario Gregorio Marañón, Madrid, Spain
Carlos Tutau Gomez; Pediatric Gastroenterology, Hospital Universitario de Cruces, Bizkaia, Spain
Ana María Vegas Álvarez; Pediatric Gastroenterology, Hospital Universitario Río Hortega, Valladolid, Spain
The following are Supplementary data to this article:

