


The aim of the present study is to describe the trend in volume and age-specific rates in visits to the paediatric emergency department of a university teaching hospital in Cantabria (Spain) from January 2001 to December 2013, and evaluate the influence of population growth on emergency department use.
Material and methodsA retrospective study was conducted to analyze all emergency department visits over a 13 year period. Simple and polynomial linear regressions were used to assess the relationship between population size and emergency department attendance rates across 2 age groups (0–2 and 3–14 years).
ResultsFrom 2001 to 2013, attendance in the emergency department increased by 14.1%, whereas the paediatric population rose by 26.3%. Rates of presentation per head of population were greatest among those aged <3 years: 1.48 (95% CI 1.40 to 1.56) vs. 0.46 (95% CI 0.44 to 0.48) for the older age group (P<.01). A significant regression equation was found (F[1,11]=11.2, P<.05) with an R2=0.50, showing that population growth produces a continuous rise in the emergency department visits for those aged <3 years. However, ED presentations of patients aged 3–14 years fit a quadratic regression model (R2=0.48, F[2,10]=4.6, P<.05) so increases in population rise ED presentations until an inflection point, after which increases in population will decrease ED visits.
ConclusionsThose aged 0–2 years presented a steady increase in ED visits related to population growth, whereas children aged 3–14 years experienced a “saturation of the demand” and a reduction in ED presentations.
Este estudio evalúa la influencia del crecimiento de la población en la utilización del Servicio de Urgencias Pediátricas de un hospital universitario de Cantabria (España) entre enero de 2001 y diciembre de 2013.
Material y métodosSe realizó un estudio retrospectivo de todas las urgencias ocurridas durante 13 años. Se emplean modelos de regresión lineal simple y polinómica para analizar la relación entre la población y la frecuentación en 2 grupos de edad (0-2 y 3-14 años).
ResultadosDe 2001 a 2013, las urgencias aumentaron un 14,1% y la población pediátrica un 26,3%. Las tasas de presentación por persona fueron mayores en los menores de 3 años, 1,48 (IC 95% 1,40 a 1,56) frente a 0,46 (IC 95% 0,44 a 0,48) (p<0,01). El modelo de regresión lineal simple muestra que el crecimiento de la población produce un aumento continuo de las urgencias en los menores de 3 años (R2=0,50, F[1,11]=11,2, p<0,05). En pacientes de 3 a 14 años la frecuentación se ajusta a un modelo de regresión cuadrática (R2=0,48, F[2,10]=4.6, p<05) y el incremento de la población aumenta las urgencias hasta alcanzar un punto de inflexión a partir del cual disminuyen.
ConclusionesEl grupo de edad de 0 a 2 años presentó un aumento constante en las urgencias relacionado con el crecimiento de la población, mientras que el grupo de 3 a 14 años experimentó una «saturación de la demanda» y una reducción de las visitas.
Paediatric emergency departments are at the front line of health care systems and play an essential role in guaranteeing a quick and high-quality response to patients seeking care. In general, the number of individuals seeking health services has been increasing continuously through time, independently of variations in birth rates and/or population drains1 in the catchment areas of health facilities. This appears to be an all but universal phenomenon regardless of the health care setting under consideration.2–4
The increase in the demand for services usually exceeds the growth of health care resources and can become a problem, with a negative impact in both the quality of the provided care as well as patient safety. Adequate planning is essential to meet the health care needs of a population,5 and estimating the health care needs of a specific geographical area requires taking into account the characteristics of the paediatric population, including the total size of the population and its distribution by age groups. Although it is fair to assume that demand results from the interplay of multiple factors, we believe that the demographic profile of the population receiving services is a significant contributor. Accurate knowledge of relevant demographic characteristics may be very useful in deciding whether to establish additional after-hours urgent care service points, predicting the impact of seasonal diseases and planning the allocation of human resources to emergency services.
Although numerous studies have assessed the volume of emergency department use and the most prevalent health problems in different geographical areas,6–9 they rarely analyse the demographic characteristics of an area taking into account changes in the paediatric population. Consequently, we do not know with certainty whether population characteristics are directly associated with paediatric emergency department utilisation, especially in the long term.
The aim of this study was to determine the frequency of hospital paediatric emergency department utilisation in the region of Cantabria over a period of 13 years, analyse changes in the characteristics of the paediatric population through this period, and assess whether there is an association between the two.
Materials and methodsWe conducted a retrospective ecological study using administrative records on the use of paediatric emergency services in the autonomous community of Cantabria between 2001 and 2013. We determined the annual number of visits to the emergency department based on information provided by the Intake and Clinical Documentation Department of the Hospital Universitario Marqués de Valdecilla. We collected and used these data in adherence to our hospital's regulations on epidemiology studies, aggregated data before the statistical analysis, and accessed none of the personal data contained in health records.
In order to guarantee that changes in the availability of paediatric health services did not influence emergency department utilisation, we selected a time period for analysis during which the structure and capacity of the paediatric emergency and paediatric primary care services network remained unchanged. In our study, we defined the paediatric population eligible for paediatric emergency care as the set of individuals aged 14 or fewer years, as this was the legal age limit in our region. We determined the size of the paediatric population based on data from the Instituto Cántabro de Estadística (Statistic Institute of Cantabria, www.icane.es), Population Section, population data and municipal census.
We performed a descriptive analysis, calculating the number of paediatric emergencies managed each year and the crude rate of emergency department use per 10000 inhabitants for the overall population and for the populations of children aged less than 3 years and children aged 3 or more years, assessing potential differences between them by means of the Student t test.
To assess the association between population size, age and emergency department utilisation, we used the Pearson correlation coefficient and simple linear or polynomial regression.10 We defined statistical significance for all tests as a P-value of less than 0.05, and we conducted the analysis with the software SPSS version 21 for Windows.
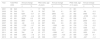
ResultsBetween 2001 and 2013 there were a total of 600001 paediatric emergency visits in Cantabria. Table 1 shows the main changes in emergency department utilisation and in the paediatric population. Table 2 shows the annual changes in the frequency of emergency department use and Table 3 the annual changes in the paediatric population. The mean emergency department utilisation rate was of 6968 visits per 10000 inhabitants (95% CI, 6585 to 7350) (Table 4). In the population aged less than 3 years, the mean rate was 14810 visits per 10000 inhabitants (95% CI, 13966 to 15664), and the mean rate in older children was 4692 visits per 10000 inhabitants (95% CI, 4448 to 4936) (P<.01). At the individual level, the mean number of visits was 1.48 visits per child (95% CI, 1.40 to 1.56) in children aged less than 3 years, and 0.46 (95% CI, 0.44 to 0.48) in older children, with a statistically significant difference between the two age groups (P<.01).
Changes in paediatric emergency department (PED) utilisation and the paediatric population in the 2001–2013 period.
| 2001 | 2013 | Difference | Mean annual growth | |||
|---|---|---|---|---|---|---|
| n | n | n | % | % | 95% CI | |
| Number of hospital-based PEDs | 1 | 1 | – | – | – | – |
| Total PED visits | 38843 | 44344 | 5501 | 14.1 | 0.9 | −3.1 to 4.9 |
| Paediatric population | 59510 | 75197 | 15687 | 26.3 | 1.9 | 1.1 to 2.7 |
| PED visits, age <3 years | 17782 | 20006 | 2224 | 12.5 | 0.7 | −3.6 to 5.0 |
| Paediatric population aged <3 years | 11459 | 15828 | 4369 | 38.1 | 2.8 | 0.2 to 5.3 |
| PED visits, age 3–14 years | 21061 | 24338 | 3277 | 15.5 | 1.3 | −4.5 to 7.2 |
| Paediatric population aged 3–14 years | 48051 | 59369 | 11318 | 23.5 | 1.9 | 0.9 to 2.9 |
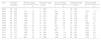
Annual changes in the number of paediatric emergency department (PED) visits in Cantabria (overall and by age group).
| Year | Total PED visits | Annual change | PED visits, age <3 years | Annual change | PED visits, age 3–14 years | Annual change | |||
|---|---|---|---|---|---|---|---|---|---|
| n | % | n | % | n | % | ||||
| 2001 | 38843 | – | – | 17782 | – | – | 21061 | – | – |
| 2002 | 39544 | 701 | 1.8 | 18547 | 765 | 4.1 | 20997 | −64 | −0.3 |
| 2003 | 45835 | 6291 | 13.7 | 21353 | 2806 | 13.1 | 24482 | 3485 | 16.5 |
| 2004 | 43063 | −2772 | −6.4 | 20777 | −576 | −2.8 | 22286 | −2196 | −10.4 |
| 2005 | 45891 | 2828 | 6.2 | 22633 | 1856 | 8.2 | 23258 | 972 | 4.6 |
| 2006 | 50442 | 4551 | 9.0 | 24245 | 1612 | 6.6 | 26197 | 2939 | 14.0 |
| 2007 | 50360 | −82 | −0.2 | 24897 | 652 | 2.6 | 25463 | −734 | −3.5 |
| 2008 | 48565 | −1795 | −3.7 | 23841 | −1056 | −4.4 | 24724 | −739 | −3.5 |
| 2009 | 49982 | 1417 | 2.8 | 23312 | −529 | −2.3 | 26670 | 1946 | 9.2 |
| 2010 | 48385 | −1597 | −3.3 | 24366 | 1054 | 4.3 | 24019 | −2651 | −12.6 |
| 2011 | 49149 | 764 | 1.6 | 23277 | −1089 | −4.7 | 25872 | 1853 | 8.8 |
| 2012 | 45598 | −3551 | −7.8 | 21013 | −2264 | −10.8 | 24585 | −1287 | −6.1 |
| 2013 | 44344 | −1254 | −2.8 | 20006 | −1007 | −5.0 | 24338 | −247 | −1.2 |
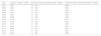
Annual changes in the paediatric population of Cantabria (overall and by age group).
| Year | Paediatric population | Annual change | Population aged <3 years | Annual change | Population aged 3–14 years | Annual change | |||
|---|---|---|---|---|---|---|---|---|---|
| n | % | n | % | n | % | ||||
| 2001 | 59510 | – | – | 11459 | – | – | 48051 | – | – |
| 2002 | 59465 | −45 | −0.1 | 11993 | 534 | 4.7 | 47472 | −579 | −1.2 |
| 2003 | 60669 | 1204 | 2.0 | 13076 | 1083 | 9.0 | 47593 | 121 | 0.3 |
| 2004 | 61755 | 1086 | 1.8 | 13563 | 487 | 3.7 | 48192 | 599 | 1.2 |
| 2005 | 62890 | 1135 | 1.8 | 14431 | 868 | 6.4 | 48459 | 267 | 0.6 |
| 2006 | 64255 | 1365 | 2.2 | 15072 | 641 | 4.4 | 49183 | 724 | 1.5 |
| 2007 | 65377 | 1122 | 1.7 | 15165 | 93 | 0.6 | 50212 | 1029 | 2.1 |
| 2008 | 67647 | 2270 | 3.5 | 15693 | 528 | 3.5 | 51954 | 1742 | 3.6 |
| 2009 | 70813 | 3166 | 4.7 | 16838 | 1145 | 7.3 | 53975 | 2021 | 4.2 |
| 2010 | 72519 | 1706 | 2.4 | 17122 | 284 | 1.7 | 55397 | 1422 | 3.0 |
| 2011 | 73571 | 1052 | 1.5 | 16920 | −202 | −1.2 | 56651 | 1254 | 2.6 |
| 2012 | 74717 | 1146 | 1.6 | 16468 | −452 | −2.7 | 58249 | 1598 | 3.3 |
| 2013 | 75197 | 480 | 0.6 | 15828 | −640 | −3.9 | 59369 | 1120 | 2.3 |
Evolution by year of the number of emergency department visits per 10000 inhabitants.
| Year | Number of visits—overall | Number of visits—population aged <3 years | Number of visits—population aged 3–14 years |
|---|---|---|---|
| 2001 | 6527 | 15518 | 4383 |
| 2002 | 6650 | 15465 | 4423 |
| 2003 | 7555 | 16330 | 5144 |
| 2004 | 6973 | 15319 | 4624 |
| 2005 | 7297 | 15684 | 4800 |
| 2006 | 7850 | 16086 | 5326 |
| 2007 | 7703 | 16417 | 5071 |
| 2008 | 7179 | 15192 | 4759 |
| 2009 | 7058 | 13845 | 4941 |
| 2010 | 6672 | 14231 | 4336 |
| 2011 | 6680 | 13757 | 4567 |
| 2012 | 6103 | 12760 | 4221 |
| 2013 | 5897 | 12640 | 4099 |
When we compared the growth in the overall population and emergency department utilisation using the Pearson correlation coefficient, we did not find a statistically significant correlation between the two variables (r=0.48; 95% CI, −0.1 to 0.8; P<.05), and we also found no significant correlation for the subpopulation of children aged 3 or more years (r=0.5; 95% CI, −0.1 to 0.8; P<.05). However, when it came to children aged less than 3 years, the number of visits to the emergency department was significantly and positively correlated to the size of the population (r=0.71; 95% CI, 0.26 to 0.91; P<.01).
Using these data, we performed a simple linear regression analysis to assess whether population size could predict emergency department use. The results of simple linear regression showed that in children aged less than 3 years, population size explained 50% of the variance (R2=0.50; F[1,11]=11.2, P<.05) (Fig. 1).

When it came to the population of children aged 3 or more years, the association with emergency department use did not fit a linear model, but a quadratic model in which starting at some point, emergency department use decreased with increasing age (R2=0.48; F[2,10]=4.6; P<.05) (Fig. 2).

For the overall paediatric population, the model that was the best fit for emergency department utilisation was also quadratic (R2=0.84; F[2,10]=27.2; P<.001) (Fig. 3).
Discussion
Our study shows that emergency department utilisation grew by 14.1% between 2001 and 2013. During this same period, the paediatric population grew by 26.3%. It is important to consider that during this period, the supply of hospital-based paediatric emergency services remained constant, as there was only one referral hospital with an emergency department in the entire autonomous community. There were also no changes in the structure of primary care paediatric services over this period, during which there was a constant number of after-hours urgent care clinics staffed by physicians specialised in family and community medicine. Both circumstances provided a unique opportunity to assess trends in health care demand when the health care supply remains constant and there are demographic changes, quantitative and qualitative, in the catchment population.
Unexpectedly, the increase in the paediatric population was not associated with a proportional overall increase in emergency department utilisation. It would be fair to expect that on analysing the association between population size and the number of emergency visits, a linear correlation would be found whereby population increases would be associated with demand increases. If we had happened to analyse only the period between 2001 and 2007, for instance, that is what our study would have found. However, by analysing a longer period of time, we found that when the total paediatric population eligible for paediatric emergency services exceeded 66000 individuals, emergency department utilisation started to decline, as can be seen in Fig. 3. Rather than through a linear model, this pattern can be better explained as a function of the population through polynomic regression with a quadratic model shaped like an inverted U. Due to the characteristics of our study, we were unable to determine the exact causes of this pattern, although it would be reasonable to assume that differences in morbidity between the years under study or seasonal epidemic diseases were probably not responsible for changes in emergency department utilisation over such a prolonged period. If we consider the accessibility of services in terms of time or cost, it does not seem to be a factor contributing to these changes in utilisation, as access to emergency care services in Spain is universal, and the services are available 24h 7 days a week. Thus, there must be other factors at play in this “saturation of demand” phenomenon.
The pattern of utilisation was different in children aged less than 3 years, with a clear linear correlation between population size and number of visits. This pattern has also been reported in previous studies on paediatric emergency department utilisation of similar characteristics.11,12 In addition, we also found another statistically significant difference in our study, as the utilisation rate in this age group was 1.48 visits per child (95% CI, 1.40 to 1.56), compared to 0.46 in older children (95% CI, 0.44 to 0.48). This difference is probably due to differences in actual morbidity, as infants and preschool-aged children are more susceptible to disease,12–15 and the most frequent reasons for seeking emergency care in this age group are fever and respiratory symptoms.7,12,13 We also need to take into account the reasons that lead parents to visit the emergency department, as the WHO defines an emergency as the sudden onset in any setting or situation of a problem of variable aetiology and severity perceived by the affected individual or the family as requiring immediate medical attention. Thus, the demand for urgent paediatric care is associated with the intrinsic severity of the symptoms presented by children but also with social and family-related factors, such as the anxiety generated in family members by symptoms manifested by a child, the compatibility of the work schedules of the parents or guardians with the opening hours of primary care services, or the perceived need for immediate attention.16 These are some of the factors that contribute to the more frequent use of emergency services by children aged less than 3 compared to older children or to individuals choosing to visit the emergency department as the first option for conditions that are usually not urgent,17 and they are probably involved in the pattern observed in our population.
In contrast, we found a decrease in demand in the population aged 3–14 years once the population grew to 56000 inhabitants. The most plausible explanation for the appearance of this “saturation of demand” is that from age 3 years onward, parents are less anxious about symptoms in their children and choose not to visit the emergency department or to wait longer before seeking care for minor health problems. Furthermore, the availability of after-hours urgent care clinics staffed by family physicians in areas that are far from the referral hospital may provide an appealing alternative to parents of older children that feel less anxious about their symptoms.
Some of the strengths of our study are that it is based on administrative data collected in the context of real-life practice over a period of 13 years, that it analysed every emergency department visit made in the period under study, and that there were no changes in the facilities that offered paediatric emergency care during that period. The considerable length of the period covered in our study allowed us to assess time trends in emergency department use in a health care ecosystem in which the only major change has been demographic. The probability that our findings result from selection bias or the presence of a seasonal factor is low. Some of the limitations of the study are its retrospective design and that we only had access to data routinely collected in our hospital, and were therefore unable to consider other variables when we fitted the statistical models that may have a relevant impact on emergency department use, such as the most frequent diagnoses or potential variations in wait times. Thus, we can only hypothesise about their potential contribution to parental demand for emergency care.
Last of all, we would like to mention that, to our knowledge, this is the first study that has detected a clear decrease in the demand for paediatric emergency services as the population increased over a prolonged period (13 years), as can be seen in Fig. 3. Based on our results, we conclude that population size does have an impact on paediatric emergency department utilisation, but that this impact varies depending on age. In children aged less than 3 years, the demand has grown continuously, with a direct correlation to population size. Conversely, in older children the increase in emergency department use is not sustained, as there is an inflection point once the population reaches a certain size after with utilisation plateaus or even decreases while the supply of services remains constant. While we do not believe that this phenomenon can be explained exclusively by demographic changes, our data allow us to state that increases in population size in isolation from other factors do not always entail a proportional increase in paediatric emergency department utilisation. This information should be taken into account in the planning and management of paediatric emergency care and the corresponding allocation of health care resources. Nevertheless, further studies with a prospective design should be conducted to better explain this complex situation.
Conflicts of interestThe authors have no conflicts of interest to declare.
Please cite this article as: Guerra Diez JL, Gaite Pindado L, Álvarez Álvarez C, Leonardo Cabello MT, Álvarez Granda L, Cabero Pérez MJ. Influencia de los cambios demográficos en la frecuentación de urgencias hospitalarias: 13 años de experiencia. An Pediatr (Barc). 2018;88:322–328.
