


Patient safety is a perspective from which to understand health care without which the latter would be meaningless.1
In paediatric emergency departments (PEDs), the risk of adverse effects is high due to the particular characteristics of their patients.2 The clinical information paediatricians obtain from parents and medication dosages are individualised, which involves calculations that provide opportunities for error.
Traditionally, patient safety refers to event investigation and analysis, which is difficult to translate to learning and prevention of repeated errors. In Spain, several studies have been developed with this approach (ENEAS, APEAS, EARCAS, SYREC and EVADUR). They contribute to the detection of errors once they have already happened, so other, proactive tools need to be implemented, such as risk maps, to promote awareness of probable or demonstrated risks and harm in care delivery.3 The aim of our study was to describe our experience with the design and development of a risk map for our own care setting.
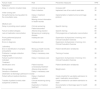
We developed the risk map using the Failure Modes and Effects Analysis (FMEA) approach.4 We started by defining the emergency care processes and subprocesses from arrival of the patient to the desk to discharge from the PED. We identified risks in a brainstorming process that involved a multidisciplinary team (paediatricians, nurses and security, laboratory, radiology, administrative and pharmacy staff) based on staff statements concerning 719 events (2012–2018) and the review of complaints and suggestions filed by families (635 in the period under study). We collected the data in a FMEA template, including the specific care process and subprocesses, the defined failure mode or risk, its causes, the type of effect and possible measures for control or improvement. We estimated the severity (S), probability of occurrence (O) and probability of detection (D) of the events (Table 1), rating each on a scale from 1 to 5. The ratings were established by consensus by all participating professionals. We stratified risk based on the risk priority number (RPN): RPN = S × O × D. The resulting numbers could range from 1 to 125, with higher values indicating greater priority. We developed the risk map prioritising the causes that corresponded to the highest RPNs for the purpose of developing improvement strategies (essential risk map).
Classification of severity (S), occurrence/frequency (O) and detection (D).
| Severity | Criterion: failure mode based on impact on patient (S) | Ranking |
|---|---|---|
| Minimum | Failure of small importance unlikely to cause any actual harm even if it reaches the patient | 1 |
| Minor | Failure that may reach the patient and would not cause harm, but would require monitoring or intervention to ensure patient is not harmed | 2 |
| Moderate | Failure that causes or contributes to temporary harm and requires or prolongs hospitalization or requires intervention | 3 |
| Critical | Failure that causes or contributes to permanent harm or threatens the life of the patient, requiring intervention to save patients’ life | 4 |
| Catastrophic | Failure that may cause permanent disability or death if it reaches the patient | 5 |
| Occurrence | Criterion: probability of occurrence of failure mode (F) | |
|---|---|---|
| Infrequent/unlikely | Isolated failures in the specific process. It is probable in the life of the process, but unlikely to occur in years at a time | 1 |
| Low | Failure that occurs infrequently in the process or similar processes (once a year) | 2 |
| Moderate | Probable failure. The failure has occurred with relative frequency in the past in the specific process or similar processes (several times a year) | 3 |
| High | Very probable failure. The failure is expected to occur frequently (every month) | 4 |
| Very high | Nearly inevitable failure. The failure occurs very frequently, daily or weekly | 5 |
| Detection | Criterion: likelihood of detection of failure mode (F) | |
|---|---|---|
| Almost certain | The failure is obvious. It is highly unlikely that it will not be detected by existing controls (95−100%) | 1 |
| High | The failure, while obvious and easily detectable, could escape an initial check, but would certainly be detected later on (75−94%) | 2 |
| Moderate | The failure is detectable and may not reach the patient. It may be detected in the late stages of the process (40−74%) | 3 |
| Low | The failure is intrinsically difficult to detect with the protocols currently in place (6−39%) | 4 |
| Unlikely | The failure cannot be detected. It is nearly certain to reach the patient (0−5%) | 5 |
In the initial round, we identified 7 urgent care processes (admission, triage, initial nursing care, medical care, diagnostic testing, treatment and discharge destination), 17 subprocesses, 60 potential failures or risks with 92 effects and 199 causes. The essential risk map ended up comprising 15 subprocesses with 19 effects with a RPN greater than 30 (Table 2).
Failure modes with a risk priority number (RPN) greater than 30 (essential risk map).
| Failure mode | Risk | Preventive measures | RPN |
|---|---|---|---|
| Admission | |||
| Delay in collection of patient data | Clinical worsening | Increase staff | 48 |
| Risk of infection | Implement use of bar code to read data | 36 | |
| Initial nursing care | |||
| Not performed by moving patient to the consultation area | Delay in treatment initiation | Implementation of patient arrival and triage protocol | 36 |
| Missing clinical information in health records | 48 | ||
| Medical care | |||
| Delay in providing care to patient | Clinical worsening | Specific training | 40 |
| Patient discomfort | 40 | ||
| Failure to detect allergies | Adverse drug reaction | Specific training | 80 |
| Lack of medication reconciliation | Worsening of underlying disease | Pilot programme of medication reconciliation | 48 |
| Poorly performed physical examination | Inadequate care | Supervision of physicians in training; mini-Clinical Evaluation Exercise | 48 |
| Errors in diagnosis | Inadequate care | Supervision of physicians in training; mini-Clinical Evaluation Exercise | 48 |
| Laboratory | |||
| Error in identification of samples and patients | Mixing up health records; inadequate care | Patient identification wristbands | 36 |
| Problems in sample collection | Delay in necessary care | Training of nurses | 36 |
| Imaging tests | |||
| Failure to perform test when indicated | Delay in necessary care | Supervision of physicians in training; mini-Clinical Evaluation Exercise | 36 |
| Treatment | |||
| Identification error | Patient receives unnecessary treatment | Patient identification wristbands | 36 |
| Wrong dosage | Adverse drug reaction | Weight alarm | 36 |
| Omission of treatment | Delay in necessary care | 75 | |
| Destination at discharge (admission to ward) | |||
| Patient without medical directions | Delay in treatment initiation | Create checklist for use before admission to ward / medication reconciliation | 60 |
| Transfer of patient to ward under suboptimal conditions | Clinical worsening during transfer | Create checklist for use before admission to ward | 48 |
| Duplication of medical treatment | Documentation of discharge report in health records | 48 | |
The proposed risk map reviews every care process in emergency care and allows their proactive analysis. To develop it, we used brainstorming and reactive analytics. We used brainstorming repeatedly in the FMEA4 as a proactive safety measure. Incident analysis is weaker for this purpose.5 An aspect worth highlighting was the incorporation of the information and feedback provided by families, given the importance of the experience of patients and families and their involvement in care processes.6
When we analysed the distribution of failures, causes and effects, we found the highest number of causes of error in medical care (which could be due to our centre being a university hospital that has physicians in training on staff), diagnostic tests (processes that are not performed in full within the PED and may involve several professionals and spaces) and treatment (calculation of doses for weight under stressful circumstances).
As for the abridged version of the risk map, we ought to highlight the failure to identify allergies, omissions of treatment and transfer of patients to the ward without adequate medical directions. Improvement measures have been implemented, such as staff training, improvements in electronic health records and use of a checklist before patient transfer. The implementation of measures to prevent these severe failures has resulted in the reduction of other errors of lesser impact.
Some of the limitations of the study are that it yielded a lengthy document, that its implementation would be costly, and that it may not be possible to extrapolate it to facilities of different characteristics.
To conclude, we ought to highlight that a risk map is a tool for proactive risk management. Its findings will help us assess our activity, identify problems and implement improvement measures.
Elisabet Rife Escudero, Gemma Bial Vellve, Isabel de Andrés Yagüe, Susana Ortiz Solsona, Mercedes Jabalera, Esther Álvarez Matesanz, Mercedes Gimeno Mayor, Eva Gargallo Burriel, Yolanda Fernández Santervas, David Muñoz Santanach, Cristina Parra Cotanda, Victoria Trenchs Sainz de la Maza, Jesús Velasco Rodríguez, Josep Munuera del Cerro, Omar Rodríguez Forner, Francisco José Cambra Lasaosa, María Mercedes Molina Carbonell, Carles Luaces Cubells and José Blanco González.
Please cite this article as: Arias Constantí V, Rife Escudero E, Trenchs Sainz de la Maza V, Blanco González JM, Luaces Cubells C. Diseño de un mapa de riesgos en un servicio de urgencias pediátrico. An Pediatr. 2022;96:267–270.
