

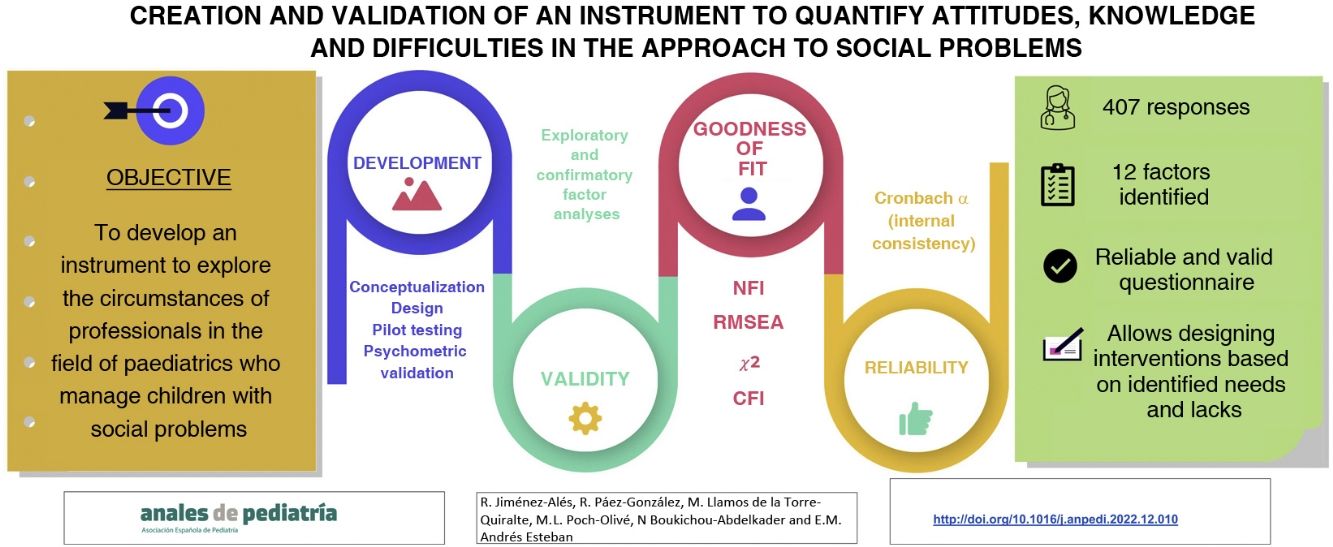
The aim of the study was to develop and validate a questionnaire to assess attitudes, knowledge and difficulties in the management of social problems by paediatric care providers.
MethodsThe development of the tool started with a conceptualization phase, followed by the design, pilot testing and psychometric evaluation of the questionnaire based on the responses obtained from 407 professionals. We performed exploratory factor analysis (EFA) and confirmatory factor analysis (CFA) to assess the construct validity of the questionnaire. We used the normed fit index (NFI), the root mean square error of approximation (RMSEA), the χ2 test and the comparative fit index (CFI) to test the goodness of fit. We assessed reliability through the Cronbach’s α coefficient of internal consistency. All quantitative analyses were performed with the Stata/SE software, version16.1.
ResultsThe EFA identified twelve factors. All factors exhibited a good internal consistency (Cronbach’s α, 0.8434). The CFA showed the model was a good fit (RMSEA=0.037). The NAI and CAI values were 0.742 and 0.797, respectively.
ConclusionsThis questionnaire comprising 138 items distributed in twelve factors is a reliable and valid instrument to analyse the attitudes, knowledge and difficulties in the approach to social problems in children by paediatricians, which will allow the design of interventions according to the needs and deficiencies identified through it.
Este estudio tiene como objetivo desarrollar y validar un cuestionario para evaluar actitudes, conocimientos y dificultades en el manejo de problemas sociales por parte de los profesionales de pediatría.
MétodosEl desarrollo de la herramienta comenzó con una fase de conceptualización, seguida del diseño, prueba piloto y evaluación de las propiedades psicométrica del cuestionario tras obtener respuestas de 407 profesionales. Se realizaron análisis factoriales exploratorios (AFE) y análisis factoriales confirmatorios (AFC) para explorar la validez de constructo del cuestionario. El índice de ajuste normado (IAN), el error cuadrático medio de aproximación (ECMA), la prueba de Chi-cuadrado y el índice de ajuste comparativo (IAC) se utilizaron para probar la bondad del ajuste. La confiabilidad se exploró a través del alfa de Cronbach para la consistencia interna.
ResultadosLa AFE identificó doce factores. Todos los factores mostraron buena consistencia interna (alfa de Cronbach 0.8434). El AFC mostró un buen ajuste al modelo (ECMA=0.037). Los valores de IAN y IAC fueron 0.742 y 0.797 respectivamente. Todos los análisis cuantitativos se llevaron a cabo con el software STATA/SE v.16.1.
ConclusionesEste cuestionario de 138 items distribuidos en doce factores es un instrumento fiable y válido para analizar actitudes, conocimientos y dificultades en el abordaje de problemas sociales en la infancia por parte de los pediatras, que permitirá diseñar intervenciones, de acuerdo con las necesidades y carencias identificadas a través del mismo.
Social determinants of health (SDHs) are the nonmedical factors that have an impact on health outcomes. They are the conditions in which people are born, grow, work, live, and age, and the wider set of forces and systems shaping the conditions of daily life. These forces and systems include economic policies and systems, development agendas, social norms, social policies and political systems.1 To name a few examples, the SDHs include child development, education, employment and working conditions, household income, food security, housing, health services, social support, residential areas, safety, inequalities between socioeconomic groups and racism, among others.
Social determinants of health contribute significantly to unfair and avoidable differences in health status and may be more important than health care or lifestyle in influencing health, and depend to a large extent on policy. In countries at all levels of income, the lower the socioeconomic position, the worse the health.1–3 Poverty may be associated with mortality rates up to 60% higher in infants. There is a cumulative increase in vulnerability with any increase in the number of social determinants or risk factors and their duration, resulting in increasingly worse health with a life-long impact.1,4 Children are particularly vulnerable, as they depend on their families for their basic needs, social support, education, socialization daily living skills.
Paediatricians must approach child health with a comprehensive, holistic and multidisciplinary perspective, considering the health of their patients within the context of their society, environment, school and family, integrating the physical, mental and social dimensions of health and child development; in short, they must work with all the factors at play in the wellbeing of the child (including public and community resources and protective factors), engaging in care delivery, prevention and the promotion of health and quality of life.5,6 Social paediatrics is based on the principle of the best interests of the child and active listening and acts on three main areas—child health problems with social causes, child health problems with social consequences, and child health care in society—encompassing four areas of paediatric health care—curative paediatrics, health promotion, disease prevention, and rehabilitation.6,7
While paediatricians are increasingly integrating a social perspective in clinical practice, we believe that the psychosocial factors that affect the health status of many paediatric patients have yet to be identified and that this may be related to the difficulties paediatricians have in addressing SDHs: a lack of basic resources, such as time with the patient, limited training and knowledge of community-based resources or the complexity of case management. For this reason, it is essential to work from the perspective of equity, and this requires knowing the current status quo in the management of social problems in different paediatric care delivery settings in Spain.
The main objective of the study was to develop a questionnaire to assess the attitudes and knowledge of paediatricians regarding different social problems and the barriers encountered in their management. The analysis of the data obtained through this questionnaire will allow the identification of the main strengths weaknesses, opportunities and threats to guide the development of strategies to improve the management of the social problems that affect children.
Material and methodsThe study consisted in the elaboration and validation of the questionnaire through several steps.8
Development phaseIt started with a conceptualization step, followed by the design and pilot testing of the questionnaire.
The conceptualization of the questionnaire and the definition of its dimensions (construct) were carried out by considering the purpose of the instrument, a review of the literature on the subject using the Cumulative Index to Nursing and Allied Health Literature (CINAHL), PubMed, PsychINFO and Scientific Electronic Library Online (SciELO) databases, a qualitative study in several focus groups and a content analysis to explore the social problems encountered most frequently and the difficulties experienced in addressing them, also considering the experience of the research team with the subject in question.
To design the initial questionnaire, a working group was instituted, comprising professionals from different regions and care settings and varying degrees of qualification for the management of social problems, that used brainstorming to develop an initial list of possible questions regarding the profile of the professionals completing the questionnaire (training, experience, workload and work environment) and different aspects related to access to training, knowledge, attitudes and skills in their application.
The initial list of items was reviewed by the research team, which proceeded to group questions that could be redundant or elicit contradictory responses, assess readability and attempt to apply a consistent answer format, avoiding potential categorical answers and offering the possibility to provide nuanced answers in items that may have a quantitative component by means of Likert scales,9 formulating all items as direct questions.10 Then, the items were entered in a form using Google Forms11 and all members of the research team tested the time it would take to complete it.
We distributed the questionnaire in June and July 2021 with the help of various scientific societies (Asociación Española de Pediatría, Asociación Española de Pediatría de Atención Primaria and Sociedad Española de Pediatría Social) and through a primary care paediatrics mailing list with a large number of subscribers in Spain (PEDIAP),12 seeking to obtain responses from health care professionals in primary care centres and hospitals in the public, private or mixed-ownership health care systems as well as physicians in training. We sent reminders during the response submission period. We did not collect any personal identifiable information from respondents, although the questionnaire asked for the postal code of the workplace to compare different settings in the analysis (rural vs urban)13 and as an indicator of the complexity of social problems addressed in their practice.14
The study was approved by the Clinical Research Ethics Committee of La Rioja (file CEImLAR P.I. 532).
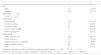
The estimated size of the target population was 12 000. We calculated that 373 responses were required for a 95% level of confidence. After distributing the questionnaire to the entire target population, we received 418 responses. We excluded 11 because the respondent did not belong to the required professional categories (paediatrician, family physician, residents or interns in paediatrics or in family medicine with specialization on child and adolescent medicine). Table 1 summarises the sociodemographic characteristics of the sample.
Sociodemographic characteristics of the sample.
| n | % | |
|---|---|---|
| Sex | ||
| Male | 72 | 17.69% |
| Female | 335 | 82.31% |
| Age (mean±SD) | ||
| 47.19±11.27 | ||
| Credentials | ||
| Paediatrician | 372 | 91.40% |
| Family physician | 10 | 2.46% |
| Paediatrics MIR | 22 | 5.40% |
| Family medicine MIR | 2 | 0.49% |
| General physician | 1 | 0.25% |
| Work setting | ||
| Public primary care | 265 | 65.11% |
| Public hospital | 73 | 17.94% |
| Both primary care and hospital | 43 | 10.56% |
| Medical resident-intern | 24 | 5.90% |
| NPO | 2 | 0.49% |
| If working in hospital, number of patients managed per week (mean±SD) | 61.78±37.01 | |
| If working in primary care, number of patients in caseload (mean±SD) | 1020.42±296.02 | |
MIR, medical intern-resident; NPO, non-profit organization.
Pilot study. To assess the acceptability and content validity of the questionnaire, the first draft was reviewed independently by 7 key experts, who edited some of the original items in the questionnaire. Then, a second draft was distributed to a small sample of convenience, followed by a descriptive analysis of the responses to explore frequency distributions and floor and ceiling effects (items for which 70% of answers were the extreme options) and the reliability of the questionnaire assessed by means of the Cronbach α coefficient. This yielded a final version of the questionnaire with 161 items: 16 on sociodemographic variables, 138 items on paediatric social problems and 7 items to allow the respondent to make observations about each of the dimensions of the initial questionnaire.
Psychometric validation phaseAfter the pilot study, we proceeded to assess the psychometric properties of the initial version of the questionnaire. All the quantitative analyses were performed with the software STATA/SE version 16.1.
Two recommendations were taken into account for the calculation of the sample size in this phase: 1) the sample should include 3–5 participants per questionnaire item and 2) only 400 participants would be needed in this validation phase to achieve a “very good” sample for factor analysis.15 Thus, we estimated that a sample of 400 participants would be adequate for this phase.
We used the Kolmogorov-Smirnov test to assess whether the data followed a normal distribution and performed a descriptive analysis to determine the acceptability and appropriateness of each item and identify floor and ceiling effects. We performed exploratory factor analysis (AFE) and confirmatory factor analysis (CFA) to assess the construct validity of the questionnaire.16,17
We assessed the adequacy of the factor analysis by means of the Kaiser-Meyer-Olkin (KMO) and the Bartlett sphericity test. A KMO of 0.60 or greater indicates that the sampling is adequate and a KMO greater than 0.80 indicates that it is meritorious.8,18
In the confirmatory factor analysis, we used structural equation modelling and maximum likelihood estimation. We used the normed fit index (NFI), the root mean square error of approximation (RMSEA), the χ2 test and the comparative fit index (CFI) to assess the goodness of fit, applying the customary reference values of each criterion for the purpose. Specifically, NFI and CFI values range from 0 to 1, with values of 0.95 or greater indicating a very good fit and values above 0.90 a good fit,8,19 although some authors considered values above 0.80 acceptable.8,20 As for the RMSEA, values less than 0.05 indicate a good fit, values up to 0.08 an acceptable fit and values of 0.10 or greater a poor fit of the data to the model.8,19,21 We assessed the reliability of the final version of the questionnaire using the Cronbach α as a measure of internal consistency.
ResultsDescription of the validation sampleWe received responses to the questionnaire (Appendix B) from 335 women (82.31%) and 72 men (17.69%), with a mean age of participants of 47.19 years (SD, 11.27) (Table 1). Most respondents were specialists in paediatrics and its subspecialities (91.40%) and worked in the public primary care system (65.11%), and 43 of the respondents (10.56%) worked simultaneously in primary care and hospital settings, public or private. The mean number of patients managed by respondents employed in hospital settings was 61.78 (37.01) and the mean caseload of respondents employed in primary care was of 1020.42 patients (SD, 296.02).
The Kolmogorov-Smirnov test showed that the data did not follow a normal distribution, and we found no evidence of floor or ceiling effects in any of the items.
Psychometric validation of the questionnaireThe sample size for factor analysis was of 138 items. The KMO statistic was 0.80. The Bartlett sphericity test also confirmed that the data were adequate for factor analysis (P<.001).
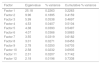
We selected 12 factors corresponding to the theoretical dimensions of the final questionnaire. This structure explained 73.38% of the variance in the model (Table 2).
Variance explained by each factor identified in the exploratory factor analysis.
| Factor | Eigenvalue | % variance | Cumulative % variance |
|---|---|---|---|
| Factor 1 | 25.18 | 0.2263 | 0.2263 |
| Factor 2 | 9.96 | 0.1895 | 0.4159 |
| Factor 3 | 5.99 | 0.0538 | 0.4697 |
| Factor 4 | 4.53 | 0.0407 | 0.5104 |
| Factor 5 | 4.38 | 0.0393 | 0.5497 |
| Factor 6 | 4.07 | 0.0366 | 0.5863 |
| Factor 7 | 3.55 | 0.0319 | 0.6182 |
| Factor 8 | 3.01 | 0.0271 | 0.6453 |
| Factor 9 | 2.78 | 0.0250 | 0.6703 |
| Factor 10 | 2.58 | 0.0232 | 0.6935 |
| Factor 11 | 2.31 | 0.0207 | 0.7142 |
| Factor 12 | 2.18 | 0.0196 | 0.7338 |
Factor 1 (explaining 22.63% of the variance in the model) corresponded to receiving specific training on the subject; factor 2 (explaining 18.95%) to the association between COVID-19 and social problems in children; factor 3 (explaining 5.38%) to the availability of training. Factor 4 (explaining 4.07% of the variance) corresponded to items assessing the respondent’s knowledge based on which to address social problems in children. Factor 5 (explaining 3.93%) to the information received by health care facilities in the near environment. Factor 6 (explaining 3.66%) corresponded to the documentation of the medical history in the health record. Factor 7 (explaining 3.19%) corresponded to the frequency of contact with additional services in the surrounding environment. Factor 8 (explaining 2.71%) corresponded to the frequency of management of children with social problems. Factor 9 (explaining 2.50%) corresponded to the information shared with other services in the surrounding environment. Factor 10 (explaining 2.32%) corresponded to the respondent’s own involvement in the management of the social problems of the minors. Factor 11 (explaining 2.07%) corresponded to the degree of involvement of other professionals. Factor 12 (explaining 1.96%) corresponded to the respondent’s knowledge of the law.
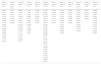
Table 3 presents the rotated component matrix corresponding to the item distribution in the 12-factor model.
Results of the exploratory factor analysis of the questionnaire. Component matrix with Varimax rotation.
| Factor 1 (items 17 to 32) | Factor 2 (items 132 to 138) | Factor 3 (items 1 to 16) | Factor 4 (items 66 to 77) | Factor 5 (items 40 to 46) | Factor 6 (items 95 to 120) | Factor 7 (items 33 to 39) | Factor 8 (items 54 to 65) | Factor 9 (items 47 to 53) | Factor 10 (items 121 to 131) | Factor 11 (items 78 to 82) | Factor 12 (items 83 to 94) |
|---|---|---|---|---|---|---|---|---|---|---|---|
| 0.7951 | 0.4372 | 0.6464 | 0.7303 | 0.5262 | 0.5755 | 0.3937 | 0.4914 | 0.3432 | 0.4842 | 0.6257 | 0.3040 |
| 0.8131 | 0.3847 | 0.7354 | 0.7347 | 0.7174 | 0.4997 | 0.7149 | 0.6798 | 0.7203 | 0.4203 | 0.5533 | 0.3346 |
| 0.8132 | 0.3521 | 0.7376 | 0.7265 | 0.5121 | 0.3248 | 0.4055 | 0.4431 | 0.6191 | 0.4055 | 0.6300 | 0.3857 |
| 0.7772 | 0.5191 | 0.6938 | 0.6824 | 0.5394 | 0.4706 | 0.4747 | 0.5736 | 0.5597 | 0.4034 | 0.6345 | 0.4926 |
| 0.8620 | 0.5297 | 0.7467 | 0.4911 | 0.3778 | 0.5731 | 0.3744 | 0.4869 | 0.5029 | 0.5907 | 0.5832 | 0.3146 |
| 0.8030 | 0.3372 | 0.6801 | 0.5452 | 0.5612 | 0.6578 | 0.3271 | 0.6283 | 0.5855 | 0.5642 | 0.3249 | |
| 0.7758 | 0.5855 | 0.4706 | 0.5977 | 0.3779 | 0.6587 | 0.3764 | 0.7124 | 0.3249 | 0.5621 | 0.5029 | |
| 0.8807 | 0.6459 | 0.4899 | 0.6088 | 0.5019 | 0.4456 | 0.3432 | |||||
| 0.6765 | 0.5500 | 0.7133 | 0.6047 | 0.3782 | 0.4878 | 0.3778 | |||||
| 0.5682 | 0.3878 | 0.6850 | 0.4529 | 0.5607 | 0.4079 | 0.3012 | |||||
| 0.8463 | 0.6764 | 0.6780 | 0.4892 | 0.3436 | 0.6642 | 0.3636 | |||||
| 0.6559 | 0.5111 | 0.5351 | 0.4222 | 0.5532 | 0.3937 | ||||||
| 0.5810 | 0.4450 | 0.5832 | |||||||||
| 0.8490 | 0.7313 | 0.6701 | |||||||||
| 0.7347 | 0.6664 | 0.6766 | |||||||||
| 0.8449 | 0.6719 | 0.4413 | |||||||||
| 0.8426 | |||||||||||
| 0.7741 | |||||||||||
| 0.8269 | |||||||||||
| 0.7992 | |||||||||||
| 0.8081 | |||||||||||
| 0.7964 | |||||||||||
| 0.7641 | |||||||||||
| 0.7000 | |||||||||||
| 0.6820 | |||||||||||
| 0.6677 |
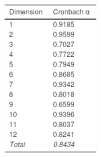
A CFA followed the EFA, showing that the model was a good fit and that a 7-factor structure could be adequate and result in a good fit, with a RMSEA of 0.04 and NFI and CFI values of 0.74 and 0.80, respectively. In fact, the identified factors allowed a logical theoretical interpretation and exhibited a good internal consistency (based on the Cronbach α values for the model and each dimension, Table 4), but since it did not improve the reliability, we chose to keep the 12 factors, which allow greater versatility in using the questionnaire to explore any of the specific dimensions for which it was conceived, preserving the initial structure.
The end result was a validated questionnaire that, in addition to the sociodemographic characteristics of the respondent, explores different aspects related to the training, knowledge, attitudes, resources and problems of professionals in addressing social problems in clinical practice.
Finally, the 12 factors identified in the validation process could be grouped in the following dimensions:
- •
Related to the personal resources of the provider (explaining 40.33% of the variance):
- o
Knowledge: 4, 12 (6.03%).
- o
Attitudes: 1, 6, 7, 9, 10 (34.30%).
- o
- •
Related to the external resources available to the provider (explaining 11.38%):
- o
Training: 3 (5.38%).
- o
Coordination: 5, 11 (6%).
- o
- •
Related to the social aspects managed by the provider: 2, 8 (explaining 21.66%).
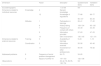
Table 5 lists the dimensions, factors, items and questions of the questionnaire that were and were not validated.
Correspondence between dimensions, factors, questionnaire items and validation items.
| Dimension | Factor | Descriptor | Questionnaire items | Validation items | |
|---|---|---|---|---|---|
| Sociodemographic | 1−8.108 | NV | |||
| Dimensions related to individual resources | Knowledge | 4 | General knowledge | ||
| 12 | Knowledge of regulations | 77−88 | 66−77 | ||
| 96−107 | 83−94 | ||||
| Attitudes | 1 | Participation in trainings | 26−41 | 17−32 | |
| 6 | History-taking | 109−134 | 95−120 | ||
| 7 | Frequency of contact with others | 43−49 | 33−39 | ||
| 9 | Information provided | 57−63 | 47−53 | ||
| 10 | Own involvement | 135−145 | 121−131 | ||
| Dimensions related to external resources | Training | 3 | Availability of trainings | 9−24 | 1−16 |
| Coordination | 5 | Information received | 50−56 | 40−46 | |
| 11 | Involvement of other professionals | 90−94 | 78−82 | ||
| Addressed problems | 8 | Frequency of social problem management | 64−75 | 54−65 | |
| 2 | Impact of COVID-19 | 147−153 | 132−138 | ||
| Observations | 25, 42, 76, 89, 95, 146, 154 | NV |
NV, items that were not validated.
We believe that this project achieved its primary objective of developing and validating a questionnaire to assess the attitudes, knowledge and barriers of paediatricians in the management of different social problems. The validation of the questionnaire will allow the development of improvement strategies on a solid foundation.
The assessment of the attitudes of professionals can be used to guide awareness interventions in the professional groups that require them: at the health district, health area, province, autonomous community or even national level.
The questionnaire also explores the resources available to professionals, which will allow the identification of organizational groupings, from the health district level to the larger health area level, including inpatient paediatric wards or emergency departments, in which more training or better coordination are required.
To date, the literature has only included questionnaires validated to assess skills. Therefore, this is the first instrument that measures all of these aspects in a single questionnaire, although others are available for specific social problems,22 such as child abuse,23 depression24 or low self-esteem.25 Most of the most widely used questionnaires are not specific for any given disease or condition,26 although this does not mean that they cannot be broken down to use specific factors separately to assess particular aspects in a given organizational group of professionals.
Lastly, the social aspects addressed by this questionnaire (although they appear indistinct due to how the questionnaire was structured) can be studied separately, compared to each other, or individually compared to the rest combined in order to identify lacks in professionals and resources and allow interventions to address identified needs. Thus, for instance, it would be possible to assess whether gender violence is an issue that professionals are more skilled, equipped or motivated or better trained or coordinated to manage compared to child sexual abuse.
Chief among the limitations that ought to be highlighted is that while the form was distributed widely, reaching nearly the entire population of interest, the participation of the professionals was voluntary, and this can carry important cognitive biases, especially the one known as heuristic availability, by which we tend to rely on immediate examples that come to mind in order to form a judgment.27,28
Another limitation is that the questionnaire explored the social problems reported most frequently in focus groups, but it did not explore exhaustively all the social problems covered by the DSM-5-TR.29
A third limitation is that the study did not assess the concurrent and divergent validity of the instrument, which would have required a gold standard for reference, the chief reason why these analyses are omitted in most validation studies.30,31 It also did not include other markers or indices widely used for the subject of interest, although we believe that the ones included in the study sufficed to achieve the established objective.8,30,31
One of the potential areas for future research would be the validation of the instrument in professionals in other fields who are also essential in the management of populations with social problems (other health care fields, the legal field, social work or welfare…). Another would entail increasing the application of this instrument in the real world in order to describe the status quo of social paediatrics at the national, regional or local levels, which would allow the identification of areas of improvement in the management of specific social problems, thereby contributing to the optimization of health care.
Ethical considerationsThe study was approved by the Clinical Research Ethics Committee of La Rioja (Ref. CEImLAR P.I. 532).
FundingThis research did not receive any external funding.
Conflicts of interestThe authors have no conflicts of interest to declare.
The following is Supplementary data to this article:

