


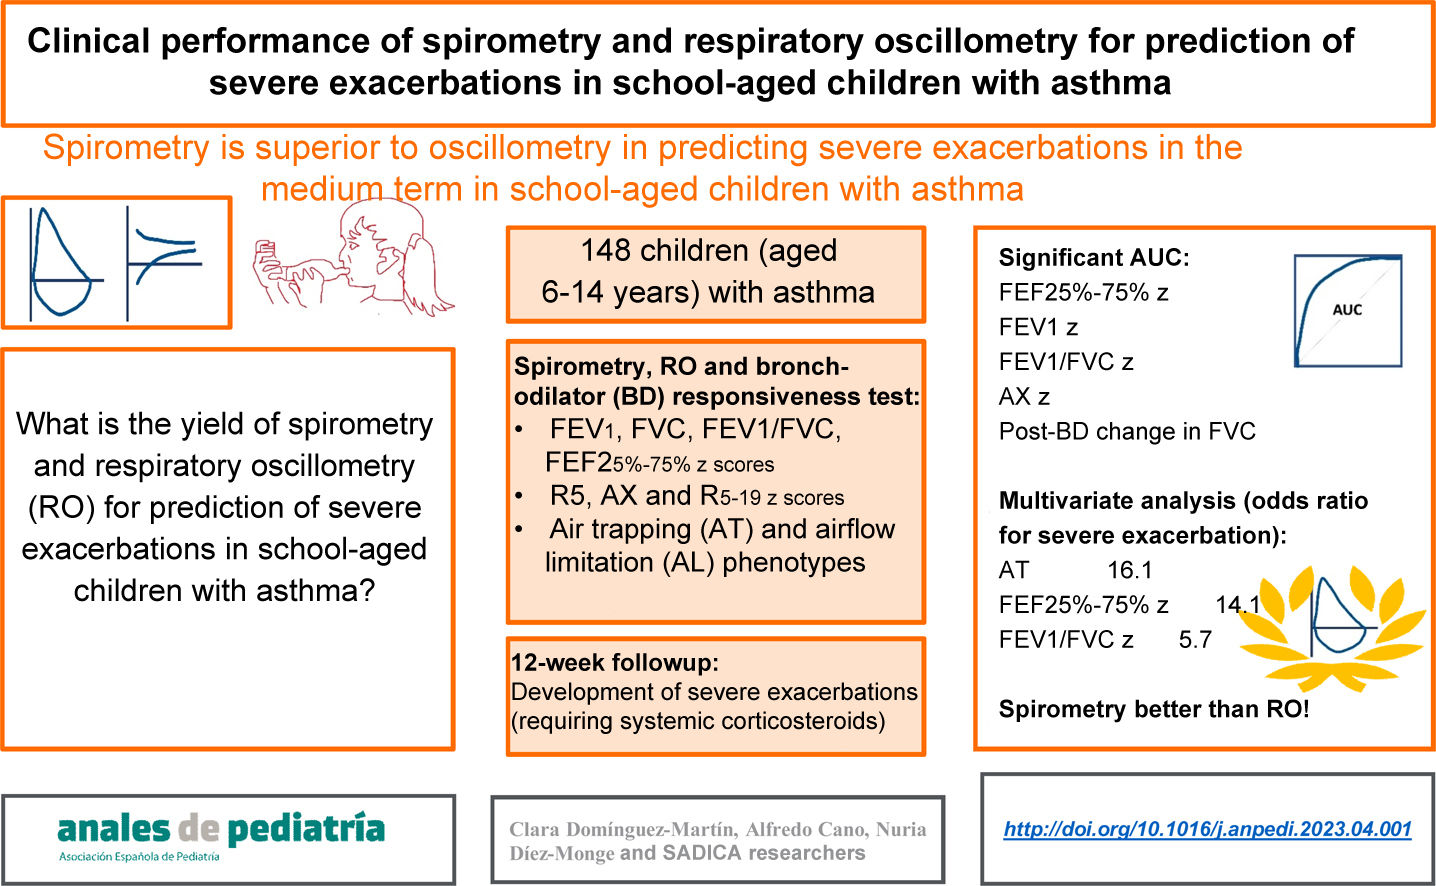
To determine the performance of spirometry and respiratory oscillometry (RO) in the prediction of severe asthma exacerbations (SAEs) in children.
MethodsIn a prospective study, 148 children (age 6–14 years) with asthma were assessed with RO, spirometry and a bronchodilator (BD) test. Based on the findings of spirometry and the BD test, they were classified into three phenotypes: air trapping (AT), airflow limitation (AFL) and normal. Twelve weeks later, they were re-evaluated in relation to the occurrence of SAEs. We analysed the performance of RO, spirometry and AT/AFL phenotypes for prediction of SAEs by means of positive and negative likelihood ratios, ROC curves with the corresponding areas under the curve (AUCs) and a multivariate analysis adjusted for potential confounders.
ResultsDuring the follow-up, 7.4% of patients had SAEs, and there were differences between phenotypes (normal, 2.4%; AFL, 17.9%; AT, 22.2%, P = .005). The best AUC corresponded to the forced expiratory flow between 25% and 75% of vital capacity (FEF25-75): 0.787; 95% confidence interval, 0.600−0.973. Other significant AUCs were those for the reactance area (AX), forced expiratory volume in the first second (FEV1), the post-BD change in forced vital capacity (FVC), and the FEV1/FVC ratio. All of the variables had a low sensitivity for prediction of SAEs. The AT phenotype had the best specificity (93.8%; 95% CI, 87.9–97.0), but the positive and negative likelihood ratios were both significant only for the FEF25-75. In the multivariate analysis, only some spirometry parameters were significative for prediction of SAEs (AT phenotype, FEF25-75 and FEV1/FVC).
ConclusionsSpirometry performed better than RO for prediction of SAEs in the medium term in schoolchildren with asthma.
Determinar el rendimiento de espirometría y oscilometría respiratoria (RO) para predecir crisis de asma graves (CAG) en niños.
MétodosEn un estudio prospectivo, 148 niños (6–14 años) con asma realizaron RO, espirometría y prueba broncodilatadora (BD). Se clasificaron en fenotipos de atrapamiento aéreo (ATA), limitación del flujo aéreo (LFA) y Normal según la espirometría y prueba BD. A las 12 semanas fueron revalorados respecto a aparición de CAG. Se analizó el rendimiento de los parámetros de RO, espirometría y fenotipos ATA/LFA para predecir la aparición de CAG con cocientes de probabilidad positivos y negativos (LR+/LR-), área bajo la curva (AUC) de curvas ROC y análisis multivariante ajustado por posibles factores de confusión.
ResultadosUn 7,4% tuvo CAG en el seguimiento, con diferencias según fenotipo (Normal 2,4%, LFA 17,9%, ATA 22,2%, p = 0,005). La mejor AUC fue del flujo espiratorio forzado 25–75% (FEF25–75): 0,787, intervalo de confianza 95% 0,600-0,973. También tuvieron AUC significativas el área de reactancia (AX), el volumen espiratorio forzado en el primer segundo (FEV1), el cambio post-BD en capacidad vital forzada (FVC), y FEV1/FVC. Todas las variables tenían una baja sensibilidad para predecir CAG. La mejor especificidad correspondía al fenotipo ATA: 93,8% (IC95% 87,9–97,0), pero solo FEF25-75 tenía tanto LR+ como LR− significativos. En el análisis multivariante, solo algunos parámetros de espirometría fueron significativos para predecir CAG (fenotipo ATA, FEF25-75 y FEV1/FVC).
ConclusionesLa espirometría tiene un rendimiento superior a la RO para predecir CAG a medio plazo en escolares con asma.
In children, asthma causes morbidity chiefly due to severe exacerbations, which according to the definition of the American Thoracic Society (ATS) and the European Respiratory Society (ERS) are those requiring systemic corticosteroids.1 The recent history of exacerbations is the main predictor of future ones,2 but many other risk factors and markers have been identified (clinical, social, environmental, psychological, biological), and there is no definitive standard for predicting exacerbations in the short or medium term.3 Several clinical rules and scores that include multiple variables have been developed that may be useful for predicting exacerbations in children.4–6
One of the variables that is commonly taken into account is lung function. The performance of lung function for estimating the risk of asthma exacerbations has been studied using conventional methods, such as spirometry.7 Since the use of respiratory oscillometry (RO), which requires little cooperation from the patient,8 has been increasing, this technique is also being investigated as a possible tool for predicting future exacerbations. Respiratory oscillometry is particularly sensitive for detection of changes in small airways,9 which may be significant in the clinical course, treatment and outcomes of asthma.10 In adults, robust prospective studies have found an association between small airway dysfunction and the risk of asthma exacerbations or poorly controlled asthma the following year.11 A recent meta-analysis concluded that certain RO parameters could predict the development of exacerbations in children.12 However, few prospective studies have been conducted in children, and due to small sample sizes and methodological limitations, they have been unable to yield firm conclusions.
On the other hand, some spirometry parameters can also be indicators of small airway involvement. The midexpiratory phase forced expiratory flow (FEF25-75) of the forced vital capacity (FVC) is a classic indicator of small airway obstruction.13 In addition, small airway obstruction leads to air trapping, a phenomenon that can be assessed indirectly by means of spirometry.14 Sorkness et al.15 described an air-trapping obstruction phenotype (AT) in children with asthma, defined by a reduction of the FVC on spirometry or a significant increase of the FVC after administration of a bronchodilator, differentiating it from another phenotype involving airflow limitation (AFL) but without air trapping (no detectable small airway dysfunction). The authors found that the AT phenotype was associated with a recent history of asthma exacerbation.15 However, other authors have found air trapping to be infrequent in children with asthma, to be present in many other respiratory diseases and to increase in frequency with age.16
Prospective studies are necessary to identify the lung function patterns associated with the risk of exacerbation in children, including research on small airways. The aim of our study was to compare the performance of RO and spirometry in the prediction of severe asthma exacerbations (SAEs) in school-aged children.
MethodsDesignWe conducted a prospective diagnostic accuracy study.
SamplePatients were recruited in primary care clinics and in the paediatric pulmonology unit of a tertiary care hospital. The inclusion criteria were: (a) age 6–14 years, (b) clinical diagnosis of asthma (typical episodic symptoms, reversible with asthma medication, with no symptoms, signs or history suggestive of a different diagnosis), (c) history of asthma symptoms or asthma treatment in the past 12 months. We included patients with asthma of any severity. We excluded children with relative contraindications for spirometry.17
ProtocolThe initial visit (V0) involved collection of data on demographic characteristics, recent history of exacerbations, visits and hospitalization due to asthma, asthma treatment step based on the definitions of the Global Initiative for Asthma,18 performance of lung function tests and assessment of asthma control. The second visit (V1), 12 weeks later, entailed documentation of the course of the disease between V0 and V1 (need of on-demand primary care or emergency department [OD/ED] visit, exacerbation requiring the use of systemic corticosteroids [SAE], hospital admission due to asthma) and any changes in the step of asthma treatment between V0 and V1, in addition to repeated assessment of asthma control. The clinical data were obtained through interviews with the primary caregivers of the patients and the review of health records. Patients underwent lung function studies in 7 consecutive months (October-April) in the course of dedicated visits unrelated to their clinical management, and the paediatricians in charge of the patients were not informed of the results until patients had attended V1.
MeasurementsParticipants received instructions to refrain from using any asthma medication in the 18 h preceding lung function testing, and the tests were always performed in the same order8: RO → spirometry → bronchodilator (BD) responsiveness test. High-efficiency viral and bacterial filters were used during testing, and the equipment was calibrated daily.
Respiratory oscillometry tests were performed with a Tremoflo C-100 system (Thorasys Thoracic Medical Systems, Montreal, Canada) in adherence to the standards established by the ERS.8 The criteria applied to consider a test valid were the acquisition of at least 3 acceptable replicates with a coefficient of variation of the resistance at 5 Hz (R5) of 15% or less. For the analysis, we used the mean values for R5, the difference between the resistance at 5 and 19 Hz (R5−19) and the area under the curve of the reactance (AX), expressed as z-scores calculated with the reference equations published by Ducharme et al.19 Higher resistance and reactance area values are indicative of greater impairment of lung function, and were considered abnormal when their respective z scores were greater than 1.645.20
Spirometry tests were performed with a Pneumotrac spirometer with Spirotrac-5 software (Vitalograph Ltd, Buckingham, United Kingdom) according to the recommendations of the ATS/ERS.17 We collected data on the following variables: FVC, forced expiratory in the first second of expiration (FEV1), the FEV1/FVC ratio and the FEF25-75. Tests were considered valid if 2 or more acceptable manoeuvres were achieved with a difference of 0.15 L or less between the largest FEV1 and FVC values.17 We expressed the results as z scores applying the reference equations of the Global Lung Initiative,21 and considered values abnormal when the z score was less than −1.645.20
The BD responsiveness test consisted in the administration of 4 doses of salbutamol with an inhaler (100 μg/puff), through an OptiChamber Diamond chamber (Philips Respironics, Eindhoven, Netherlands), followed by repetition of the spirometry test 20 min later. We expressed changes in FEV1 and FVC as the percent change relative to the individual’s predicted value, and considered an increase greater than 10% as a significant BD response, in adherence with the most recent recommendations of the ERS/ATS.20
We classified patients based on the lung function phenotypes proposed by Sorkness et al.15:
- 1)
AT: FVC z score < −1.645 or change in FVC with BD > 10%.
- 2)
AFL: FEV1/FVC z score < −1.645 and not meeting criteria for AT.
- 3)
Normal: not meeting criteria for neither AT nor AFL phenotypes.
Asthma control was evaluated by means of the CAN questionnaire (carer version),22 which assesses asthma control in the past 4 weeks through 7 items rated on a Likert scale ranging from 0 to 4 points. The total score in the questionnaire ranges from 0 to 36 points, and lower scores indicate better control of asthma. A CAN score of 8 or greater is indicative of poor asthma control. In order to collect data with the same instrument through the entire age range under study, we did not use the child versions of the CAN.
AnalysisThe primary endpoint of the study was the development of SAEs between V0 and V1. The secondary outcomes included the need for OD/ED visits between V0 and V1 and poor asthma control at the time of V1.
We summarised the data as mean and standard deviation (SD) or median and interquartile range (IQR) as applicable. We compared categorical variables by means of the χ2 test and quantitative variables by means of the Kruskal–Wallis test.
We assessed the predictive power of RO and spirometry parameters by means of receiver operating characteristic (ROC) curves, measuring the area under the curve (AUC) with the corresponding 95% confidence interval (CI). We calculated the sensitivity, specificity, positive likelihood ratio (LR+) and negative likelihood ratio (LR−) in relation to the primary endpoint (SAE) for RO and spirometry parameters with a lower bound of the 95% CI of the AUC greater than 0.5 and for the AFL and AT phenotypes.
To control for the effect of potential confounders on the predictive power of RO and spirometry parameters and the AL/AT phenotypes, we calculated adjusted odds ratios (aORs) for logistic regression models in which we included the following adjustment variables: age, sex, maintenance treatment at the time of V0, change in dose between V0 and V1 and poor asthma control in V0. We selected these adjustment variables to replicate the analysis conducted by Fielding et al.7
We considered results with an α of less than 0.05, an AUC whose 95% CI excluded 0.5 and LR+/LR− whose 95% CIs excluded 1 as statistically significant.
Sample size calculationWe calculated that we needed a sample of 139 patients to estimate sensitivity and specificity values of 90% with a precision of 5% and a 95% level of confidence. Since we expected that valid lung function tests would not be achieved for every participant and that some would be lost to follow-up, we increased the calculated sample size by 10%.
Ethical considerationsThe study was approved by the Clinical Research Ethics Committee of the coordinating hospital. The parents of the participants received information regarding the study in writing and signed an informed consent form.
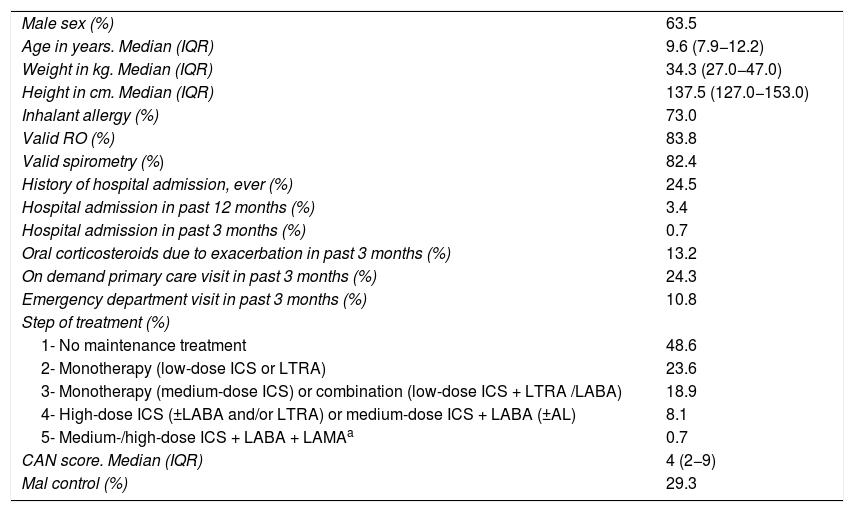
ResultsWe recruited 154 patients in V0, of who 148 (96.1%) underwent assessment in V1. Table 1 presents the demographic and clinical characteristics of the sample. Nearly half of the patients did not use daily maintenance therapy, and 29.3% had poorly controlled asthma at V0. Valid RO tests were achieved in 124 patients (83.8%) and valid spirometry tests in 122 (82.4%).
Clinical and demographic characteristics of the sample (N = 148).
| Male sex (%) | 63.5 |
| Age in years. Median (IQR) | 9.6 (7.9−12.2) |
| Weight in kg. Median (IQR) | 34.3 (27.0−47.0) |
| Height in cm. Median (IQR) | 137.5 (127.0−153.0) |
| Inhalant allergy (%) | 73.0 |
| Valid RO (%) | 83.8 |
| Valid spirometry (%) | 82.4 |
| History of hospital admission, ever (%) | 24.5 |
| Hospital admission in past 12 months (%) | 3.4 |
| Hospital admission in past 3 months (%) | 0.7 |
| Oral corticosteroids due to exacerbation in past 3 months (%) | 13.2 |
| On demand primary care visit in past 3 months (%) | 24.3 |
| Emergency department visit in past 3 months (%) | 10.8 |
| Step of treatment (%) | |
| 1- No maintenance treatment | 48.6 |
| 2- Monotherapy (low-dose ICS or LTRA) | 23.6 |
| 3- Monotherapy (medium-dose ICS) or combination (low-dose ICS + LTRA /LABA) | 18.9 |
| 4- High-dose ICS (±LABA and/or LTRA) or medium-dose ICS + LABA (±AL) | 8.1 |
| 5- Medium-/high-dose ICS + LABA + LAMAa | 0.7 |
| CAN score. Median (IQR) | 4 (2−9) |
| Mal control (%) | 29.3 |
CAN, asthma control in children questionnaire; ICS, inhaled corticosteroids; IQR, interquartile range; LABA, long-acting beta2-agonist; LAMA, long-acting muscarinic antagonist; LTRA, leukotriene receptor antagonist; RO, respiratory oscillometry.
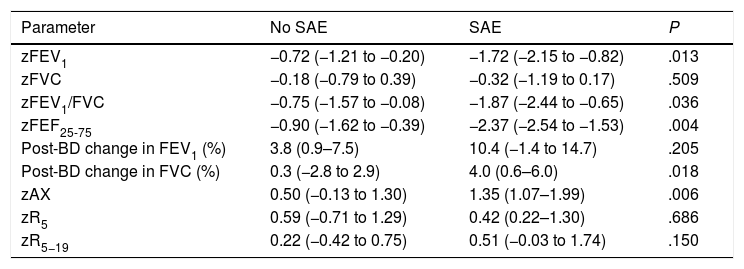
During the follow-up, 11 patients (7.4%) experienced SAEs, 18.2% made at least one OD/ED visit and 11.5% had their treatment stepped up. The probability of a SAE was not associated with maintenance treatment at the time of V0 (9.2% vs 5.6%; P = .397) nor with sex (7.4% in both male and female participants; P = .993), but it was associated with the stepping up of treatment between V0 and V1 (29.4% vs 4.6%; P < .001), poor asthma control at the time of V0 (14.0% vs 4.8%; P = .055) and age (mean age in patients with SAE, 8.2 years [SD, 1.6] years; in patients without SAEs, 10 years [SD, 2.5] years; P = .002). Table 2 presents the lung function parameters in relation to the development of SAEs, showing significant differences in the FEV1, FEV1/FVC, FEF25-75 and AX z-scores and in the change in FVC after administration of BDs.
Comparison of lung function parameters in patients who did and did not experience severe exacerbations.
| Parameter | No SAE | SAE | P |
|---|---|---|---|
| zFEV1 | −0.72 (−1.21 to −0.20) | −1.72 (−2.15 to −0.82) | .013 |
| zFVC | −0.18 (−0.79 to 0.39) | −0.32 (−1.19 to 0.17) | .509 |
| zFEV1/FVC | −0.75 (−1.57 to −0.08) | −1.87 (−2.44 to −0.65) | .036 |
| zFEF25-75 | −0.90 (−1.62 to −0.39) | −2.37 (−2.54 to −1.53) | .004 |
| Post-BD change in FEV1 (%) | 3.8 (0.9–7.5) | 10.4 (−1.4 to 14.7) | .205 |
| Post-BD change in FVC (%) | 0.3 (−2.8 to 2.9) | 4.0 (0.6–6.0) | .018 |
| zAX | 0.50 (−0.13 to 1.30) | 1.35 (1.07–1.99) | .006 |
| zR5 | 0.59 (−0.71 to 1.29) | 0.42 (0.22–1.30) | .686 |
| zR5−19 | 0.22 (−0.42 to 0.75) | 0.51 (−0.03 to 1.74) | .150 |
BD, bronchodilator; FEF25%–75%, midexpiratory phase forced expiratory flow; FEV1, forced expiratory volume in the first second; FVC, forced vital capacity; SAE, severe asthma exacerbation.
Values given as median (interquartile range). Mann-Whitney U test.
In 4.9% of patients, the FEF25-75 z-score was low but the FEV1/FVC and FVC z-scores were normal; all of these patients were classified as having a normal phenotype, none had experienced SAEs or exhibited poor asthma control at V1, and only one of them made OD/ED visits between V0 and V1.
We classified patients with valid spirometry tests by lung function phenotype as follows: normal, 85/122 (69.7%); AFL, 28/122 (22.9%) AT, 9/122 (7.4%). In the AT subset, only 1 patient had a reduced FEV1/FVC, and no patient was included in this phenotype based solely on the criterion of a change in FVC after administration of a BD with a normal baseline FVC. We found no differences between phenotypes in the prevalence of inhalant allergy, sex, current age, asthma control in V0, date of evaluation or receiving maintenance treatment at the time of V0, but there were differences in the age at onset of asthma, with a median of 1.0 years (IQR, 0.5–1) in the AT group, 2.0 years (IQR,1.0–3.0) in the AFL group and 3.0 years (IQR, 2.0–5.8) in the normal phenotype group (P = .007). The incidence of SAEs was different for each phenotype: 2.4% in the normal phenotype; 17.9% in the AFL phenotype and 22.2% in the AT phenotype (P = .005). Fig. 1 presents the results for the R5, R5−19, AX and FEF25-75 z-scores by phenotype. There were only differences between phenotypes in the FEF25-75 z-score, which was significantly low in 7.1% of patients with the normal phenotype compared to 33.3% with the AT phenotype and 85.7% with the AFL phenotype.
, AX (B), R5-19 (C) and FEF25-75 (D) in the different lung function phenotypes. AFL, airflow limitation; AT, air trapping. The red dotted lines mark the limit of normal (+1.645 for R5, AX and R5-20 z-scores and −1.645 for FEF25-75 z-score).")
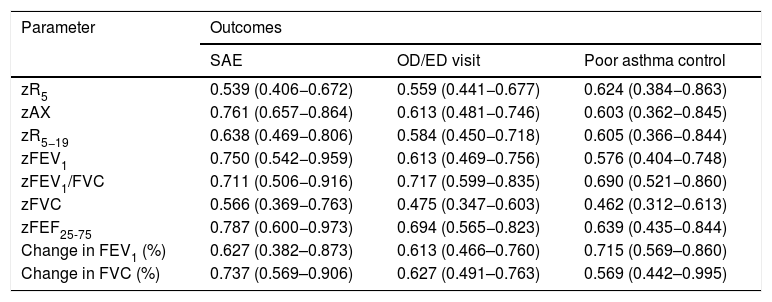
Fig. 2 presents the ROCs for the RO and spirometry parameters used for prediction of SAEs, and Table 3 presents the corresponding AUCs for the prediction of SAEs and other outcomes. None of the RO parameters performed well in the prediction of OD/ED visits or poor asthma control. When it came to the prediction of SAE, we found statistically significant AUCs in the ROC curves corresponding to the FEV1, FEV1/FVC, FEF25-75 and AX z-scores and the post-BD change in FVC, that is, the same parameters for which we found statistically significant differences in the relative frequency of SAEs (Table 2). These were the lung function parameters included in subsequent analyses.

Area under the curve and 95% confidence intervals for lung function parameters used to predict the outcomes.
| Parameter | Outcomes | ||
|---|---|---|---|
| SAE | OD/ED visit | Poor asthma control | |
| zR5 | 0.539 (0.406−0.672) | 0.559 (0.441−0.677) | 0.624 (0.384−0.863) |
| zAX | 0.761 (0.657−0.864) | 0.613 (0.481−0.746) | 0.603 (0.362−0.845) |
| zR5−19 | 0.638 (0.469−0.806) | 0.584 (0.450−0.718) | 0.605 (0.366−0.844) |
| zFEV1 | 0.750 (0.542−0.959) | 0.613 (0.469−0.756) | 0.576 (0.404−0.748) |
| zFEV1/FVC | 0.711 (0.506−0.916) | 0.717 (0.599−0.835) | 0.690 (0.521−0.860) |
| zFVC | 0.566 (0.369−0.763) | 0.475 (0.347−0.603) | 0.462 (0.312−0.613) |
| zFEF25-75 | 0.787 (0.600−0.973) | 0.694 (0.565−0.823) | 0.639 (0.435−0.844) |
| Change in FEV1 (%) | 0.627 (0.382–0.873) | 0.613 (0.466–0.760) | 0.715 (0.569–0.860) |
| Change in FVC (%) | 0.737 (0.569–0.906) | 0.627 (0.491–0.763) | 0.569 (0.442–0.995) |
FEF25-75, midexpiratory phase forced expiratory flow; FEV1, forced expiratory volume in the first second; FVC, forced vital capacity; OD/ED, on demand primary care/emergency department; SAE, severe asthma exacerbation.
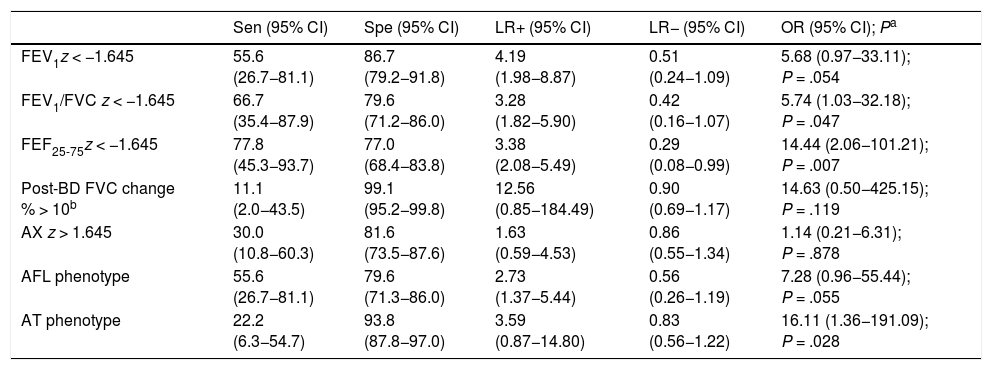
Table 4 shows the diagnostic yield of the different lung function parameters and the AFL/AT phenotypes for prediction of SAE and the corresponding aOR obtained in the regression models. The sensitivity was low for all variables, especially the two with the highest specificity (post-BD change in FVC and AT phenotype). Only the FEF25-75 z-score yielded significant values for both the LR+ and LR−. The aOR was significant for the FEV1/FVC and FEF25-75 z-scores and the AT phenotype, although the values were imprecise, with very broad CIs. The AX z-score exhibited a low sensitivity (30.0%) and moderate specificity (81.6%), and their LR+, LR− and aOR were not significant.
Yield of spirometry and RO parameters and lung function phenotypes in the prediction of severe asthma exacerbations.
| Sen (95% CI) | Spe (95% CI) | LR+ (95% CI) | LR− (95% CI) | OR (95% CI); Pa | |
|---|---|---|---|---|---|
| FEV1z < −1.645 | 55.6 (26.7−81.1) | 86.7 (79.2−91.8) | 4.19 (1.98−8.87) | 0.51 (0.24−1.09) | 5.68 (0.97−33.11); P = .054 |
| FEV1/FVC z < −1.645 | 66.7 (35.4−87.9) | 79.6 (71.2−86.0) | 3.28 (1.82−5.90) | 0.42 (0.16−1.07) | 5.74 (1.03−32.18); P = .047 |
| FEF25-75z < −1.645 | 77.8 (45.3−93.7) | 77.0 (68.4−83.8) | 3.38 (2.08−5.49) | 0.29 (0.08−0.99) | 14.44 (2.06−101.21); P = .007 |
| Post-BD FVC change % > 10b | 11.1 (2.0−43.5) | 99.1 (95.2−99.8) | 12.56 (0.85−184.49) | 0.90 (0.69−1.17) | 14.63 (0.50−425.15); P = .119 |
| AX z > 1.645 | 30.0 (10.8−60.3) | 81.6 (73.5−87.6) | 1.63 (0.59−4.53) | 0.86 (0.55−1.34) | 1.14 (0.21−6.31); P = .878 |
| AFL phenotype | 55.6 (26.7−81.1) | 79.6 (71.3−86.0) | 2.73 (1.37−5.44) | 0.56 (0.26−1.19) | 7.28 (0.96−55.44); P = .055 |
| AT phenotype | 22.2 (6.3−54.7) | 93.8 (87.8−97.0) | 3.59 (0.87−14.80) | 0.83 (0.56−1.22) | 16.11 (1.36−191.09); P = .028 |
AL, airflow limitation; AT, air trapping; CI, confidence interval; LR−, negative likelihood ratio; LR+, positive likelihood ratio; OR, odds ratio; Sen, sensitivity; Spe, specificity.
Of all the RO parameters, the only one that was associated with an increased risk of SAE in the medium term was the AX z-score, but it had a very low predictive value and was inferior compared to spirometry. The AT phenotype had a high specificity and its detection was associated with an increased risk of SAE in the medium term, but due to its low sensitivity, the possibility of SAE cannot be ruled out when this phenotype is not present.
InterpretationAccording to a recent meta-analysis,12 RO could be useful in identifying children at risk of asthma exacerbations. However, the evidence included in this review came primarily from cross-sectional studies,23–26 and to date, only 3 prospective studies have been published with data on the association of RO findings and the future risk of poor asthma control in children.27–29 These studies were conducted in small samples (54–72 patients) of school-aged children and adolescents27 or pre-school children28,29 and studied the association of RO findings with worsening asthma control 8–12 weeks after27,29 or the risk of moderate (but not severe) exacerbations in the following 12 months.28 They found an association between high R5, AX and R5−20 values and worsening asthma control27,29 and between high R5 values (unexpectedly, along with a decreased R5−20 values) and the risk of exacerbations in the 12 following months.28 Although one study included some RO results standardised according to previously published reference values,28 all used absolute R5, AX and R5−20 values. This is a significant source of confusion in the analysis of these studies, as both the RO parameters and the risk of poor outcomes were inversely associated with age. Our findings in relation to RO parameters would also have been more salient if we had used absolute values, especially for R5 and R5−19, but they would have certainly been biased. The only RO parameter associated with the risk of SAE was the AX z-score, but it had a low predictive value.
As regards spirometry, an individual patient data meta-analysis that included 7 trials in children and adolescents7 also found that the FEV1 in isolation could not predict the development of SAEs in the next 3 months, while the FEV1/FVC and the change in FEV1 had some predictive value. The review did not consider the FEF25-75 nor the response to BDs in the analysis. However, in our study the FEV1/FVC was only slightly superior to the FEV1 in predicting SAEs, and the FEF25-75 performed better than either of those two parameters.
The usefulness of FEF25-75 in clinical practice was questioned in an influential article30 that reported a very low probability (<3%) of finding abnormal FEF25-75 values in children and adults in spirometry tests with normal FEV1/FVC and FVC values, and that when it happened, it was usually due to poor technique (submaximal inhalation or FVC). Other studies in children31,32 have confirmed these findings. As the authors acknowledged,31 these studies are limited due to their retrospective design and not analysing correlations with the clinical manifestations. In our sample, 4.9% had a low FEF25-75 combined with normal FEV1/FVC and FVC values. When we reviewed the results of these patients, we did not find any indication of submaximal inhalation (all achieved manoeuvres of the maximum quality, with reproducibility of the FEV1 and FVC values within ≤ 0.10 L, better than required). However, none of these patients had severe exacerbations, and therefore they were all “false positives” and did not contribute to the predictive value of the FEF25-75.
On the other hand, we did not find the reduction in the FEF25-75 to be a phenomenon specific to the AT phenotype (small airway disease). A low FEF25-75 was much more frequent in patients with the AFL versus the AT phenotype. This was consistent with the findings of Sorkness et al.,15 whose study did not find an association between the FEF25-75 and the AT phenotype. Thus, if the predictive power of the FEF25-75 is greater compared to other parameters it is because it decreases both when there is air trapping and when there is only airflow limitation, and therefore is not specific for small airway dysfunction.
We used the definition of AT given by Sorkness et al.,15 but there were some differences in the AT phenotype in their study compared to ours: it was more frequent (14%), it was usually associated with a reduced FEV1/FVC (62%) and several cases were classified as AT only on account of the post-BD change in FVC when they had a baseline FVC in the normal range. However, there was excellent agreement between the studies in the age at onset of asthma in each phenotype, which was lower in the AT phenotype. Sorkness et al. found an association between AT and the frequency of exacerbations in the past 12 months. The yield of these phenotypes had not been studied in a prospective study before. We found that the AT phenotype seemed to be a specific marker of the risk of SAE. Although its low sensitivity limits its usefulness in clinical practice, the detection of the AT phenotype in a correctly performed spirometry test in a child with asthma is indicative of an increased risk of SAE in the medium term.
Limitations(1) Although the sample was larger compared to other prospective studies that have investigated the performance of RO,27–29 its size was not sufficient to make precise estimations for the parameters under study. Other factor that contributed to this was the low incidence of exacerbations that resulted from the low burden of asthma due to the COVID-19 pandemic.33 (2) The study was designed to assess the individual yield of RO and spirometry, and we did not study their usefulness in multivariate models for the prediction of exacerbations. (3) We did not include the response to BDs in the analysis of RO, as its association with the different lung function phenotypes in asthma patients has not been established, and there are still controversial aspects in relation to its application, such as which measure is best for the purpose of analysing post-BD changes (absolute value, % of baseline value, change in z-score), or the possibility of paradoxical responses due to its dependence on volume (with apparent worsening in children with the AT phenotype that improves with BD administration).8 (4) There is no evidence on the temporal trends of the AT/AFL phenotypes in individuals with asthma, and these phenotypes could change over time, so our findings can only be extrapolated to the 12-week interval that follows the identification of either of these phenotypes.
ConclusionRespiratory oscillometry is not appropriate for prediction of asthma control in school-aged children in the medium term. Small airway dysfunction does not seem to be a determinant of the course of disease in this age group. Spirometry is the lung function test that offers the best diagnostic yield for the prediction of SAEs in the medium term.
FundingRegional Health Administration of Castilla y León, Spain (GRS 2191/A/2020).
Conflicts of interestThe authors have no conflicts of interest to declare.
Ana María Alonso-Rubio: Universidad de Valladolid, Centro de Salud Covaresa, Valladolid, Spain.
Isabel Pérez-García: Universidad de Valladolid, Centro de Salud Covaresa, Valladolid, Spain.
María Teresa Arroyo-Romo: Centro de Salud Pisuerga, Valladolid, Spain.
Irene Casares-Alonso: Centro de Salud Huerta del Rey, Valladolid, Spain.
Ana María Barbero-Rodríguez: Universidad de Valladolid, Centro de Salud Covaresa, Valladolid, Spain.
Reyes Grande-Álvarez: Centro de Salud Zaratán, Valladolid, Spain.
María Teresa Martínez-Rivera: Centro de Salud Laguna de Duero, Valladolid, Spain
Mónica Sanz-Fernández: Centro de Salud Pisuerga, Valladolid, Spain.
