

Breastfeeding appears to protect the onset of obesity in infants. The aim is to know whether breastfeeding duration is associated with the risk of obesity in infants and toddlers aged 12 and 24 months.
Material and methodsProspective longitudinal study in a cohort of children born in Spain between April 2017 and March 2018 (LAyDI study) in the paediatric primary care system conducted in the framework of the PAPenRed research network. Analysis of breastfeeding duration (group 1: fewer than 6 months; group: more than 6 months) and its association with anthropometric variables.
ResultsA total of 1495 patients attended the 12 months preventive child health visit and 1073 patients the 24 months visit. We found a statistically significant association between breastfeeding duration and weight-for-age, BMI-for-age and weight-for-length/height at 12 and 24 months; breastfeeding duration of less than 6 months was significantly associated with overweight and obesity (based on BMI-for-age and weight-for-length/height) at ages 12 and 24 months. Maternal pre-pregnancy BMI acted as a modifier on the association between breastfeeding duration and overweight and obesity (based on BMI-for-age).
ConclusionsA breastfeeding duration of less than 6 months is associated with a higher percentage of overweight and obesity at ages 12 and 24 months, although maternal pre-pregnancy BMI modifies this relationship at 24 months.
La lactancia materna parece proteger la aparición de la obesidad en los lactantes. El objetivo es conocer si la duración de la lactancia materna se relaciona con el riesgo de obesidad en lactantes de 12 y 24 meses de edad.
Material y métodosEstudio longitudinal prospectivo de una cohorte de nacidos en España entre abril de 2017 y marzo de 2018 (estudio LAyDI) en pediatría de atención primaria, dentro de la red de investigación PAPenRed. Análisis de duración de lactancia materna (Grupo 1: menos de 6 meses, Grupo: más de 6 meses) y su relación con parámetros somatométricos.
ResultadosAcudieron a la visita de los 12 meses un total de 1495 pacientes, y a la de los 24 meses 1073 pacientes. Se observa una relación estadísticamente significativa entre la duración de la lactancia materna y el peso para la edad, el IMC para la edad y el peso para longitud/talla a los 12 y 24 meses, la duración de la lactancia materna menor de 6 meses se relaciona con el sobrepeso y obesidad (según los índices IMC para la edad y peso para la longitud/talla) de forma estadísticamente significativa a los 12 y 24 meses de edad. El IMC pregestacional materno es una variable modificadora de efecto sobre la relación entre la duración de la lactancia materna y el sobrepeso y obesidad (por IMC para la edad).
ConclusionesLa duración menor de 6 meses de la lactancia materna se asocia a un mayor porcentaje de sobrepeso y obesidad a los 12 y 24 meses, aunque el IMC materno pregestacional modifica esta relación a los 24 meses.

Early postnatal nutrition is one of the strongest determinants of growth during infancy. Therefore, the role of breastfeeding (BF) in short- and medium-term infant growth and its impact on subsequent development has been assessed in different studies that have yielded results that were not always consistent.1–4
It is known that BF offers benefits in the short, medium and long term as well as in low- to middle-income and high-income developed countries, decreasing overall morbidity and mortality and promoting healthy physical and mental development during childhood and possibly through adulthood.5–7
One of the most intriguing hypothesis in support of BF, especially in developed countries, is that this feeding modality in the early months of life may protect against obesity during childhood and metabolic syndrome in adulthood.8–11 Thus, BF could be associated with a lower weight gain in the early months of life compared to formula feeding, which would have significant positive consequences in the medium and long term.
This hypothesis is founded on the potential effect of BF in shaping the gut microbiota, the association between BF itself and a balanced diet later in childhood or the potential effect of breast milk on the regulation of appetite.1,8,12–15 However, other authors argue that the effect of BF in obesity prevention is fundamentally based on socioeconomic factors that may act as confounders in the association between infant feeding modality and obesity.16
The Mother Infant Study Cohort (MISC) led to the conclusion that in addition to feeding modality, other factors related to the mother (like the maternal body mass index [BMI] or weight gain during pregnancy) may play a key role in this association and have an important impact on the development of malnutrition due to excessive intake during infancy.17–19 However, in a very recent publication, Gayle Shipp et al.20 reported that BF acts as a protector against childhood obesity independently of maternal BMI.
The duration of BF seems to be another key factor in this association, so that prolonged BF, whether exclusive or mixed, is associated with decreased weight gain during infancy and childhood, with a stronger effect in the case of exclusive BF.4,11,21
However, the evidence is not that clear. For instance, the impact of BF promotion in pursuit of changes in growth rates and for prevention of obesity in the medium term does not seem consistent and the data on the subject are contradictory.2 Furthermore, some authors go as far as questioning whether there is a direct relationship between body composition in infants, whatever the feeding modality, and future health outcomes in the medium and long term.22
Given the general notion that BF may prevent the development of metabolic complications like obesity in the medium and long term, our primary objective was to analyse the association between the duration of BF and the nutritional status of infants and toddlers in the first 2 years of life as well as the association between the duration of BF and other maternal characteristics (BMI, weight gain during pregnancy).
Material and methodsProspective longitudinal study in a cohort of children born between April 2017 and March 2018 who attended primary care (PC) paediatric visits in clinics that are part of the Paediatric Primary Care Surveillance Network of Spain (PAPenRED), known as Lactancia y Desarrollo Infantil (Breastfeeding and Infant Development, LAyDI). The PAPenRED is a sentinel network of paediatricians devoted to epidemiological surveillance and research in which PC providers participate on a voluntary basis, while the LAyDI study was designed to understand the impact of socioeconomic, cultural and individual factors on BF initiation and maintenance.
The design and characteristic of the LAyDI study have been described in detail in a previous article,23 with two-stage stratified sampling throughout the Spanish territory. Each paediatrician selected 12 newborn infants to achieve a total sample size of 1500 infants (out of an estimated finite population of 426 303 newborns in Spain based on birth data for 2015, with an error margin of 2.5% and for a confidence level of 95%).
The inclusion criterion for the LAyDI study was visiting the PC paediatrician during the study period, and for the present study, it was having attended the first and second scheduled well-child visits. We excluded infants born preterm before 37 weeks of gestation, with low birth weight (<2400 g in boys and <2100 g in girls), product of a multiple gestation, with a stay in the maternity or neonatal ward longer than 5 days, with severe disease or malformation, whose mother had moderate to severe health problems during pregnancy or in the postpartum period or whose mothers had difficulty understanding oral or written Spanish.
The LAyDI study analysed variables concerning the pregnancy, childbirth, the neonatal period and social, economic and biological factors. The data were collected at the PC paediatrics clinic in the first routine visit (before 15 days post birth) and successive routine visits at 1, 2, 4, 6, 12, 18 and 24 months. The collaborating paediatricians and nurses collected the data. All anthropometric measurements were made with the certified and calibrated equipment of the respective PC centres.
Among the data collected in the LAyDI study, for this study we retrieved the anthropometric measurements obtained at 12 and 24 months (length in cm and weight in g) and used them to calculate different anthropometric indices, in addition to the infant feeding modality (exclusive breastfeeding [EBF], mixed feeding [MF] and/or formula feeding [FF]). Based on the feeding modality, we defined 2 groups:
- none-
Group 1: any feeding modality, as long as BF duration was less than 6 months (including FF, MF and EBF).
- none-
Group 2: BF lasting 6 months or longer (including EBF and MF).
Based on the anthropometric measurements, we classified male and female infants by nutritional status based on the World Health Organization (WHO) child growth standards for children under 5 years (WHO 2006).24 We calculated z scores for the following indicators: weight-for-age, weight for length, length-for-age and BMI-for-age. We grouped z scores based on the following thresholds: less than −3; from −2.99 to −2; from −1.99 to +1.99; from +2 to +2.99, and + 3 or greater.
We also classified infants based on their z scores applying the thresholds proposed by the WHO:
- none-
Wasting: weight for length/height z score < −2
- none-
Stunting: length/height z score < −2.
- none-
Underweight: weight-for-age z score less than −2 SD.
- none-
Overweight and obesity based on BMI: BMI z score > + 2.
- none-
Overweight and obesity based on weight for length/height: weight for length/height z score > +2.
Lastly, we assessed and quantified a “tendency toward excess weight” category encompassing z scores ranging from+1 to +1.99 for each of the anthropometric parameters.
We have expressed qualitative variables as percentages and quantitative variables as mean and standard deviation (SD). We used the Student t test to compare normally distributed continuous variables. For categorical variables, we used the χ2 test (χ2 for trend) and for the stratified analysis the Mantel–Haenszel χ2 test. All the analysis were performed with the statistics package SPSS version 21 (IBM SPSS Statistics) and considering p values of less than 0.05 statistically significant.
ResultsDescription of results in the overall cohortThe sample included 1946 infants. At 1 month of life, 84.9% were breastfed (EBF, 62.3% and MF, 22.6%), a proportion that had decreased to 71.7% at 4 months (EBF, 52.7% and MF, 19%) and to 61.7% at 6 months (EBF, 35.2% and MF, 26.5%). At 12 months, BF continued in 40.1% and at 24 months in 22.3%.
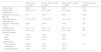
Table 1 presents the general characteristics of the sample, overall and comparing each of the two groups (groups 1 and 2). We found statistically significant differences in the pregestational maternal BMI (greater in group 1) and a significant association with the type of setting (urban/rural/mixed: higher proportion of group 2 in urban settings).
Description of maternal and infant characteristics in the overall cohort and in the 2 groups under study.
| Overall cohort (n = 1946) | Group 1 BF <6 months (n = 997) | Group 2 BF ≥6 months (n = 949) | P (<6 months vs. >6 months) | |
|---|---|---|---|---|
| Female infant | 49.9% | 50.8% | 49.3% | .52a |
| Maternal BMI, pregestational | 24.28 ± 4.78 | 24.7 ± 5.06 | 23.8 ± 4.43 | <.001b |
| Pregestational maternal BMI >25 | 31% | 35.5% | 26.2% | <.001a |
| Weight gain during pregnancy (kg) | 12.23 ± 5.04 | 12.35 ± 5.33 | 12.10 ± 4.72 | .26b |
| Pregnancy weight gain >15 kg | 28.6% | 29.4% | 27.7% | .38a |
| Gestational age | 39.3 ± 1.13 | 39.3 ± 1.13 | 39.4 ± 1.13 | .06b |
| Birth weight (kg) | 3.30 ± 0.39 | 3.30 ± 0.39 | 3.31 ± 0.39 | .54b |
| Residential setting | ||||
| Urban | 73.7% | 71.4% | 76.2% | .01a |
| Rural | 21.7% | 24.3% | 19% | |
| Mixed | 4.6% | 4.3% | 4.8% | |
| Type of delivery | ||||
| Uncomplicated | 68.5% | 67.3% | 70.4% | .31a |
| Instrumental | 12.8% | 13.7% | 12% | |
| Caesarean section | 18.3% | 19% | 17.7% |
BF, breastfeeding; BMI, body mass index.
Of the total initial sample, 1495 patients attended the routine visit at age 1 year and 1073 the visit at age 2 years. Of those who attended the visit at 1 year, 44.3% had been breastfed less than 6 months (group 1) and 55.7% 6 or more months (group 2). Of those who attended the visit at 2 years, 44.9% were in group 1 and 55.1% in group 2.
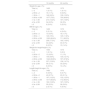
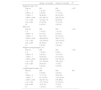
Table 2 provides detailed data on the distribution of the 4 parameters under study (weight-for-age, BMI-for-age, weight for length/height and length/height-for-age) at 12 and 24 months, and Table 3 the trends in the z scores between ages 12 and 24 months.
Nutritional status classification of participants based on WHO growth standards at 12 and 24 months.
| 12 months | 24 months | |
|---|---|---|
| Weight-for-age z (%) | ||
| Total (n) | 1495 | 1073 |
| ≤ –3 | 1 (0.1%) | 1 (0.1%) |
| −2.99 to −2 | 16 (1.1%) | 9 (0.8%) |
| −1.99 to −1 | 148 (9.9%) | 109 (10.2%) |
| −0.99 to +0.99 | 1077 (72%) | 750 (69.9%) |
| +1 to +1.99 | 213 (14.2%) | 167 (15.6%) |
| +2 to +2.99 | 34 (2.3%) | 32 (3%) |
| ≥ 3 | 6 (0.4%) | 5 (0.5%) |
| BMI-for-age z (%) | ||
| Total (n) | 1492 | 1073 |
| ≤ −3 | 2 (0.1%) | 4 (0.4%) |
| −2.99 to −2 | 13 (0.9%) | 18 (1.7%) |
| −1.99 to −1 | 149 (10%) | 125 (11.6%) |
| −0.99 to +0.99 | 1020 (68.4%) | 711 (66.3%) |
| +1 to +1.99 | 258 (17.3%) | 160 (14.9%) |
| +2 to +2.99 | 42 (2.8%) | 40 (3.7%) |
| ≥ 3 | 8 (0.5%) | 15 (1.4%) |
| Weight-for-length/height z (%) | ||
| Total (n) | 1493 | 1073 |
| ≤ −3 | 1 (0.1%) | 3 (0.3) |
| −2.99 to −2 | 13 (0.9%) | 11 (1%) |
| −1.99 to −1 | 146 (9.8%) | 130 (12.1%) |
| −0.99 to +0.99 | 1042 (69.8%) | 727 (67.8%) |
| +1 to +1.99 | 237 (15.9%) | 158 (14.7%) |
| +2 to +2.99 | 46 (3.1%) | 30 (2.8%) |
| ≥ 3 | 8 (0.5%) | 14 (,3%) |
| Length/height-for-age z (%) | ||
| Total (n) | 1490 | 1073 |
| ≤ −3 | 9 (0.6%) | 8 (0.7%) |
| −2.99 to −2 | 40 (2.7%) | 23 (2.1%) |
| −1.99 to −1 | 197 (13.2%) | 132 (12.3%) |
| −0.99 to +0.99 | 1017 (68.2%) | 712 (66.4%) |
| +1 to +1.99 | 192 (12.9%) | 167 (15.5%) |
| +2 to +2.99 | 35 (2.3%) | 28 (2.6%) |
| ≥ 3 | 2 (0.1%) | 4 (0.4%) |
BMI, body mass index; WHO, world health organization; z, z score.
Trends in the z scores of nutritional status indicators at ages 12 and 24 months.
| 12 months | 24 months | P | |
|---|---|---|---|
| Weight-for-age z (%) | |||
| Number of cases analysed | 1495 | 1073 | |
| Mean (95% CI) | 0.12 (0.07 to 0.17) | 0.17 (0.11 to 0.23) | .008 |
| Median (IQR) | 0.10 (1.24) | 0.22 (1.30) | |
| SD | 0.95 | 0.96 | |
| BMI z (%) | |||
| Number of cases analysed | 1492 | 1073 | |
| Mean (95% CI) | 0.20 (0.15 to 0.25) | 0.14 (0.07 to 0.21) | .020 |
| Median (IQR) | 0.19 (1.31) | 0.14 (1.40) | |
| SD | 0.99 | 1.10 | |
| Weight-for-length/height z (%) | |||
| Number of cases analysed | 1493 | 1073 | |
| Mean (95% CI) | 0.20 (0.15 to 0.25) | 0.12 (0.05 to 0.18) | .001 |
| Median (IQR) | 0.18 (1.31) | 0.10 (1.37) | |
| SD | 0.97 | 1.05 | |
| Length/height-for-age z (%) | |||
| Number of cases analysed | 1490 | 1073 | |
| Mean (95% CI) | −0.04 (−0.10 to 0.01) | 0.10 (0.03 to 0.16) | <.001 |
| Median (IQR) | −0.03 (1.41) | 0.12 (1.41) | |
| SD | 1.09 | 1.06 | |
Comparison of dependent means.
BMI, body mass index; CI, confidence interval; IQR, interquartile range; z, z score.
When it came to the low nutritional status categories on the WHO classification, at 12 months wasting (weight for length/height z score < −2) in 1% of the cohort, stunting (length/height z score < −2) in 3.2% and underweight (weight-for-age z score < −2) in 1.2%. At 24 months, these percentages were 1.3%, 2.8% and 0.9%, respectively.
As for the excess weight status categories (WHO), at 12 months, excess weight (overweight or obesity) defined based on the BMI-for-age (z score > +2) was found in the 3.3% of the cohort, and excess weight defined based on weight for length/height (z score > +2) in 3.6%. At 24 months, these percentages were 5.1% and 4.1%, respectively.
When it came to the “tendency toward excess weight”, at 12 months the proportion was 14.2% based on the weight-for-age, 17.3% based on the BMI-for-age, 15.9% based on the weight for length/height and 12.9% based on the length/height-for-age. At 24 months these percentages were 15.6%, 14.9%, 14.7% and 15.5%, respectively.
Association between total BF duration (less and greater than 6 months) and anthropometric values at 12 and 24 months.
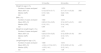
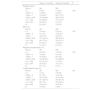
At 12 months there was a statistically significant association between the 4 anthropometric parameters under study and the total duration of BF (Table 4); with a tendency toward higher values in group 1 compared to group 2.
Impact at age 12 months of BF duration of less or more than 6 months on the different anthropometric parameters based on z score thresholds.
| Group 1 <6 months | Group 2 >6 months | Pa | |
|---|---|---|---|
| Weight-for-age z (%) | |||
| Total (n) | 661 | 834 | <.001 |
| ≤ −3 | 1 (0.2%) | 0 (0%) | |
| −2.99 to −2 | 5 (0.8%) | 11 (1.3%) | |
| −1.99 to −1 | 58 (8.8%) | 90 (10.8%) | |
| −0.99 to +0.99 | 441 (66.7%) | 636 (76.3%) | |
| +1 to +1.99 | 133 (20.1%) | 80 (9.6%) | |
| +2 to +2.99 | 21 (3.2%) | 13 (1.6%) | |
| ≥ 3 | 2 (0.3%) | 4 (0.5%) | |
| BMI z (%) | |||
| Total (n) | 659 | 833 | <.001 |
| ≤ −3 | 1 (0.2%) | 1 (0.1%) | |
| −2.99 to −2 | 8 (1.2%) | 5 (0.6%) | |
| −1.99 to −1 | 52 (7.9%) | 97 (11.6%) | |
| −0.99 to +0.99 | 428 (64.9%) | 592 (71.1%) | |
| +1 to +1.99 | 135 (20.5%) | 123 (14.8%) | |
| +2 to +2.99 | 30 (4.6%) | 12 (1.4%) | |
| ≥ 3 | 5 (0.8%) | 3 (0.4%) | |
| Weight-for-length/height z (%) | |||
| Total (n) | 660 | 833 | <.001 |
| ≤ −3 | 1 (0.2%) | 0 (0%) | |
| −2.99 to −2 | 3 (0.5%) | 10 (1.2%) | |
| −1.99 to −1 | 55 (8.3%) | 91 (10.9%) | |
| −0.99 to +0.99 | 430 (65.2%) | 612 (73.5%) | |
| +1 to +1.99 | 137 (20.8%) | 100 (12%) | |
| +2 to +2.99 | 29 (4.4%) | 17 (2%) | |
| ≥ 3 | 5 (0.8%) | 3 (0.4%) | |
| Length/height-for-age z (%) | |||
| Total (n) | 659 | 833 | .007 |
| ≤−3 | 5 (0.8%) | 4 (0.5%) | |
| −2.99 to −2 | 11 (1.7%) | 29 (3.5%) | |
| −1.99 to −1 | 81 (12.3%) | 116 (13.9%) | |
| −0.99 to +0.99 | 442 (67.1%) | 575 (69%) | |
| +1 to +1.99 | 101 (15.3%) | 91 (10.9%) | |
| +2 to +2.99 | 18 (2.7%) | 17 (2%) | |
| ≥ 3 | 1 (0.2%) | 1 (0.1%) | |
BF, breastfeeding; CI, confidence interval; z, z score.
At 24 months there was a statistically significant association between the total duration of BF and the weight-for-age, the BMI-for-age and weight for length/height, but this association was not observed for the length/height-for-age (Table 5). The direction of the trend was the same as at 12 months: greater values in group 1 vs. group 2. Fig. 1 compares the distributions of the 4 analysed anthropometric parameters at 12 and at 24 months based on the duration of BF.
Impact at age 24 months of BF duration of less or more than 6 months on the different anthropometric parameters based on z score thresholds.
| Group 1 <6 months | Group 2 >6 months | Pa | |
|---|---|---|---|
| Weight-for-age z | |||
| Total (n) | 481 | 592 | |
| ≤ −3 | 0 (0%) | 1 (0.2%) | <.001 |
| −2.99 to −2 | 4 (0.8%) | 5 (0.8%) | |
| −1.99 to −1 | 41 (8.5%) | 68 (11.5%) | |
| −0.99 to +0.99 | 314 (65.3%) | 436 (73.6%) | |
| +1 to +1.99 | 97 (20.2%) | 70 (11.8%) | |
| +2 to +2.99 | 23 (4.8%) | 9 (1.5%) | |
| ≥ 3 | 2 (0.4%) | 3 (0.5%) | |
| BMI z (%) | |||
| Total (n) | 481 | 529 | |
| ≤ −3 | 2 (0.4%) | 2 (0.3%) | <.001 |
| −2.99 to −2 | 5 (1.0%) | 13 (2.2%) | |
| −1.99 to −1 | 42 (8.7%) | 83 (14%) | |
| −0.99 to +0.99 | 311 (64.7%) | 400 (67.6%) | |
| +1 to +1.99 | 85 (17.7%) | 75 (12.7%) | |
| +2 to +2.99 | 27 (5.6%) | 13 (2.2%) | |
| ≥ 3 | 9 (1.9%) | 6 (1.0%) | |
| Weight-for-length/height z (%) | |||
| Total (n) | 481 | 593 | |
| ≤ −3 | 2 (0.4%) | 1 (0.2%) | <.001 |
| −2.99 to −2 | 3 (0.6%) | 8 (1.4%) | |
| −1.99 to −1 | 47 (9.8%) | 83 (14%) | |
| −0.99 to +0.99 | 314 (65.3%) | 413 (69.8%) | |
| +1 to +1.99 | 87 (18.1%) | 71 (12%) | |
| +2 to +2.99 | 20 (4.2%) | 10 (1.7%) | |
| ≥ 3 | 8 (1.7%) | 6 (1%) | |
| Length/height-for-age (%) | |||
| Total (n) | 481 | 592 | .129 |
| ≤ −3 | 5 (1%) | 3 (0.5%) | |
| −2.99 to −2 | 9 (1.9%) | 14 (2.4%) | |
| −1.99 to −1 | 56 (11.6%) | 76 (12.8%) | |
| −0.99 to +0.99 | 311 (64.7%) | 401 (67.7%) | |
| +1 to +1.99 | 82 (17%) | 84 (14.2%) | |
| +2 to +2.99 | 14 (2.9%) | 14 (2.4%) | |
| ≥3 | 4 (0.8%) | 0 (0%) | |
BF, breastfeeding; BMI, body mass index; z, z score.

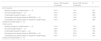
Table 6 reflects the impact of BF duration on the WHO nutritional status classification, showing a statistically significant association at both 12 and 24 months between duration of BF of less than 6 months and a higher percentage of excess weight (based on BMI-for-age and weight for length/height).
Association between WHO categories for abnormal nutritional status (low or excess weight status) and BF duration less or greater than 6 months at ages 12 and 24 months.
| Group 1 (BF duration <6 months) | Group 2 (BF duration >6 months) | P | |
|---|---|---|---|
| At 12 months | |||
| Wasting (weight for length/height z < −2) | 0.6% | 1.2% | .237 |
| Stunting (length/height z < −2) | 2.4% | 4.0% | .099 |
| Underweight (weight-for-age z < −2) | 0.9% | 1.3% | .456 |
| Overweight and obesity based on BMI (BMI z > +2) | 5.3% | 1.8% | <.001 |
| Overweight and obesity based on weight for length/height (weight for length/height z > +2) | 5.2% | 2.4% | .005 |
| At 24 months | |||
| Wasting (weight for length/height z < −2) | 1.0% | 1.5% | .490 |
| Stunting (length/height z < −2) | 2.9% | 2.9% | .970 |
| Underweight (weight-for-age z < −2) | 0.8% | 1.0% | .758 |
| Overweight and obesity based on BMI (BMI z > +2) | 7.5% | 3.2% | .002 |
| Overweight and obesity based on weight for length/height (weight for length/height z > +2) | 5.8% | 2.7% | .010 |
BF, breastfeeding; BMI, body mass index; WHO, World Health Organization; z, z score.
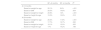
Table 7 shows the statistically significant association between the duration of BF and the “tendency toward excess weight” at 12 and at 24 months, with a higher percentage in group 1 compared to group 2.
Tendency toward excess weight (z score between +1 and +1.99) at ages 12 and 24 months based on breastfeeding duration.
| BF <6 months | BF >6 months | Pa | |
|---|---|---|---|
| At 12 months | |||
| Based on weight-for-age | 20.1% | 9.6% | <.001 |
| Based on BMI | 20.5% | 14.8% | .004 |
| Based on weight-for-height | 20.8% | 12% | <.001 |
| Based on height for age | 15.3% | 10.9% | .012 |
| At 24 months | |||
| Based on weight-for-age | 20.2% | 11.8% | <.001 |
| Based on BMI | 17.7% | 12.7% | .022 |
| Based on weight-for-height | 18.1% | 12.0% | .005 |
| Based on height for age | 17% | 14.2% | .198 |
BF, breastfeeding; BMI, body mass index.
In the study cohort, we found differences in the maternal pregestational BMI between groups 1 and 2 (Table 1), which led us to analyse its impact on nutritional status as a confounder or moderator in the association with the duration of BF.
To assess this effect, we performed a stratified analysis for the association of the duration of BF (<6 months vs. > 6 months) with the classification of excess weight (overweight or obesity) based on the BMI-for-age (z score ≥ +2 DS), stratifying the maternal pregestational BMI as greater or lesser than 25. We found that the association continued to be significant for a maternal pregestational BMI of less than 25(OR, 2.9; 95% CI, 1.3–6.6; P = .006), but not for a BMI greater than 25 (OR, 1.8; 95% CI, 0.8–4.2; P = .1439 [Mantel–Haenszel χ2 0.005]); thus, the maternal pregestational BMI moderated this association and acted as an interaction variable.
DiscussionThe official recommendations and all scientific associations in regard to BF are quite clear, in spite of which current values do not reach the recommended targets.25 The many consequences of poor adherence to BF recommendations, especially in Western societies, seem to include future obesity and metabolic syndrome. Early discontinuation or absence of BF could be related to an increased weight gain in infants in the first months of life, with an impact on childhood and, consequently, on adult life.6,26–28
Excess weight during childhood is a growing health problem in every country, but the study conducted by Rito et al.29 in 22 countries found the highest prevalence in obesity in Spain at 17.7%. There is no question that this problem and its impact on public health are quite serious.
Our study demonstrated a clear association between a duration of BF (in any form) of less than 6 months and a tendency toward greater weight gain at 12 and 24 months based on different anthropometric parameters.
Overall, the 4 parameters under study found a population distribution that clearly fitted the normal distribution. The cohort consisted of healthy boys and girls fed and cared for in a Western society with adequate health care services. The prevalence of the low weight categories in the WHO classification was very low, but the prevalence for excess weight categories was slightly greater.
The longitudinal follow-up of a cohort of this kind allows assessment of the potential impact of infant feeding modalities and their duration on anthropometric values. Thus, we divided the cohort in 2 groups based on the duration of BF (less or more than 6 months), evincing a clear trend: a duration of BF of less than 6 months was associated with increased growth values based on different parameters at both 12 and 24 months. And this trend was objectively demonstrated in the analysis of the percentages categorised as overweight or obesity based on the WHO classification, in addition to the analysis of the separate category of “tendency toward excess weight” that included z scores ranging from +1 to +1.99.
As we commented in the introduction, there are already numerous international studies showing an association between the absence of early discontinuation of BF and excess weight in the first years of life.30–32 The study by Ma et al. confirmed that BF can protect against obesity and high body fat29 in children aged 9–11 years in 12 countries and the meta-analysis carried out by the authors of 26 publications adding up to more than 300 000 participants concluded that BF is inversely associated with the risk of early obesity in children aged 2–6 years, with evidence of a dose-response effect between the duration of BF and the reduction in the risk of obesity in early childhood.32 Our study, one of the first conducted on the subject in Spain, corroborates these findings, analysing the routine visits at 1 and 2 years of age and comparing the 4 classic anthropometric parameters in 2 groups defined based on BF duration (less or more than 6 months).
Our study showed that the pregestational maternal weight status (assessed through the BMI) moderates the interaction between BF duration and excess weight (overweight/obesity) based on the BMI at 24 months, so that the maternal pregestational BMI is also variable to consider in this association, as noted by other authors.18,20,33
ConclusionIn our nationwide multicentre prospective cohort study, conducted in the primary care paediatrics setting, a duration of BF of less than 6 months was associated with a greater percentage of excess weight (overweight or obesity) at 12 and 24 months, although there were other factors, such as maternal obesity, that could have interacted with this association.
Ethical considerationsThe PAPenRED project was approved by the Ethics and Scientific Research Committee of Aragón (Favourable ruling, minute no 19/2013; C.P.-C.I. PI13/00154) and the study presented here was approved by the Research Ethics Committee of the Principality of Asturias (study 213/16). It also received a favourable ruling from the Central Research Committee of the Department of Health of Madrid (February 23, 2017). The mother provided signed informed consent in the first medical visit performed at 15 days post birth. Each child was assigned a code to ensure anonymization.
FundingThe LAYDI study was awarded one of the research grants of the Asociación Española de Pediatría de Atención Primaria-Fundación Pediatría and Salud (AEPap-FPS) in 2017.
Conflicts of interestThe authors have no conflicts of interest to declare.
The following is Supplementary data to this article:

Appendix A of the supplemental material lists the paediatricians who collaborated in the LAyDI study.
