
Obesity in the child population and its effect in the development of metabolic diseases are a public health issue. One of the aims of the European Project in a health system, is the evaluation of the effectiveness of a multidisciplinary health promotion program directed at adolescents with risk factors associated with the development of type 2 Diabetes Mellitus (T2DM).
Patients and methodsRandomised clinical trial with two groups of 12–14 year-old overweight adolescents. The intervention group took part in a multidisciplinary program for 24 months. This program was based on 11 group sessions (8 main sessions and 3 additional support ones) for adolescents and their guardians. The control group received usual care at primary care level. Longitudinal regression models were adjusted to assess the evolution of anthropometric measures and living habits at baseline, 3, 6, 12, and 24 months in both groups.
ResultsThere were 92 participants, equally distributed by group. Statistically significant differences were observed between intervention and control groups in several results: evolution of the body mass index; increase in the consumption of fruits and vegetables; decrease in the consumption of snacks and sweetened drinks; and increase in the number of days per week with more than one hour of physical activity.
ConclusionsThe results confirm the effectiveness of this multidisciplinary program, both in the evolution of the body mass index, and in the improvement of the eating and physical activity habits, all of them risk factors for the future development of metabolic diseases, such as T2DM.
La obesidad en la población pediátrica y su efecto en la génesis de enfermedades metabólicas, constituye un gran problema de salud pública. Uno de los objetivos del estudio de ámbito europeo en un sistema de salud es evaluar la efectividad de un programa de promoción de la salud dirigido a adolescentes con factores de riesgo asociados al desarrollo de Diabetes Mellitus tipo 2 (DMT2).
Pacientes y métodosEnsayo clínico con doble grupo aleatorizado de adolescentes de 12 a 14 años con exceso ponderal. El grupo intervención recibió un programa multidisciplinar durante 24 meses, de 11 sesiones grupales (8al inicio, 3 de refuerzo) junto a sus tutores. El grupo control continuó el seguimiento habitual por los equipos de pediatría de Atención Primaria. Se plantean modelos longitudinales para estudiar la evolución de medidas antropométricas y hábitos de vida desde el momento basal, a los 3, 6, 12 y 24 meses.
ResultadosParticiparon 92 personas en el estudio, igualmente distribuidas por grupo. Se observaron mejoras estadísticamente significativas en varios resultados: evolución del índice de masa corporal; aumento del consumo de frutas y verduras; disminución del consumo de snacks y de bebidas azucaradas; y aumento del número de días por semana en los que realizan más de 1hora de ejercicio físico.
ConclusionesLos resultados confirman la efectividad del programa multidisciplinar tanto en la evolución del índice de masa corporal como en la mejora de los hábitos alimentarios y de actividad física, todos ellos factores de riesgo en la génesis de enfermedades metabólicas futuras, como la DMT2.
Type 2 diabetes (T2D) is a serious chronic disease that causes multiple complications. It is estimated that it is the third leading cause of death worldwide1 and its prevalence continues to increase, having reached epidemic proportions.2,3
Type 2 diabetes has gone from being primarily a disease of adulthood to having onset at younger ages, mainly in relation to the increase in the prevalence of obesity and sedentary lifestyles.4 There has been an increase in the prevalence of T2D in young adults and adolescents, with an incidence that varies between geographical areas5,6 that continues to increase in individuals aged less than 30years.7–9 The data for the population of Spain are scarce, with a lower incidence compared to neighbouring countries.10–12 Until 2002, T2D was not considered a paediatric disease. It was that year that the World Health Organization (WHO) started to issue recommendations for its early detection.13 Furthermore, the progression from glucose intolerance to T2D is accelerated in the young adult and paediatric populations.14 Due to all the above, early intervention in this subpopulation is considered of great importance.3,15,16
Evidence from observational studies shows that 80%–90% of cases of T2D result from unhealthy lifestyle habits.17,18 Randomised controlled trials focused on T2D performed in different countries and populations19,20 have evinced that interventions based on lifestyle changes can reduce the risk of progression from glucose intolerance to T2D.21 There is also evidence that for interventions to be effective they need to be multidisciplinary, intensive and led by professionals specifically trained for the purpose.22–25
Several systematic reviews26–30 and clinical practice guidelines16,31 highlight the most efficacious aspects of strategies for the management of obesity in youth: a combination of sedentary lifestyle, dietary and behavioural changes, involvement of parents and legal guardians and improving the knowledge and motivation of children in addition to assessing their mood.
The above aspects, combined with the lessons learned in implemented strategies for the prevention of diabetes and associated risk factors in other countries and the need to improve the evidence currently available,25,32,33 motivated the development of the PRE-STARt tool and implementation of the PRE-STARt study at the European level,34 a multidisciplinary intervention seeking to promote healthy lifestyles in adolescents at risk of T2D. The aim of this study is to assess the efficacy of the intervention at 24 months of follow-up in the PRE-STARt study in Euskadi (Basque Country) based on the prevention of increases in body mass index (BMI) in adolescents aged 12–14 years and changes in lifestyle habits (diet and physical activity). The global outcomes of the European study are currently being reviewed.
Sample and methodsStudy designThe study was a cluster randomised controlled clinical trial with a 2-year follow-up. The protocol was approved by the Ethics Committee of Euskadi (reference no. CEIC 2014194).
ParticipantsThe study included adolescents aged 12–14 years with excess weight (overweight in case of a BMI between 1 and 2 standard deviations [SDs] above the mean for age and sex, obesity in case of a BMI more than 2 SDs above the mean for age and sex using the WHO child growth standards35) recruited through the primary care paediatric clinics of the Public Health System of the Basque Country (Osakidetza). We excluded individuals with a previous diagnosis of any type of diabetes or with secondary obesity.
Twenty-six primary care paediatricians were randomly assigned to the intervention group (IG) or control group (CG) so that all their patients were included in the corresponding group. Participants were included in the study following obtention of informed consent to their participation. The follow-up of participants in both groups was carried out by the primary care team of the health district where participants were assigned to receive general care. The CG received the routine care established by the Osakidetza, with recommendation of healthy dietary and physical activity habits and interventions aimed at changing household habits, but with the time constraints applicable to routine primary care visits. The IG underwent an intensive multidisciplinary group-based intervention to promote healthy lifestyle habits along with their parents or legal guardians.
InterventionThe intervention was implemented by 2 dietitians/nutritionists with training and experience in the delivery of programmes for management of excess weight in the paediatric population.
The protocol applied cognitive-behavioural and psychodynamic methods to address the basic principles of healthy nutrition, develop self-control, improve body image, increase communication, facilitate conflict resolution and assertiveness, improve self-esteem, increase physical activity, reduce sedentary behaviour and facilitate affective changes in the household environment. Participants were also given the space to explore and express their feelings regarding excess weight and its repercussions.
The intervention targeted adolescents and their home environment, that is, the proposed changes were aimed at the entire household with the aim of facilitating adherence to the programme. The goal was to achieve long-term changes in lifestyle.
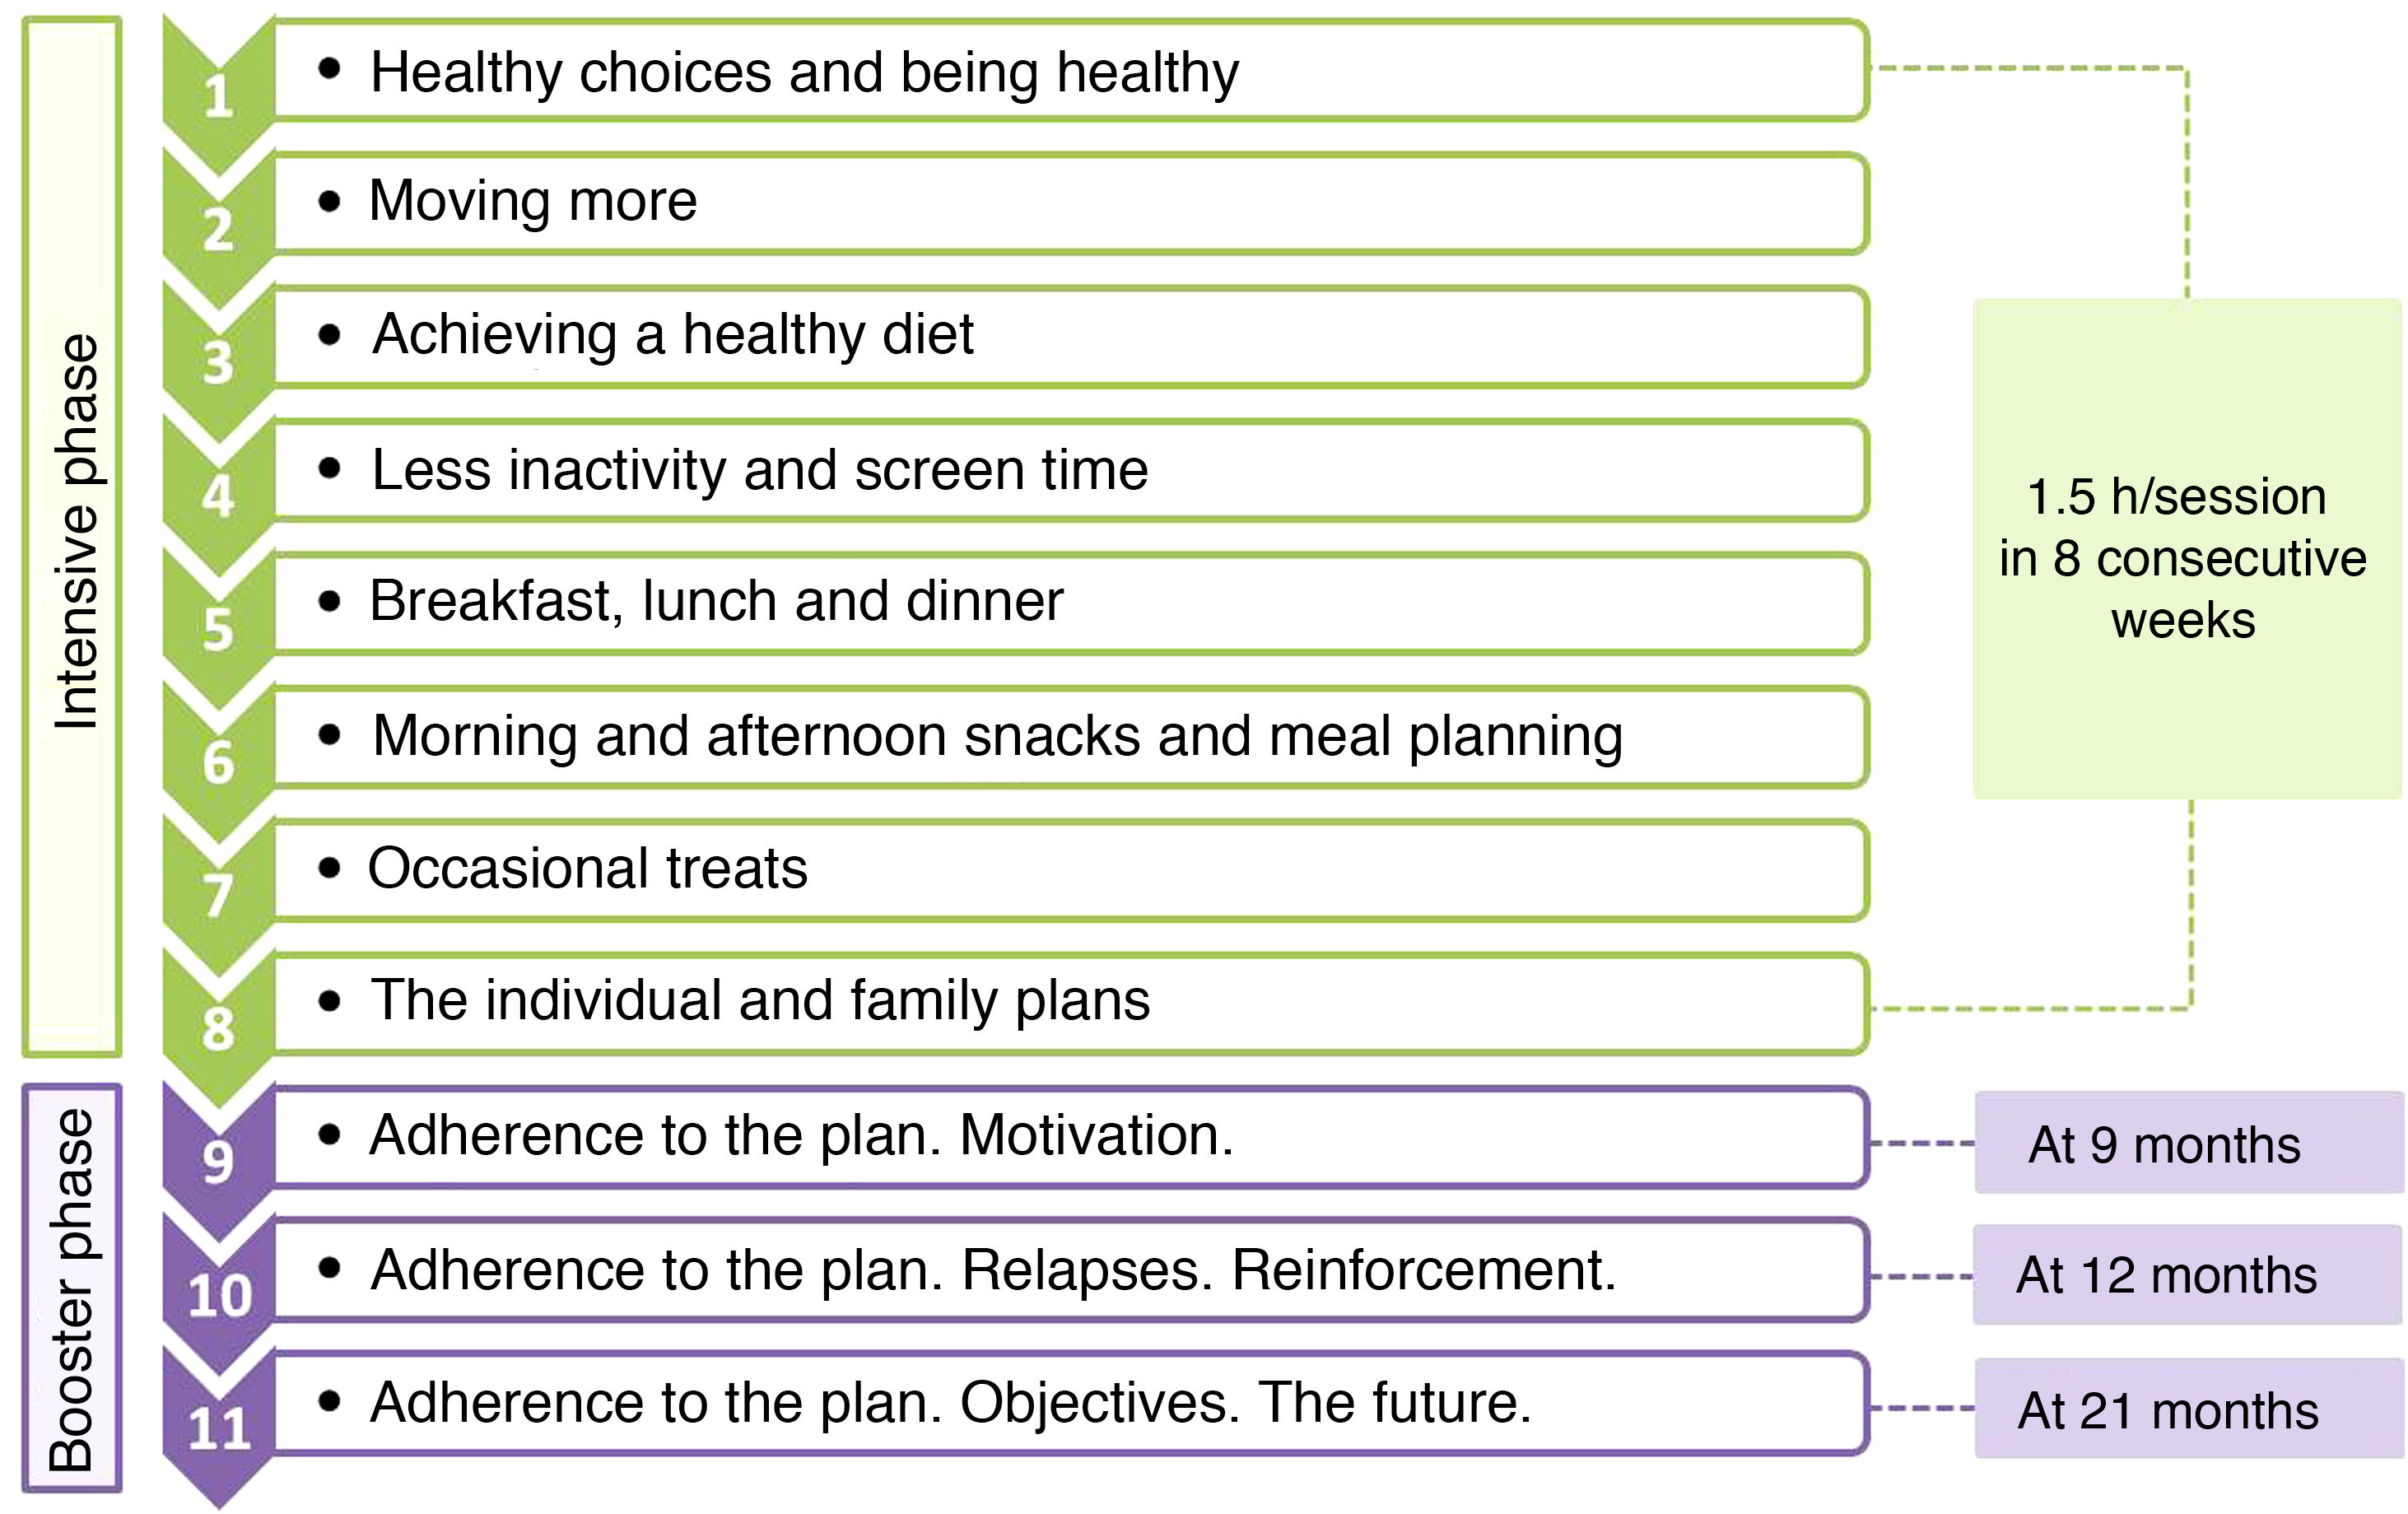
The programme consisted of 11 sessions with a cumulative duration of 16.5h, and was divided in 2 phases: an intensive phase with 1 weekly session lasting 1.5h for 8 consecutive weeks, and a booster phase consisting of 3 sessions at 9, 12 and 21 months (Fig. 1). In each session, 2 groups were set up that worked simultaneously, one of adolescents (12 per group) and one of parents or guardians (approximately 20 per group). All sessions were held after school hours outside the school setting.
Variables
The primary outcomes used to assess the efficacy of the intervention were the BMI and BMI z-score. In each visit, at baseline and 3, 6, 12 and 24 months, patients underwent an assessment that included anthropometric measurements (weight, height and waist, arm and neck circumference), measurement of vital signs including the heart rate and systolic and diastolic blood pressure (total of 3 measurements, with documentation of the mean of the last 2, taken in the right arm with a certified automated device with the patient in a seated position after a resting period of at least 5min) and determination of the stage of pubertal development (Tanner scale). The diet (servings of fruit and vegetables, consumption of sugary drinks and snacks) and level of physical activity (number of days per week the participant exercised for at least 1h) were also assessed by means of questionnaires. At baseline, we collected data on sociodemographic characteristics (age, sex, race), family history (T2D, cardiovascular disease, hypertension and excess weight), prenatal history (weeks of gestation, gestational diabetes), personal history (birth weight, small for gestational age [SGA], breastfeeding and its duration), and laboratory parameters (glycaemia, glycated haemoglobin [HbA1c], triglycerides, total cholesterol, high-density lipoprotein [HDL]).
Sample sizeThe European PRE-STARt study was split in 2 phases. The goal of Phase 1 was to develop a tool for the identification of adolescents aged 12–14 years at increased risk of developing T2D in the future.34 The target sample size for this phase was of 100 participants per region, and the study included a total of 5 regions in Europe. Phase 2 consisted in implementing an intervention in a subset of the initial sample and assessing its outcomes. The protocol contemplated performance of assessments at baseline, 3 months and 6 months. In the Basque Country, the research group chose to extend the follow-up to 12 and 24 months. To this end, we performed a new sample size calculation for the selection of the subset of participants for this phase.
The primary endpoint was the detection of a minimum difference of at least 0.5 points in the BMI z-score between the intervention and control groups with a SD of 1.3. We determined that a minimum of 36 participants per group for a total sample of 72 participants would be needed for an alpha level of 0.05 and a power of 90% in the comparison of paired measurements (with a coefficient of 0.9) assuming an attrition rate of 20%. The calculation was performed with the Granmo sample size calculation tool, version 7.12 (Institut Municipal d'Investigació Mèdica, Barcelona, Spain).
Statistical analysisWe have summarised categorical variables as absolute frequencies and percentages, and continuous variables as mean and standard deviation (SD) in case they were normally distributed and otherwise as median and interquartile range (IQR). We assessed differences in categorical variables between the IG and CG (independent samples) or the pre- and post-intervention periods (paired samples) by means of the χ2 test in case of unpaired data and the McNemar test in case of paired data; differences in normally distributed variables by means of the Student t test for independent or paired samples as applicable, and differences in continuous variables that did not follow a normal distribution by means of the Wilcoxon test, using the rank-sum test for unpaired data and the signed-rank test for paired data.
We also conducted intent-to-treat analyses to assess the impact of the intervention through time. Due the hierarchical data structure, we fitted linear mixed models adjusted for different confounding variables. We treated primary care centres and individuals as random effects in these models. The impact of the intervention was assessed considering the interaction of the group (IG vs CG) and the duration of follow-up. Time was included as a continuous variable and, in cases in which the effect of the intervention was more pronounced at intermediate time points, as a quadratic term. We present the final models as the estimated differences between the IG and CG at each time point. The results are presented with P-values for the group×time interaction coefficient and also with the intraclass correlation coefficient (ICC) for the primary care centre level. The statistical analysis was performed with the free software R, version 3.4 (R Foundation for Statistical Computing; Vienna, Austria).
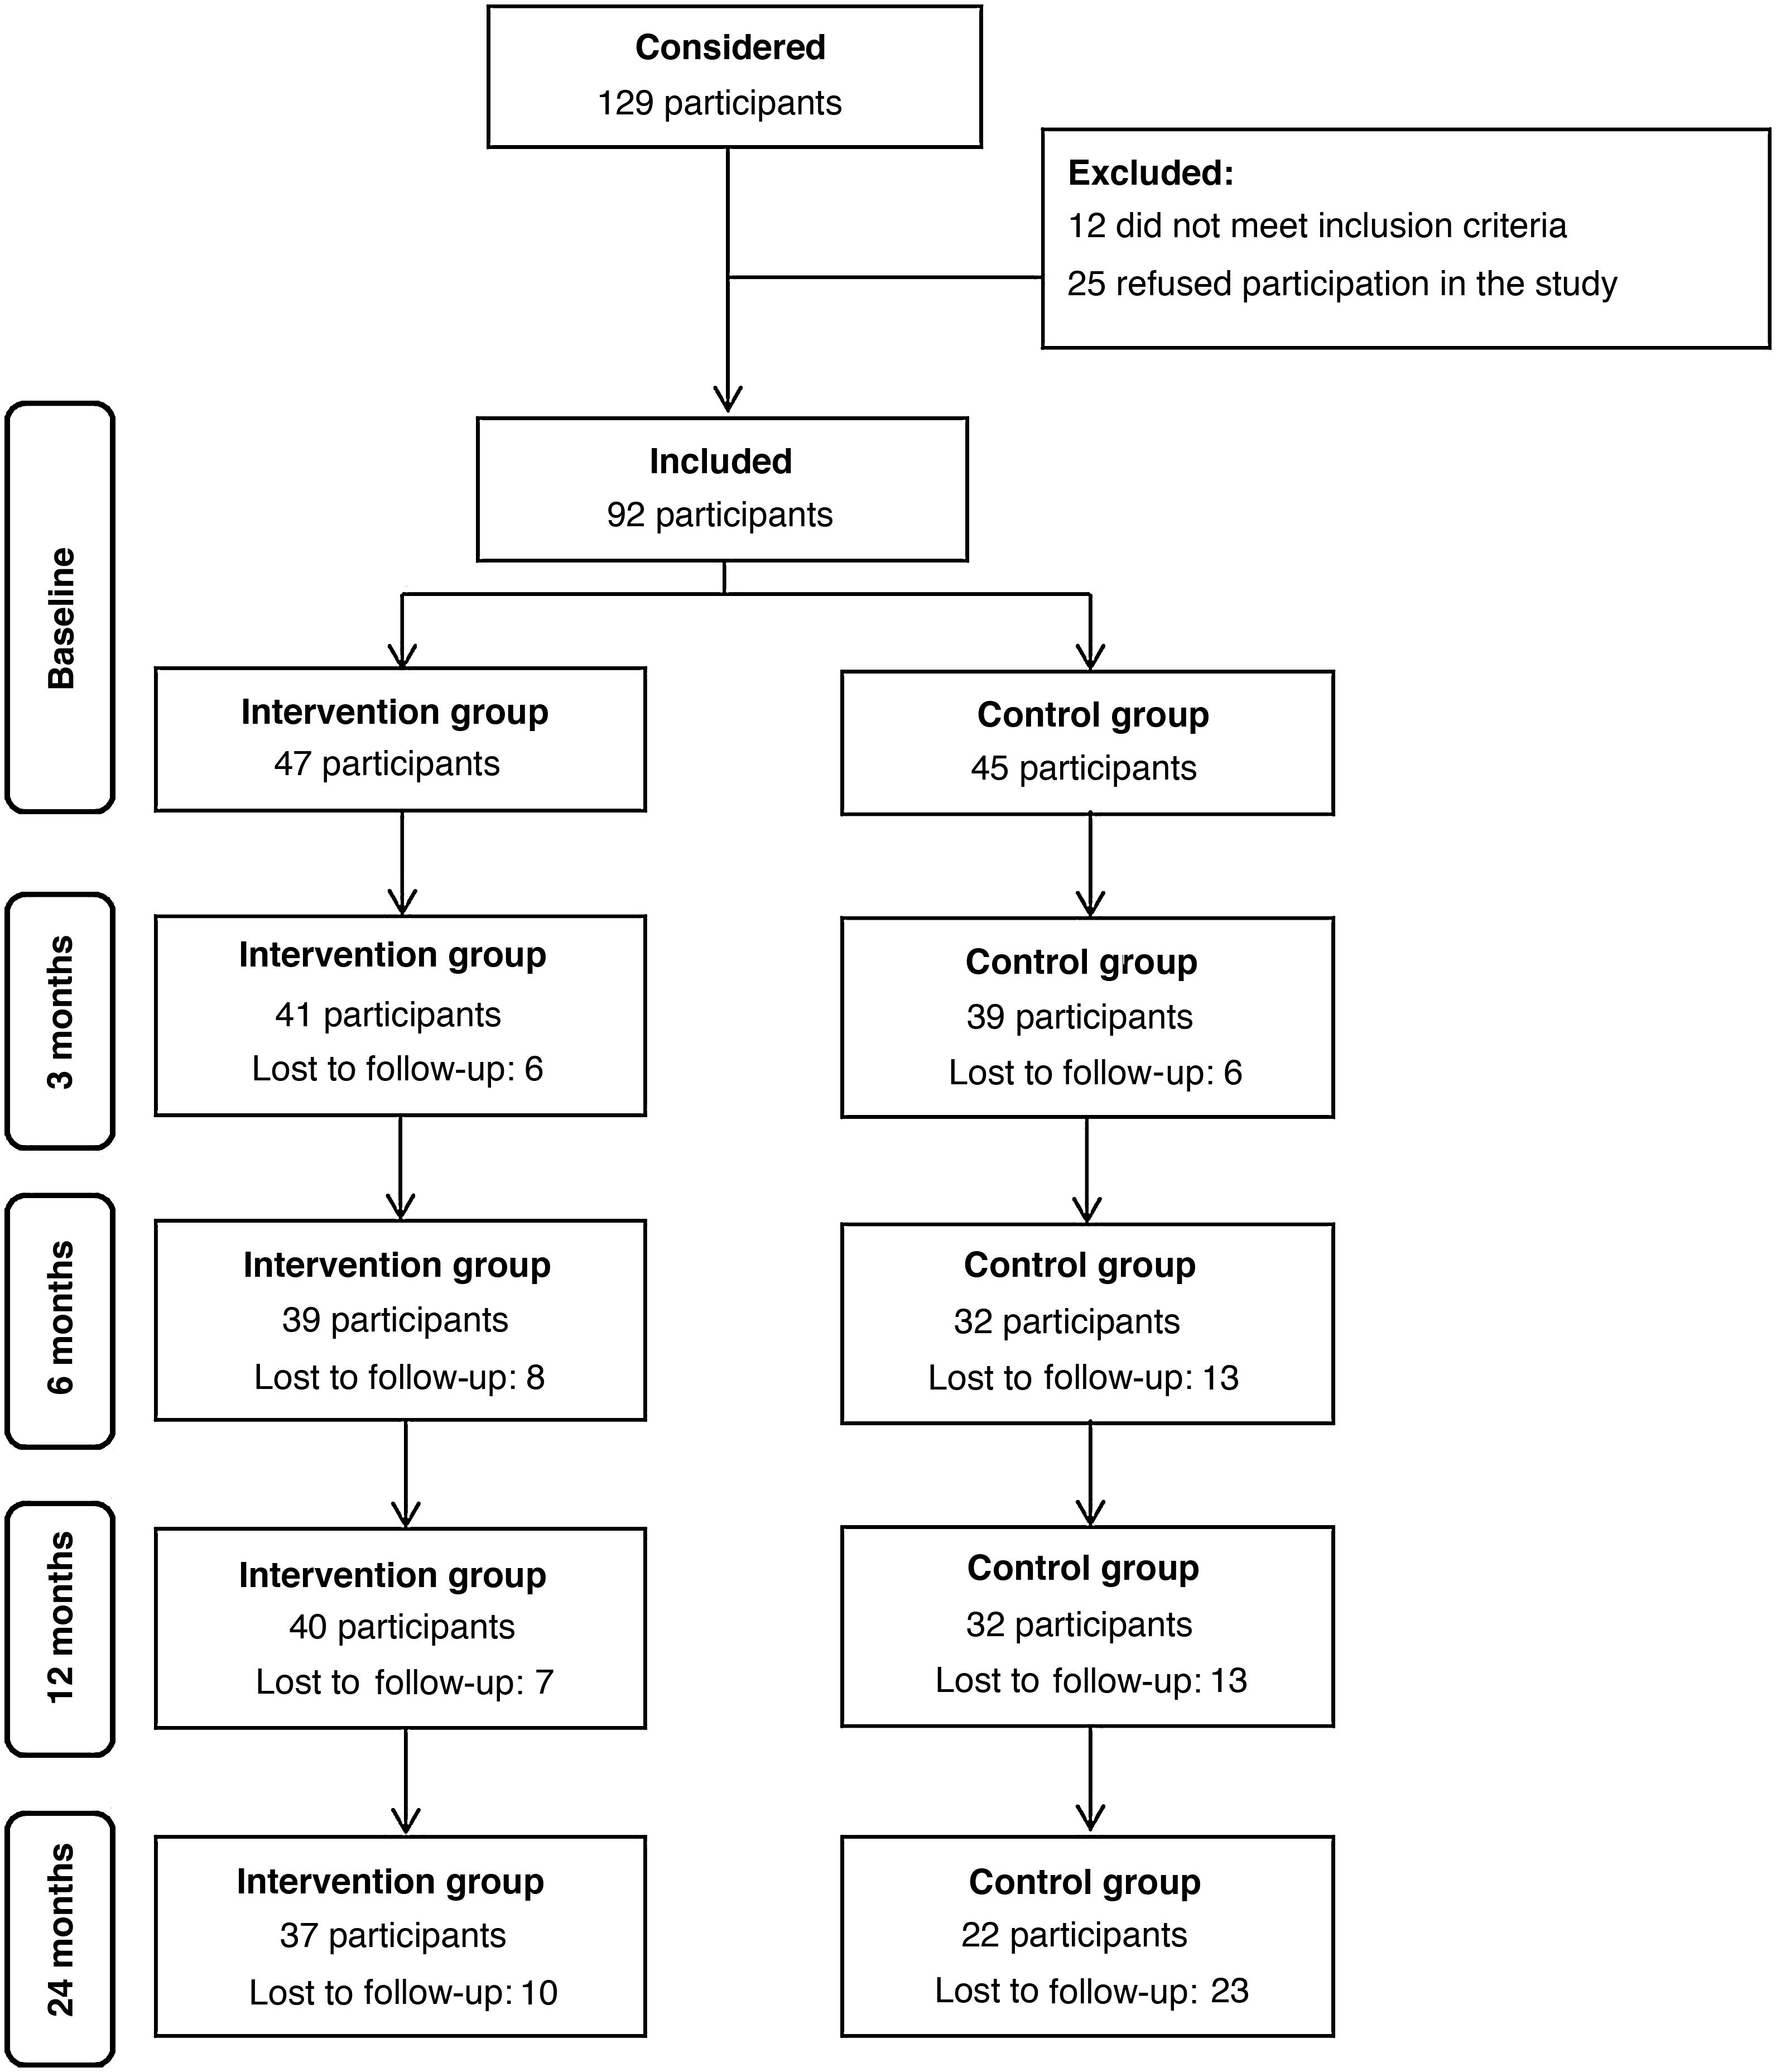
ResultsWe included a total of 92 participants in the study, 47 in the IG and 45 in the CG. During the 2-year follow-up, the attrition rate was 21% in the IG and 51% in the CG, a difference that was statistically significant (P=0.006). Fig. 2 presents a flow chart of participation throughout the follow-up.

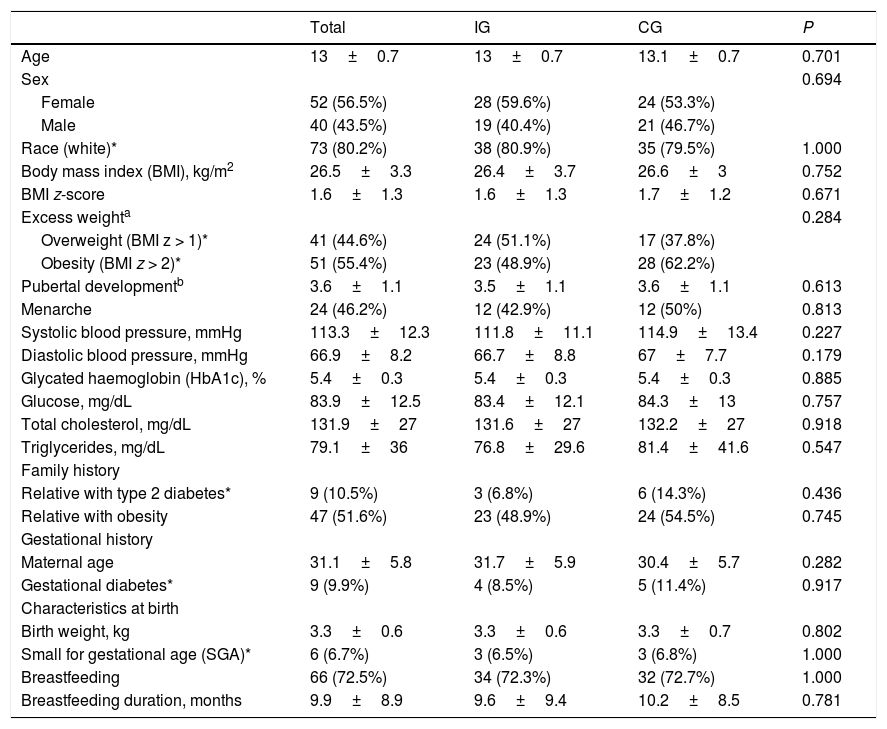
Table 1 summarises the baseline characteristics of the participants. We did not find differences between the IG and the CG. The mean age of participants was 13 years (SD, 0.7), and the sex distribution was similar in both groups, with a predominance of female participants (56%). Eighty percent of participants were white. The mean BMI at baseline was 26.5 (SD, 3.3), without differences between the groups. We also found no differences between groups in the prevalence of risk factors for T2D.36
Baseline characteristics of the total sample (N=92), intervention group (n=47) and control group (n=45).
| Total | IG | CG | P | |
|---|---|---|---|---|
| Age | 13±0.7 | 13±0.7 | 13.1±0.7 | 0.701 |
| Sex | 0.694 | |||
| Female | 52 (56.5%) | 28 (59.6%) | 24 (53.3%) | |
| Male | 40 (43.5%) | 19 (40.4%) | 21 (46.7%) | |
| Race (white)* | 73 (80.2%) | 38 (80.9%) | 35 (79.5%) | 1.000 |
| Body mass index (BMI), kg/m2 | 26.5±3.3 | 26.4±3.7 | 26.6±3 | 0.752 |
| BMI z-score | 1.6±1.3 | 1.6±1.3 | 1.7±1.2 | 0.671 |
| Excess weighta | 0.284 | |||
| Overweight (BMI z > 1)* | 41 (44.6%) | 24 (51.1%) | 17 (37.8%) | |
| Obesity (BMI z > 2)* | 51 (55.4%) | 23 (48.9%) | 28 (62.2%) | |
| Pubertal developmentb | 3.6±1.1 | 3.5±1.1 | 3.6±1.1 | 0.613 |
| Menarche | 24 (46.2%) | 12 (42.9%) | 12 (50%) | 0.813 |
| Systolic blood pressure, mmHg | 113.3±12.3 | 111.8±11.1 | 114.9±13.4 | 0.227 |
| Diastolic blood pressure, mmHg | 66.9±8.2 | 66.7±8.8 | 67±7.7 | 0.179 |
| Glycated haemoglobin (HbA1c), % | 5.4±0.3 | 5.4±0.3 | 5.4±0.3 | 0.885 |
| Glucose, mg/dL | 83.9±12.5 | 83.4±12.1 | 84.3±13 | 0.757 |
| Total cholesterol, mg/dL | 131.9±27 | 131.6±27 | 132.2±27 | 0.918 |
| Triglycerides, mg/dL | 79.1±36 | 76.8±29.6 | 81.4±41.6 | 0.547 |
| Family history | ||||
| Relative with type 2 diabetes* | 9 (10.5%) | 3 (6.8%) | 6 (14.3%) | 0.436 |
| Relative with obesity | 47 (51.6%) | 23 (48.9%) | 24 (54.5%) | 0.745 |
| Gestational history | ||||
| Maternal age | 31.1±5.8 | 31.7±5.9 | 30.4±5.7 | 0.282 |
| Gestational diabetes* | 9 (9.9%) | 4 (8.5%) | 5 (11.4%) | 0.917 |
| Characteristics at birth | ||||
| Birth weight, kg | 3.3±0.6 | 3.3±0.6 | 3.3±0.7 | 0.802 |
| Small for gestational age (SGA)* | 6 (6.7%) | 3 (6.5%) | 3 (6.8%) | 1.000 |
| Breastfeeding | 66 (72.5%) | 34 (72.3%) | 32 (72.7%) | 1.000 |
| Breastfeeding duration, months | 9.9±8.9 | 9.6±9.4 | 10.2±8.5 | 0.781 |
Data expressed as absolute frequency (percentage) or mean±standard deviation.
CG, control group; IG, intervention group.
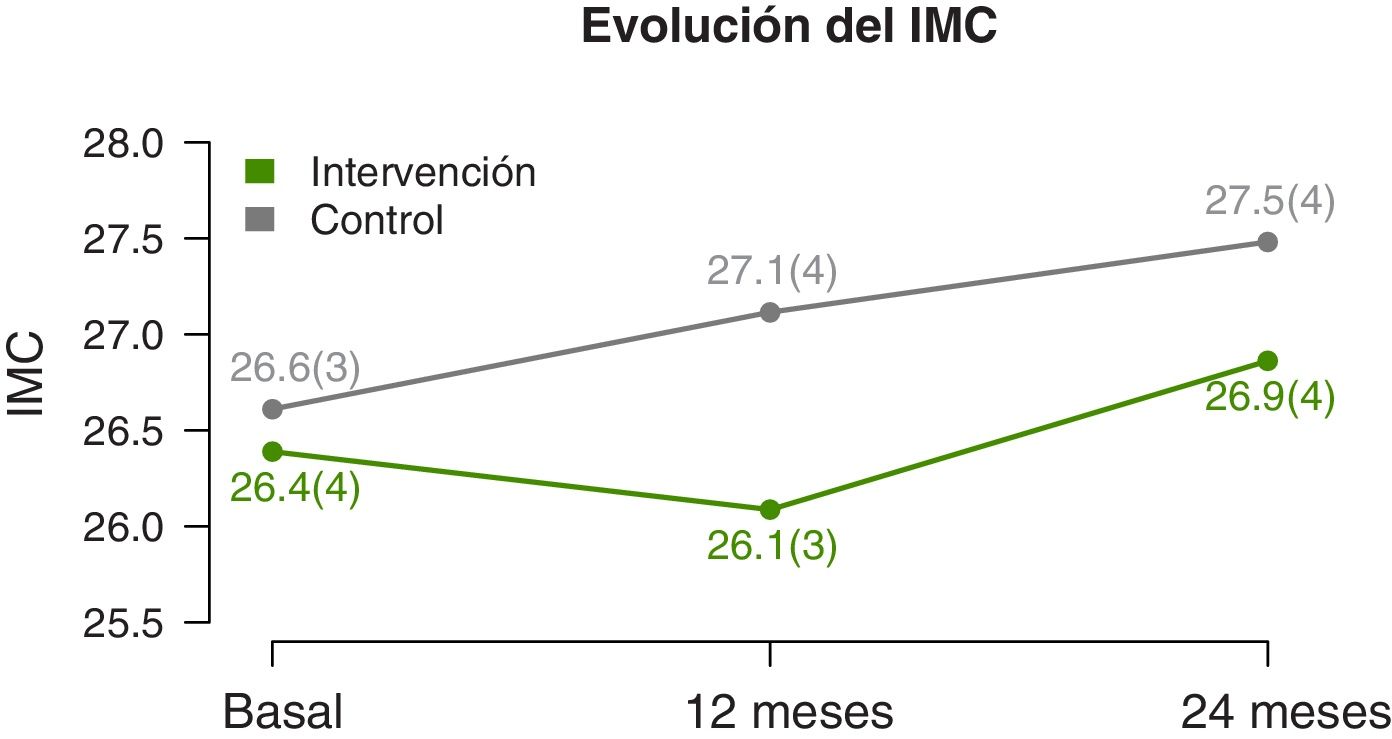
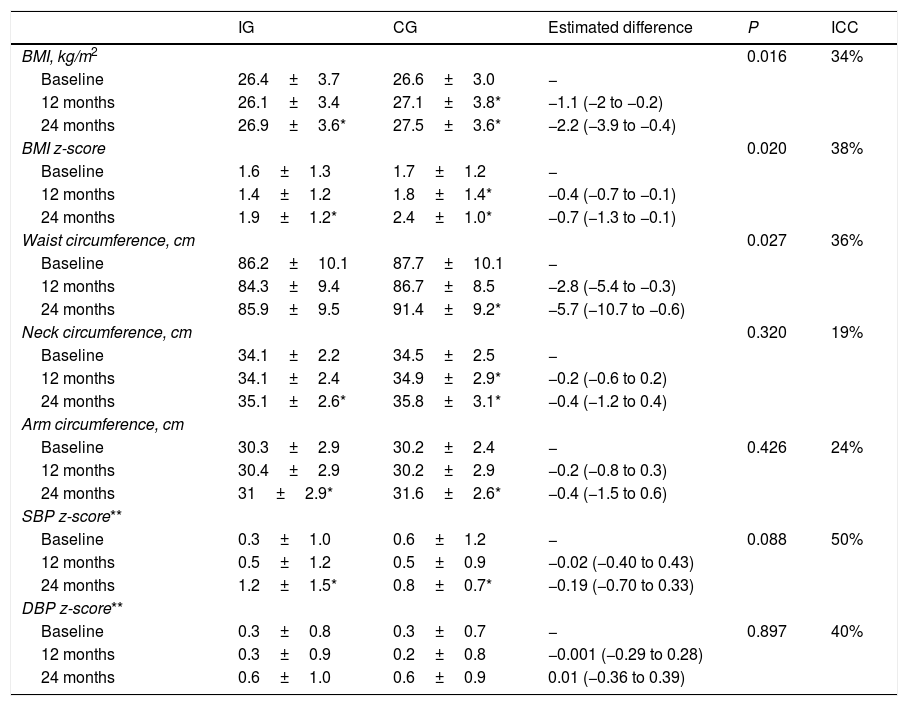
We found significant differences in the temporal trends of the BMI and BMI z-score (Table 2). At 12 months, they both decreased in the IG and increased in the CG. And at 2 years, we found an increase in both groups, but smaller in the IG (Fig. 3). The waist circumference increased significantly in the CG but was maintained in the IG. We did not find significant differences in the neck and arm circumference trends. We also found no differences in the blood pressure z-score trends.
Changes in BMI and anthropometric measurements during the follow-up and differences between the intervention group (n=47) and control group (n=45).
| IG | CG | Estimated difference | P | ICC | |
|---|---|---|---|---|---|
| BMI, kg/m2 | 0.016 | 34% | |||
| Baseline | 26.4±3.7 | 26.6±3.0 | − | ||
| 12 months | 26.1±3.4 | 27.1±3.8* | −1.1 (−2 to −0.2) | ||
| 24 months | 26.9±3.6* | 27.5±3.6* | −2.2 (−3.9 to −0.4) | ||
| BMI z-score | 0.020 | 38% | |||
| Baseline | 1.6±1.3 | 1.7±1.2 | − | ||
| 12 months | 1.4±1.2 | 1.8±1.4* | −0.4 (−0.7 to −0.1) | ||
| 24 months | 1.9±1.2* | 2.4±1.0* | −0.7 (−1.3 to −0.1) | ||
| Waist circumference, cm | 0.027 | 36% | |||
| Baseline | 86.2±10.1 | 87.7±10.1 | − | ||
| 12 months | 84.3±9.4 | 86.7±8.5 | −2.8 (−5.4 to −0.3) | ||
| 24 months | 85.9±9.5 | 91.4±9.2* | −5.7 (−10.7 to −0.6) | ||
| Neck circumference, cm | 0.320 | 19% | |||
| Baseline | 34.1±2.2 | 34.5±2.5 | − | ||
| 12 months | 34.1±2.4 | 34.9±2.9* | −0.2 (−0.6 to 0.2) | ||
| 24 months | 35.1±2.6* | 35.8±3.1* | −0.4 (−1.2 to 0.4) | ||
| Arm circumference, cm | |||||
| Baseline | 30.3±2.9 | 30.2±2.4 | − | 0.426 | 24% |
| 12 months | 30.4±2.9 | 30.2±2.9 | −0.2 (−0.8 to 0.3) | ||
| 24 months | 31±2.9* | 31.6±2.6* | −0.4 (−1.5 to 0.6) | ||
| SBP z-score** | |||||
| Baseline | 0.3±1.0 | 0.6±1.2 | − | 0.088 | 50% |
| 12 months | 0.5±1.2 | 0.5±0.9 | −0.02 (−0.40 to 0.43) | ||
| 24 months | 1.2±1.5* | 0.8±0.7* | −0.19 (−0.70 to 0.33) | ||
| DBP z-score** | |||||
| Baseline | 0.3±0.8 | 0.3±0.7 | − | 0.897 | 40% |
| 12 months | 0.3±0.9 | 0.2±0.8 | −0.001 (−0.29 to 0.28) | ||
| 24 months | 0.6±1.0 | 0.6±0.9 | 0.01 (−0.36 to 0.39) |
Data expressed as mean±standard deviation or, in the case of differences, the mean and the corresponding 95% confidence interval. The regression models included values at 3 and 6 months of follow-up and were adjusted for confounding variables.
BMI, body mass index; CG, control group; DBP, diastolic blood pressure; ICC, intraclass correlation coefficient; IG, intervention group; SBP, systolic blood pressure.
Statistically significant difference (P<0.05) in the corresponding group between the given time point and baseline.
Blood pressure z-score calculated based on the blood pressure percentile table published by the National High Blood Pressure Education Program Working Group on High Blood Pressure in Children and Adolescents,40 for which we calculated height z-scores using the growth charts of the Centers for Disease Control and Prevention and the National Center for Health Statistics.41.
 during the follow-up. Data expressed as mean (standard deviation).")
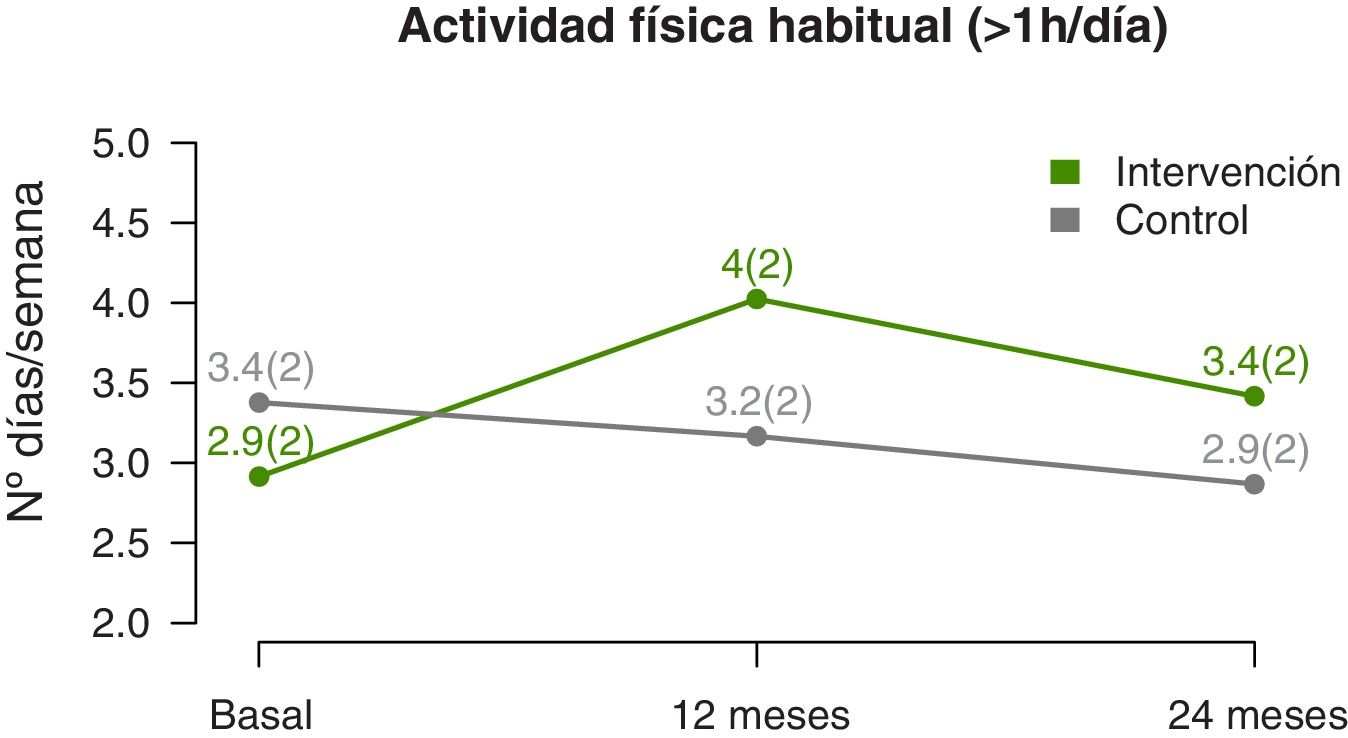
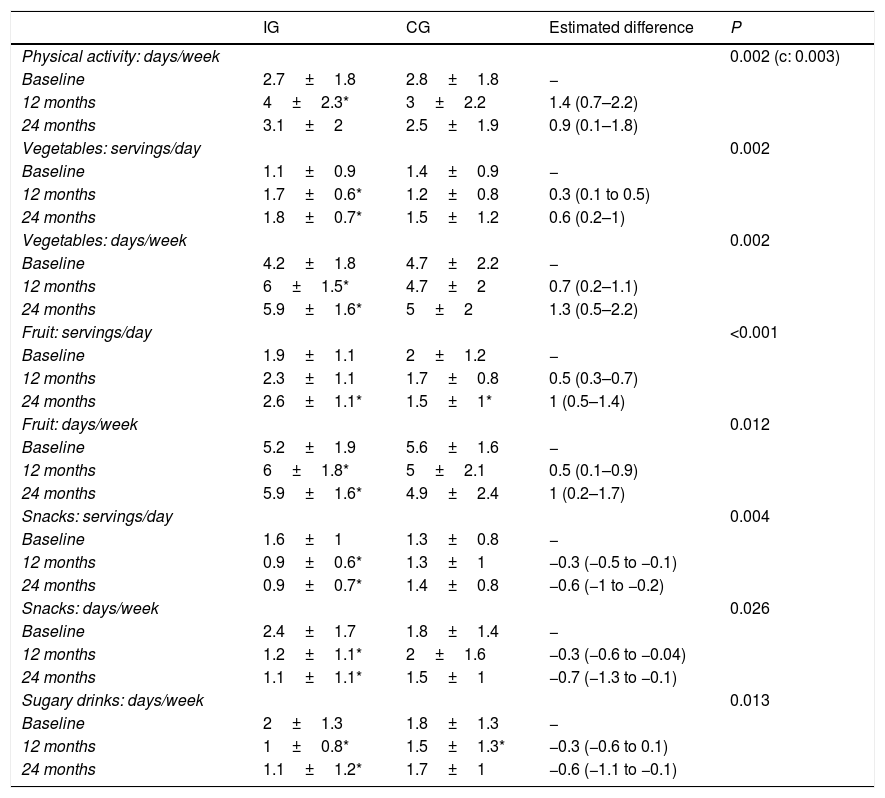
The temporal trends in physical activity showed that the mean number of days a week that participants engaged in at least 1h of physical activity increased significantly in the IG compared to the CG (linear model, P=0.002) (Fig. 4), a difference that was more marked at the midpoint of the follow-up compared to the end (quadratic fit, P=0.003) (Table 3). The estimated values at 12 months showed a difference of nearly 1.5 days a week with performance of physical activity in the IG compared to the CG.
.")
Changes in physical activity and dietary pattern during the follow-up and differences between the intervention group (n=47) and control group (n=45).
| IG | CG | Estimated difference | P | |
|---|---|---|---|---|
| Physical activity: days/week | 0.002 (c: 0.003) | |||
| Baseline | 2.7±1.8 | 2.8±1.8 | − | |
| 12 months | 4±2.3* | 3±2.2 | 1.4 (0.7–2.2) | |
| 24 months | 3.1±2 | 2.5±1.9 | 0.9 (0.1–1.8) | |
| Vegetables: servings/day | 0.002 | |||
| Baseline | 1.1±0.9 | 1.4±0.9 | − | |
| 12 months | 1.7±0.6* | 1.2±0.8 | 0.3 (0.1 to 0.5) | |
| 24 months | 1.8±0.7* | 1.5±1.2 | 0.6 (0.2–1) | |
| Vegetables: days/week | 0.002 | |||
| Baseline | 4.2±1.8 | 4.7±2.2 | − | |
| 12 months | 6±1.5* | 4.7±2 | 0.7 (0.2–1.1) | |
| 24 months | 5.9±1.6* | 5±2 | 1.3 (0.5–2.2) | |
| Fruit: servings/day | <0.001 | |||
| Baseline | 1.9±1.1 | 2±1.2 | − | |
| 12 months | 2.3±1.1 | 1.7±0.8 | 0.5 (0.3–0.7) | |
| 24 months | 2.6±1.1* | 1.5±1* | 1 (0.5–1.4) | |
| Fruit: days/week | 0.012 | |||
| Baseline | 5.2±1.9 | 5.6±1.6 | − | |
| 12 months | 6±1.8* | 5±2.1 | 0.5 (0.1–0.9) | |
| 24 months | 5.9±1.6* | 4.9±2.4 | 1 (0.2–1.7) | |
| Snacks: servings/day | 0.004 | |||
| Baseline | 1.6±1 | 1.3±0.8 | − | |
| 12 months | 0.9±0.6* | 1.3±1 | −0.3 (−0.5 to −0.1) | |
| 24 months | 0.9±0.7* | 1.4±0.8 | −0.6 (−1 to −0.2) | |
| Snacks: days/week | 0.026 | |||
| Baseline | 2.4±1.7 | 1.8±1.4 | − | |
| 12 months | 1.2±1.1* | 2±1.6 | −0.3 (−0.6 to −0.04) | |
| 24 months | 1.1±1.1* | 1.5±1 | −0.7 (−1.3 to −0.1) | |
| Sugary drinks: days/week | 0.013 | |||
| Baseline | 2±1.3 | 1.8±1.3 | − | |
| 12 months | 1±0.8* | 1.5±1.3* | −0.3 (−0.6 to 0.1) | |
| 24 months | 1.1±1.2* | 1.7±1 | −0.6 (−1.1 to −0.1) |
Data expressed as mean±standard deviation or, in the case of differences, the mean and the corresponding 95% confidence interval. The regression models included values at 3 and 6 months of follow-up and were adjusted for confounding variables.
c: quadratic fit P-value.
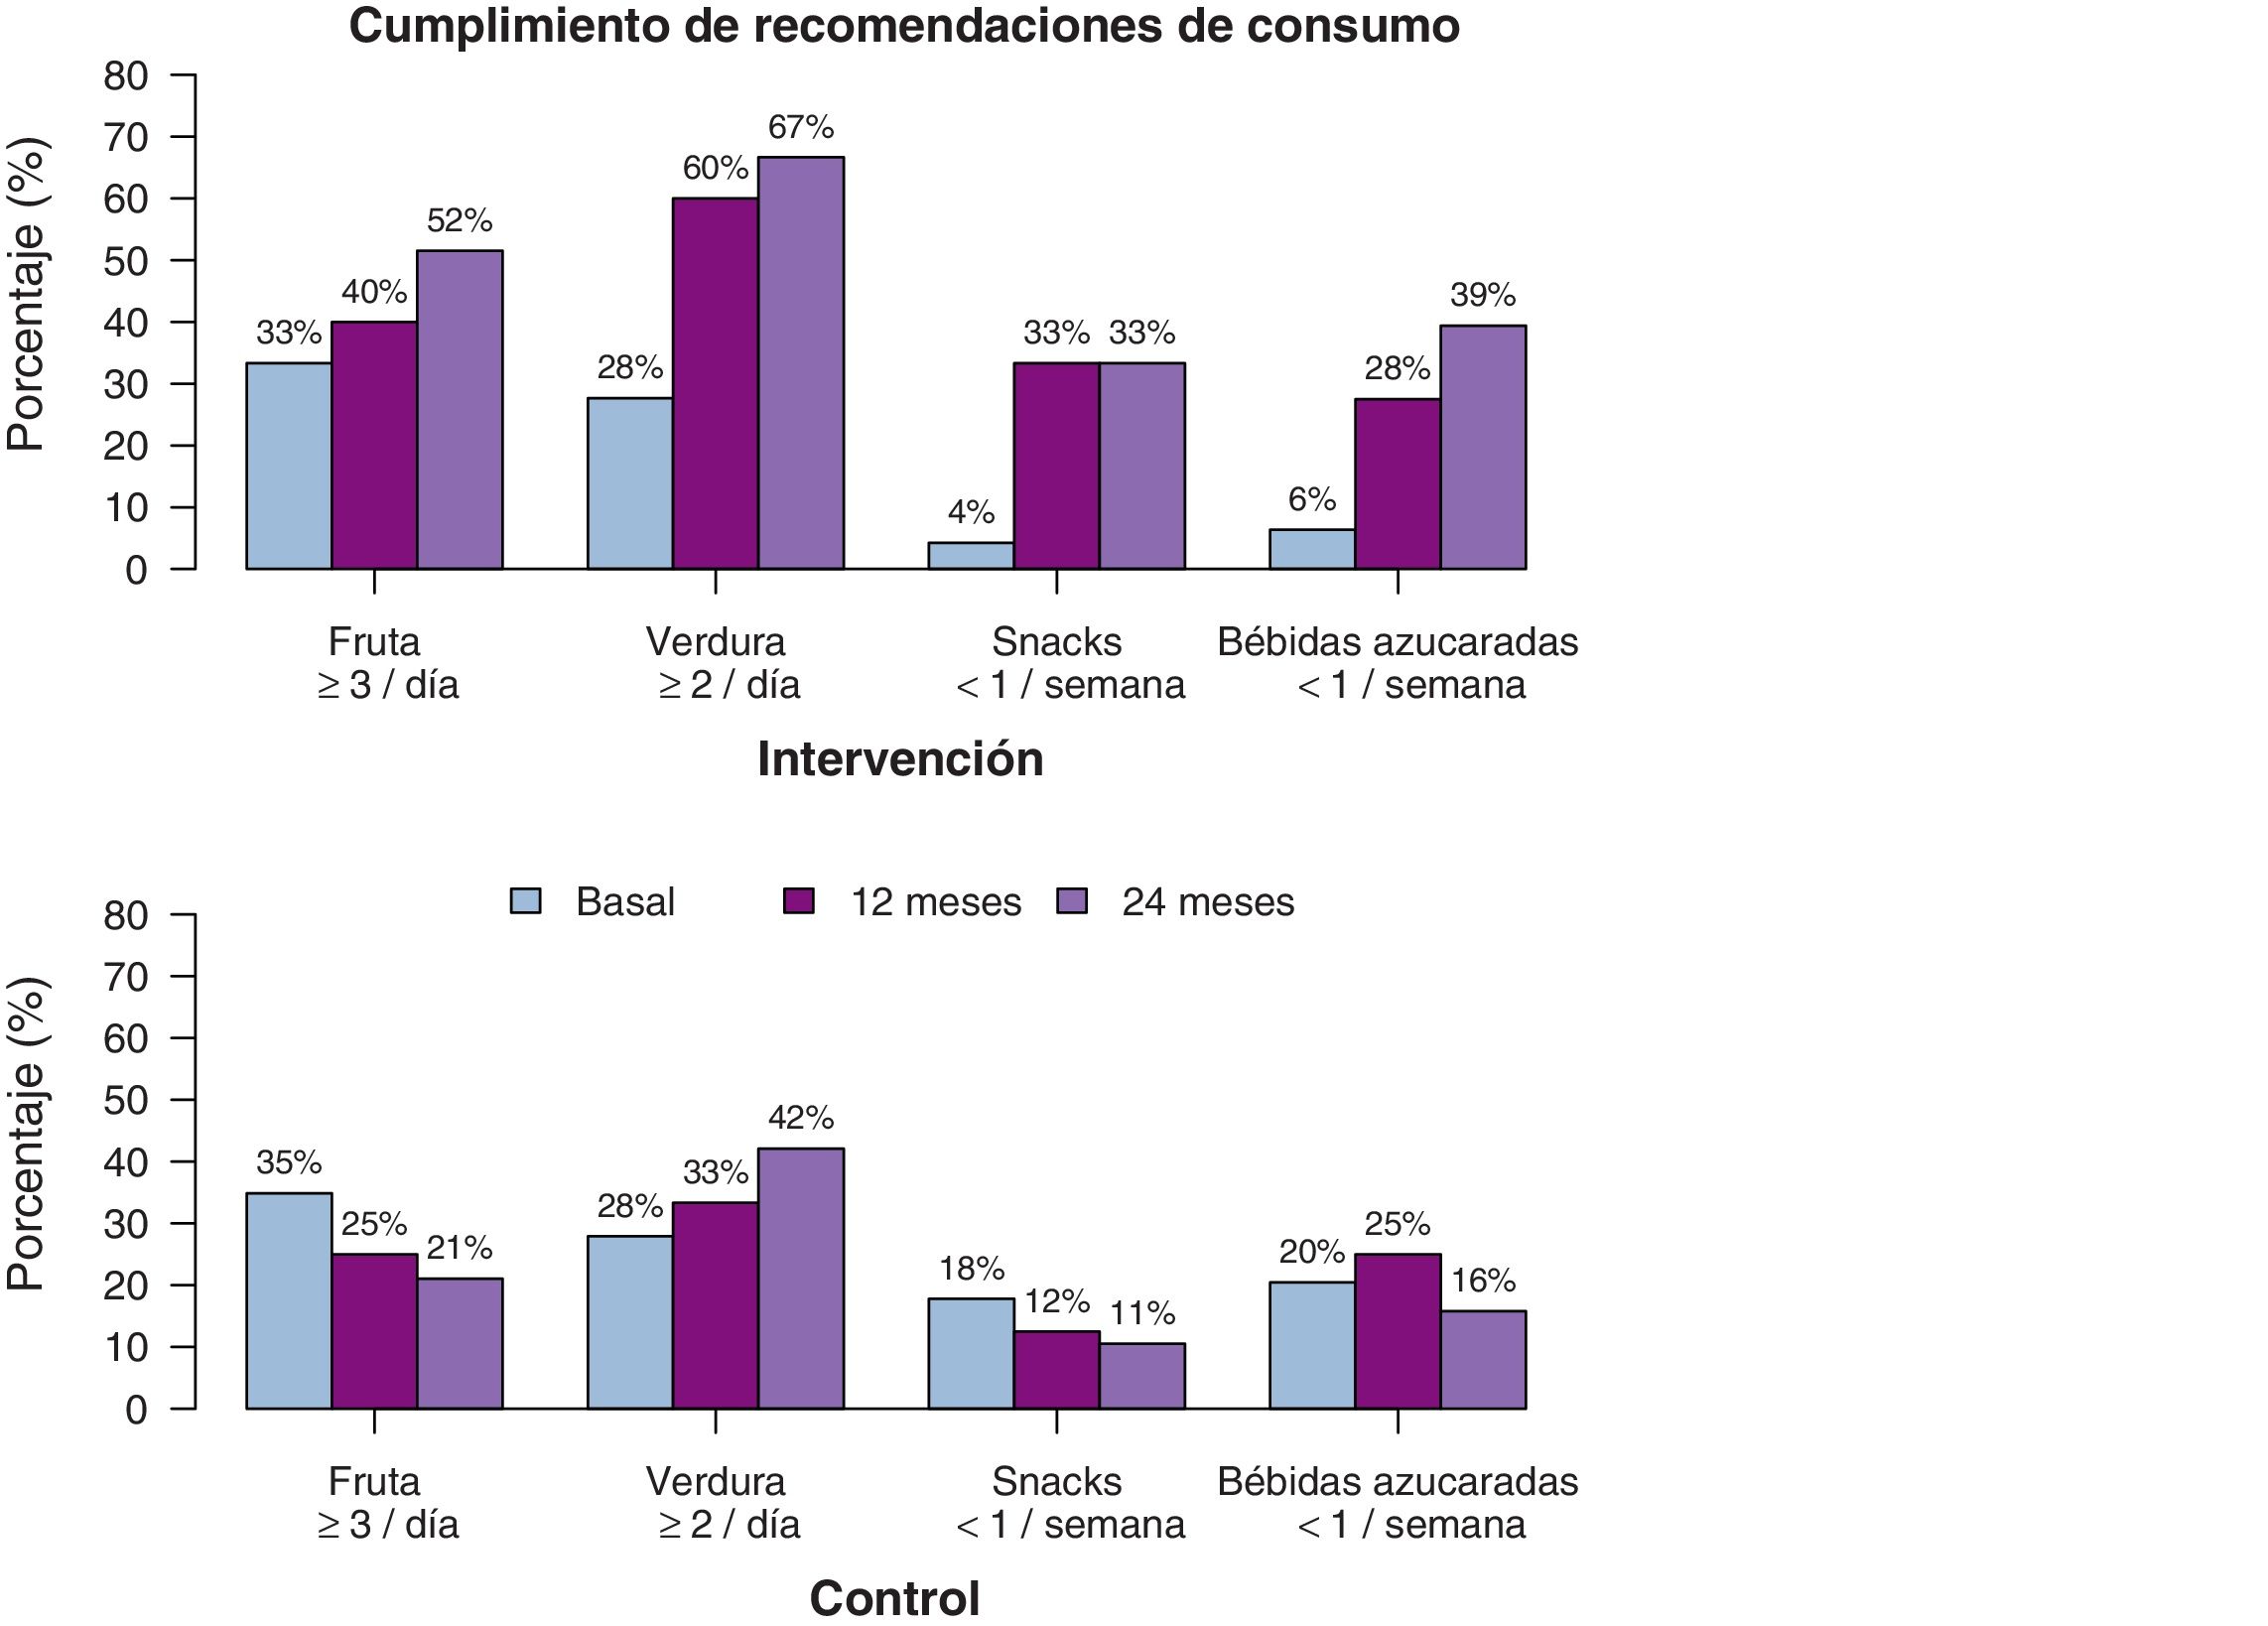
We also found differences in diet-related variables (Table 3), although in this case the difference was linear, without the quadratic effect, which suggests that the changes are maintained over time. The consumption of fruits and vegetables increased significantly in the IG both in terms of the servings per day and the number of days a week these foods were consumed. The estimated values at 2 years of follow-up suggested that participants in the IG consumed fruits and vegetables up to 1 more day a week compared to participants in the CG, in addition to one more serving of fruit and one half more serving of vegetables a day. When it came to foods the consumption of which was discouraged, we found a decrease in both the weekly and daily consumption of unhealthy snacks and sugary drinks, with an estimated difference between the IG and CG of more than half a serving a day at the 2-year timepoint. Fig. 5 shows the percentage of participants that adhered to dietary recommendations. We also analysed the overall effect on BMI trends of the changes in diet and physical activity, and found that changes in all variables were associated with a reduction of the BMI with similar coefficients, with the exception of the consumption of vegetables (P=0.485) and fruit (P=0.905).
Discussion
The European PRE-STARt study aims to address excess weight as the main risk factor for the development of T2D.
The conventional approach to the management of excess weight, which in our region is carried out by a single health care professional, a paediatrician or nurse, is based on the recommendation of diet changes and the promotion of physical activity, allocates little time to intervention, fails early and does not achieve favourable outcomes.23,28
To date, the strategies that have proven most effective in the management of excess weight are multidisciplinary and intensive interventions22,23,28 delivered by professionals with specific training and experience in the delivery of these programmes, which seek to achieve behavioural changes at the individual and family levels to improve physical and mental health. The intervention performed in this study adhered to current evidence-based recommendations regarding intervention at the family level.24
The data at the 2-year timepoint evince significant changes in the IG in BMI and BMI z-score compared to the CG. The intervention succeeding in halting the increase in BMI, given that there is a physiological increase in BMI in the age range of the participants.
Another important outcome concerns dietary patterns. In the IG, the consumption of fruits and vegetables increased and the consumption of sugary drinks and unhealthy snacks decreased compared to the CG. Some studies have found changes in BMI associated with partial diet modification,25 such as a decrease in BMI associated with a decreased consumption of sugary drinks.37 In our study, decreases in the consumption of snacks and of sugary drinks achieved significant and similar reductions in BMI, while the consumption of fruits and vegetables did not have the same impact, although they still offer well-known health benefits.38
Combined interventions that include dietary and physical activity measures achieve better outcomes compared to isolated interventions.25 When it comes to physical activity, the heterogeneity of the interventions and the methods used for assessment poses barriers to comparative analyses aiming to identify the most effective approach.39 In agreement with previous evidence, our study found significant changes in the IG compared to the CG in the number of days per week that participants engaged in at least 1h of vigorous physical activity.
A large proportion of studies on the subject highlight the poor adherence to treatment plans, and therefore the importance of specific and accredited training for the health care professionals that deliver these interventions.25 In our study, we found a low attrition rate in the IG compared to the CG during the 2-year follow-up, which is relevant considering that membership in the IG imposed greater demands and required considerable involvement of the family. We also found significant differences in BMI, diet and physical activity in Phase 1, and, more importantly, that these differences remained at the 2-year follow-up. This suggests that the achieved behavioural changes could be sustained in the future, which would be beneficial by reducing the impact of modifiable risk factors for T2D, especially in children that have non-modifiable risk factors from birth.
Another strength is that the recruitment of participants, the delivery of intervention and the assessments were performed in the primary care setting, unlike previous studies that involved community- and school-based interventions.25,33 This was possible due to the universal and free coverage offered by our regional public health system, which provides access to paediatric care to the entire population.
The main limitation of our study was the method used to recruit participants. Although participants were randomly allocated to groups, the choice to participate, especially given the intensive nature of the intervention, may have been a source of bias with overrepresentation of individuals motivated to change. However, the comparable characteristics of the intervention and control groups at baseline indicates a lack of selection bias. The losses to follow-up in the control group constituted another limitation, although in this case it is possible that the individuals that dropped out of the study were the ones that had the least favourable health outcomes. Also, since the sample was greater than the minimum size calculated for the study, a 50% attrition rate would correspond to a statistical power of 80%. Yet another limitation is that all participants in both the IG and CG were past the onset of puberty (Tanner stages 2–5), so our study cannot contribute any information regarding potential differences in the response to the intervention in prepubertal children. It would be interesting to analyse differences in outcomes in 2 groups (prepubertal and pubertal) on account of the potential impact of, on one hand, the younger age of the former and, on the other, the physical and psychological changes associated with puberty, when it comes to implementing an intensive multidisciplinary intervention.
We did not observe any adverse effects in the intervention group in terms of eating, mood or anxiety disorders.
ConclusionThe findings of the study confirm the effectiveness at 2 years of follow-up of a multidisciplinary programme, adapted to the sociocultural characteristics of our region, in the adolescents included in the intervention group, slowing the increase in BMI and improving dietary and physical activity habits, factors associated with the risk of developing metabolic diseases in the future, including T2D.
A programme of these characteristics is one of several possible strategies to fight obesity and sedentary lifestyles in the paediatric and young adult population and for prevention of metabolic diseases. Child obesity is currently one of the most serious global public health problems and it needs to be addressed through the development of preventive strategies and the identification of risk factors from birth, areas in which primary care paediatric teams play a crucial role.
FundingStudy funded by the European Commission through the Call for tender system (file no. SANCO/2013/C1/004).
Conflicts of interestThe authors have no conflicts of interest to declare.
We thank the Instituto de Investigación en Servicios de Salud Kronikgune, the Primary Care Research Unit of the Public Health System (Osakidetza) of Gipuzkoa, the primary care paediatric teams of the Osakidetza of Gipuzkoa, and all the adolescents and families that participated in the study.
Kronikgune: Olatz Albaina, Itziar Vergara, Maider Mateo-Abad, Irati Erreguerena, Sara Ponce, Ane Fullaondo, Esteban de Manuel Keenoy. Dietitians/nutritionists: Amaia Perales, Garbiñe Aizpuru. Primary care paediatricians-Osakidetza: Elena Alustiza, Irene Ozcoidi, Sara García, Carmen Solórzano, Sagrario Fuentes, Lourdes Aramburu, Carmen Gómez, María Teresa Labiano, Maite Callén, Esther Galicia, Begoña Peña, Pilar Aizpurua, Izaskun Miner, María José Caballero, Andrea Di Michele, Florencia Insua, Iratxe Fernández, Oihana Gómez, Elena Busselo, Maider Delgado, Inmaculada Merino, María José Reguilón, Lourdes Mancisidor, Victor Ormaetxea, Edorta Zapirain; Amagoia Andrés. Primary care nurses-Osakidetza: Elena Galardi, Ana Bueno.
Please cite this article as: Alustiza E, Perales A, Mateo-Abad M, Ozcoidi I, Aizpuru G, Albaina O, et al. Abordaje de factores de riesgo de diabetes tipo 2 enadolescentes: estudio PRE-STARt Euskadi. An Pediatr (Barc). 2021;95:186–196.
- Documento de manejo clínico del paciente pediátrico con infección por SARS-CoV-2.
(Actualizado el 26 de Noviembre de 2020) - Test de diagnóstico rápido en las consultas de Pediatría de Atención Primaria y Urgencias Pediátricas en la era COVID-19: más que una recomendación
(Actualizado el 21 de septiembre de 2020) - Consenso nacional sobre diagnóstico, estabilización y tratamiento del Síndrome Inflamatorio Multisistémico Pediátrico vinculado a SARS-CoV-2 (SIM-PedS).
(Actualizado el 27 de Julio de 2020) - Recomendaciones para el manejo del recién nacido en relación con la infección por SARS-CoV-2.
(Actualizado el 27 de Mayo de 2020) - Manejo del paciente pediátrico ante sospecha de infección por el nuevo coronavirus SARS-CoV-2 en atención primaria (COVID-19). AEPap-SEIP/AEP-SEPEAP.
(Actualizado el 27 de Abril de 2020) - Propuesta de adaptación de las recomendaciones de reanimación cardiopulmonar pediátrica avanzada a la infección por coronavirus.
(Actualizado el 11 de Abril de 2020)

articles

Anales de Pediatría (English Edition) follows the Recommendations for the Conduct, Reporting, Editing and Publication of Scholarly Work in Medical Journals