

To describe the prevalence of obesity and analyse possible differences in it according to sociodemographic characteristics, diet, physical activity, screen use and family perception of the weight and dietary habits of schoolchildren aged 3 to 4 years in Barcelona.
MethodsWe conducted a cross-sectional study in a representative sample of schools selected based on the socioeconomic status (SES) of the corresponding neighbourhood and school ownership. We selected 101 schools in Barcelona and recruited pupils aged 3 to 4 years during the 2016–17 academic year (n = 2936 children). Anthropometric measurements were taken in each participant. Family members completed a questionnaire on eating habits, physical activity, sleeping hours, screen use and the family’s perception of the child’s weight and diet. The primary variable was the body mass index (BMI) for age and sex, subsequently categorised as normal weight, overweight or obese.
ResultsApproximately 7.0% of girls and 7.1% of boys aged 3 to 4 years presented obesity. The prevalence of obesity (8.3%) was higher in neighbourhoods of lower SES compared to those of higher SES (5.2%; p = .004). Parents of children with obesity reported that the child had some excess weight or excess weight in 46.9% of cases, 3.9% indicated the child’s weight was appropriate and 0.9% that the child was a little underweight or underweight (p < .001).
DiscussionThe prevalence of obesity in children aged 3 to 4 years is high. There are social and geographical inequalities, and obesity was more prevalent in areas of lower SES. A large percentage of the families of children with obesity do not consider that the child’s weight is excessive.
Describir la prevalencia de obesidad y analizar posibles diferencias según características sociodemográficas, alimentación, actividad física, visionado de pantallas y percepción familiar sobre el peso y alimentación de sus hijos/as en escolares de 3 a 4 años de Barcelona.
MétodoEstudio transversal a una muestra representativa de escuelas según nivel socioeconómico (NSE) del barrio y titularidad. Se seleccionaron 101 escuelas de Barcelona y se reclutó al alumnado de 3 a 4 años en el curso 2016-17 (N = 2.936 niños/as). Se tomaron medidas antropométricas. Los familiares respondieron a un cuestionario de hábitos sobre alimentación, actividad física, horas de sueño, visionado de pantallas y percepción familiar sobre el peso y la alimentación de su hijo/a. La variable principal fue el Índice de Masa Corporal (IMC), calculado por edad y sexo, y categorizado en: normopeso, sobrepeso u obesidad.
ResultadosEl 7,0% de las niñas y el 7,1% de los niños de 3-4 años presentaron obesidad. En los distritos de NSE desfavorecido hubo mayor obesidad (8,3%) que en los más favorecidos (5,2%; p = 0,004). Los padres/madres de niños/as cuyo peso fue de obesidad declararon que el peso de su hijo/a era un poco excesivo o excesivo en un 46,9%, en un 3,9% indicaron que era adecuado y el 0,9% que era un poco bajo o bajo (p < 0,001).
DiscusiónLa prevalencia de obesidad en niños y niñas de 3 a 4 años es elevada. Existen desigualdades sociales siendo superior en áreas de NSE más desfavorecidas. Un elevado porcentaje de familias de niños/as con obesidad no consideran que el peso de sus hijos/as sea excesivo.

Obesity is a chronic, non-communicable, complex and multifactorial disease usually with onset in childhood and/or adolescence.1 In the past 25 to 30 years, the prevalence of obesity has increased significantly worldwide.2 According to the report of the Organization for Economic Cooperation and Development (OECD) for year 2019, Spain, is among the countries with the highest rates of childhood obesity in the world, ranking fourth in Europe.3 The nationwide Thao cohort study conducted in 2014 highlighted the problem of excess weight in Spain, as it found a prevalence of overweight of 20% in children aged 3 to 5 years.4 In 2017, more than 1 in 10 children (10.3% in the group aged 2 to 17 years) had obesity in Spain, with a similar prevalence in boys (10.2%) and girls (10.4%).5
The prevention of childhood obesity should begin in the early stages of life, and some experts even argue that the problem should be addressed from the period of gestation.6 The family plays a key role, so the main modifiable determinants of the risk factors for overweight and obesity in the first years of life concern the family milieu. Parents make decisions regarding food choices, meal structure and the dietary pattern in the home and contribute to shaping physical activity and sedentary habits in the child (especially screen use).7 Another factor to consider is socioeconomic status (SES). The prevalence of childhood obesity exhibits a heterogeneous distribution based on SES in societies at the global level. In developed countries, the prevalence of overweight and of obesity tends to be higher in socioeconomically disadvantaged groups.8
In addition, children of obese parents (mother, father or both) are at increased risk to develop obesity.9 One of the potential factors at play in childhood obesity is the inaccurate perception of parents of the severity of excess weight in their children. A nationwide study in children of both sexes with excess weight aged 3 to 16 years found that approximately two thirds of parents did not perceive the weight of their children as problematic. Furthermore, even if parents are aware of the overweight or obesity of their children,10 they may not make any changes to improve dietary, physical activity or screen use habits.11–13
Few studies have been conducted in Spain analysing the prevalence of childhood obesity in representative samples in children aged less than 6 years.14,15 In addition, knowledge on how families perceive their children’s weight and dietary habits is essential to be able to develop interventions at different levels with the ultimate goal of reducing the prevalence of childhood obesity at younger ages.16,17 The aim of our study was to describe the prevalence of obesity and analyse possible differences based on sociodemographic characteristics, diet, physical activity, screen use and how the family perceives the weight and the diet of children aged 3 to 4 years in Barcelona.
MethodsWe conducted a cross-sectional study in a representative sample based on the SES of the district where the early childhood education centre was located (socioeconomic [SE] advantage/disadvantage) and the type of centre (public/private or mixed [private centre receiving public funding]) in pupils aged 3 to 4 years in the city of Barcelona during academic year 2016–2017. In the framework of the project for the Prevention of Childhood Obesity in Barcelona in Early Childhood Education (known as POIBIN, for its acronym in Spanish),18 we selected 101 schools and selected the entire P3 class cohort (year 1 of early childhood education, starting from age 3 years: N = 3631 children born in 2013). The study adhered to the principles of the Declaration of Helsinki and was approved by the Clinical Research Ethics Committee of Parc de Salut Mar (file 2016/6711/I). Anthropometric measurements (weight and height) were obtained for 2936 pupils aged 3 to 4 years whose families provided informed consent to participation (81%). Of this total, 55% of families completed a questionnaire on dietary habits, physical activity, hours of sleep, screen use and perception in the family of the child’s weight and dietary intake. Thus, we obtained complete data for 1613 children, including the objective information collected through anthropometric measurement and the self-reported information provided by the parents regarding health care-related habits and beliefs.
The primary outcome of the study was the body mass index (BMI) z score for age and sex, using the World Health Organization (WHO) child growth standards for reference.19 We classified BMI values as normal weight, overweight (BMI z > 1) or obesity (BMI z > 2). The school-related variables were: socioeconomic level of the school district based on household disposable income data (HDI, data from 2016)20 categorised as SE advantage (HDI ≥ 85) vs SE disadvantage (HDI < 85) and the type of school based on ownership (public vs private/mixed). Through the self-report questionnaire, we collected data on sociodemographic variables, including the country of origin (Spain vs foreign country), the SES of the family based on the Family Affluence Scale (FAS)21 (categorised as high, medium or low) and educational attainment (recording the highest educational attainment in the household, categorised as university, secondary or primary education). We also collected data on the weight and height of the mother and father (as self-reported) and then categorised them as normal weight, overweight or obesity based on the WHO standards. The dietary habits and intake variables, based on current dietary recommendations, were the following: adequate breakfast including fruit, cereal and dairy; eating in the school canteen; screen use during supper; going to fast food restaurants; drinking water during meals; consumption of fruit and/or vegetables (≥ 5 servings a day); consumption of dairy (twice or more a day); consumption of meat (twice or fewer times a week); consumption of fish (≥ 3 times a week); consumption of sugary drinks (≤ 3 times a month); consumption of pastries/baked goods (≤ 3 times a month); consumption of sweets (≤ 3 times a month); all classified as yes/no. The variables used to assess physical activity, sleep duration and screen time were as follows: participation in extracurricular athletic activities (yes/no), performance of physical activity as a family (never or seldom, some or all weekends, some or nearly every day of the week), means of transport used to commute to and back from school (walking, public transport, car/motorcycle; bicycle), hours of sleep on school nights (< 10 hours vs ≥ 10 hours) screen time (< 2 hours vs ≥ 2 hours) on weekdays and on the weekend.22
The questionnaire also collected data regarding the perception by the family of the child’s weight and nutrition through 14 items taken from the Child Feeding Questionnaire.23 These items assess aspects concerning the perception of the child’s weight and beliefs regarding the imposition or restriction of dietary habits and eating behaviours in their children. For the purposes of this study, we grouped responses in 3 categories: strongly disagree or disagree, neither agree nor disagree, agree or strongly agree.
We conducted a descriptive bivariate analysis to assess the correlation between the objective BMI measure in the child and the independent study outcomes (n = 2936). We compared percentages by means of the χ2 test, calculating the corresponding 95% confidence intervals (significance: P < .05). In the case of variables related to nutrition (n = 1613, data from questionnaire completed by families), we calculated a global indicator that encompassed behavioural aspects (adequate breakfast including fruit, cereal and dairy; eating in the school canteen; screen use during supper and/or going to fast food restaurants) and aspects concerning adherence to dietary guidelines22 (drinking water during meals; consumption of fruit and/or vegetables; consumption of dairy; consumption of meat; consumption of fish; consumption of sugary drinks; consumption of pastries/baked goods; consumption of sweets). We analysed the prevalence of adherence to recommended habits, classified as inadequate (≤ 1 behaviour) vs adequate (> 1 behaviour) and adherence to recommended food intake frequency, classified as inadequate (appropriate for ≤ 2 recommendations) vs adequate (appropriate for > 2 recommendations). We set cut-off points at the intermediate value, both for habits and food frequency. The statistical analysis was performed with the statistical package Stata/SE, version 15.1.
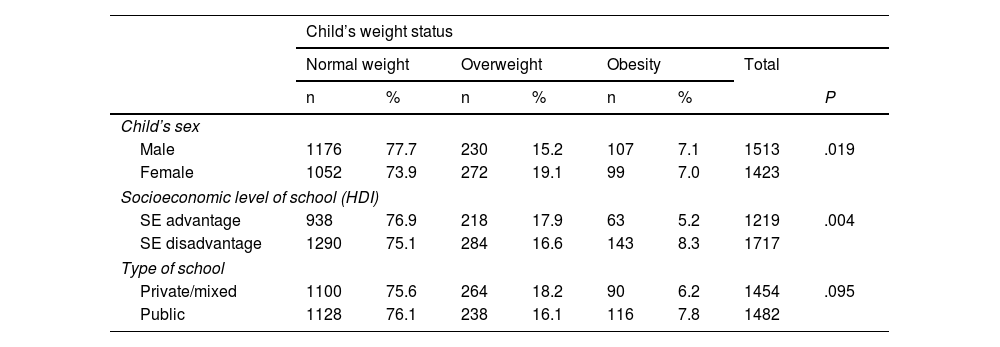
ResultsThe prevalence of obesity in children aged 3 to 4 years was 7.0% in girls and 7.1% in boys. There was a statistically significant difference in weight status based on sex (P = .019), with a greater prevalence of overweight in girls (19.1%) compared to boys (15.2%). In districts with a lower HDI, there was a higher prevalence of obesity compared to districts with a higher HDI (8.3% vs 5.2%; P = .004) (Table 1).
Distribution of weight category based on sex, socioeconomic level of school district and type of school (n = 2936). POIBIN, Barcelona (2017).
| Child’s weight status | ||||||||
|---|---|---|---|---|---|---|---|---|
| Normal weight | Overweight | Obesity | Total | |||||
| n | % | n | % | n | % | P | ||
| Child’s sex | ||||||||
| Male | 1176 | 77.7 | 230 | 15.2 | 107 | 7.1 | 1513 | .019 |
| Female | 1052 | 73.9 | 272 | 19.1 | 99 | 7.0 | 1423 | |
| Socioeconomic level of school (HDI) | ||||||||
| SE advantage | 938 | 76.9 | 218 | 17.9 | 63 | 5.2 | 1219 | .004 |
| SE disadvantage | 1290 | 75.1 | 284 | 16.6 | 143 | 8.3 | 1717 | |
| Type of school | ||||||||
| Private/mixed | 1100 | 75.6 | 264 | 18.2 | 90 | 6.2 | 1454 | .095 |
| Public | 1128 | 76.1 | 238 | 16.1 | 116 | 7.8 | 1482 | |
HDI, household disposable income; SE, socioeconomic.
Statistical significance set at P < .05.
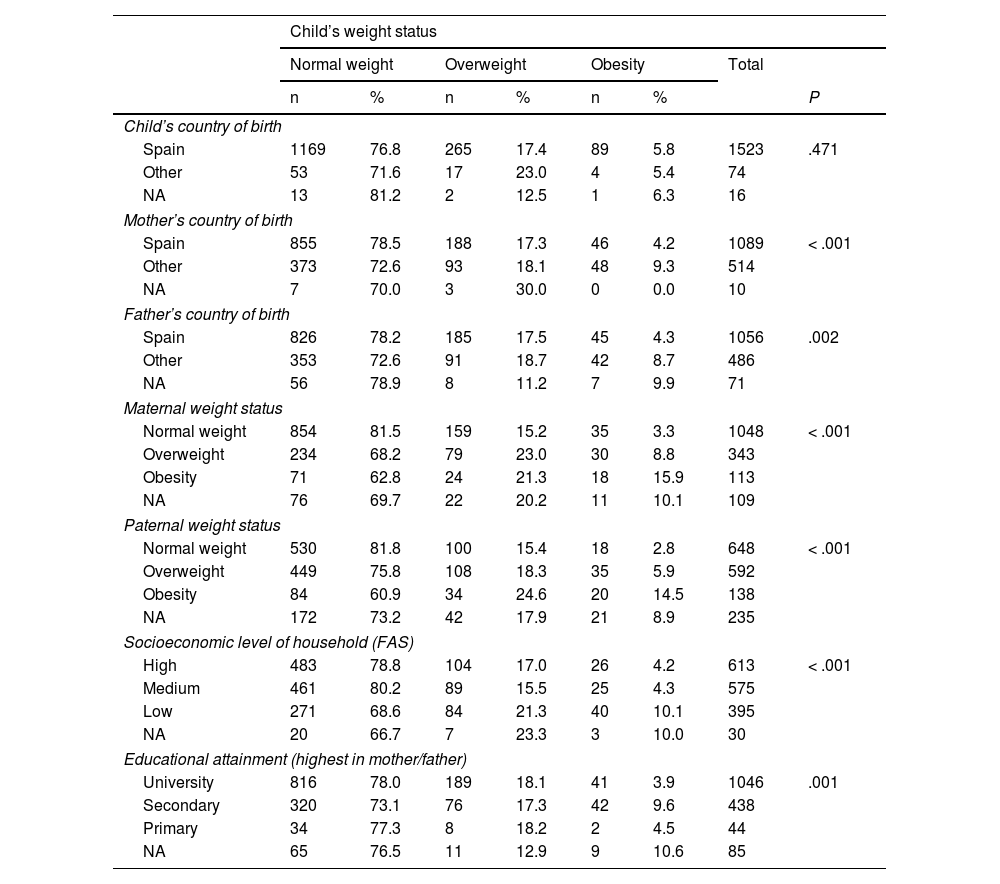
Table 2 presents the distribution of weight status in boys and girls based on sociodemographic variables. Children whose mother was born in a country other than Spain were more likely to be obese compared to those with mothers born in Spain, a difference that was statistically significant (9.3% vs 4.2%, p < .001). Of the mothers who reported being obese themselves, 15.9% had children with obesity; in the case of fathers with obesity, the proportion of children with obesity was 14.5%. In families with SE disadvantage, there was a higher percentage of children with overweight (21.3%) or obesity (10.1%) (p < .001).
Distribution of weight category based on sociodemographic characteristics. Data from self-report family questionnaire (n = 1613). POIBIN, Barcelona (2017).
| Child’s weight status | ||||||||
|---|---|---|---|---|---|---|---|---|
| Normal weight | Overweight | Obesity | Total | |||||
| n | % | n | % | n | % | P | ||
| Child’s country of birth | ||||||||
| Spain | 1169 | 76.8 | 265 | 17.4 | 89 | 5.8 | 1523 | .471 |
| Other | 53 | 71.6 | 17 | 23.0 | 4 | 5.4 | 74 | |
| NA | 13 | 81.2 | 2 | 12.5 | 1 | 6.3 | 16 | |
| Mother’s country of birth | ||||||||
| Spain | 855 | 78.5 | 188 | 17.3 | 46 | 4.2 | 1089 | < .001 |
| Other | 373 | 72.6 | 93 | 18.1 | 48 | 9.3 | 514 | |
| NA | 7 | 70.0 | 3 | 30.0 | 0 | 0.0 | 10 | |
| Father’s country of birth | ||||||||
| Spain | 826 | 78.2 | 185 | 17.5 | 45 | 4.3 | 1056 | .002 |
| Other | 353 | 72.6 | 91 | 18.7 | 42 | 8.7 | 486 | |
| NA | 56 | 78.9 | 8 | 11.2 | 7 | 9.9 | 71 | |
| Maternal weight status | ||||||||
| Normal weight | 854 | 81.5 | 159 | 15.2 | 35 | 3.3 | 1048 | < .001 |
| Overweight | 234 | 68.2 | 79 | 23.0 | 30 | 8.8 | 343 | |
| Obesity | 71 | 62.8 | 24 | 21.3 | 18 | 15.9 | 113 | |
| NA | 76 | 69.7 | 22 | 20.2 | 11 | 10.1 | 109 | |
| Paternal weight status | ||||||||
| Normal weight | 530 | 81.8 | 100 | 15.4 | 18 | 2.8 | 648 | < .001 |
| Overweight | 449 | 75.8 | 108 | 18.3 | 35 | 5.9 | 592 | |
| Obesity | 84 | 60.9 | 34 | 24.6 | 20 | 14.5 | 138 | |
| NA | 172 | 73.2 | 42 | 17.9 | 21 | 8.9 | 235 | |
| Socioeconomic level of household (FAS) | ||||||||
| High | 483 | 78.8 | 104 | 17.0 | 26 | 4.2 | 613 | < .001 |
| Medium | 461 | 80.2 | 89 | 15.5 | 25 | 4.3 | 575 | |
| Low | 271 | 68.6 | 84 | 21.3 | 40 | 10.1 | 395 | |
| NA | 20 | 66.7 | 7 | 23.3 | 3 | 10.0 | 30 | |
| Educational attainment (highest in mother/father) | ||||||||
| University | 816 | 78.0 | 189 | 18.1 | 41 | 3.9 | 1046 | .001 |
| Secondary | 320 | 73.1 | 76 | 17.3 | 42 | 9.6 | 438 | |
| Primary | 34 | 77.3 | 8 | 18.2 | 2 | 4.5 | 44 | |
| NA | 65 | 76.5 | 11 | 12.9 | 9 | 10.6 | 85 | |
NA, no answer FAS, Family Affluence Scale.
P value calculated with self-reported data in the subset of the sample that answered the item (excluding unanswered items [NA]). Statistical significance set at P < .05.
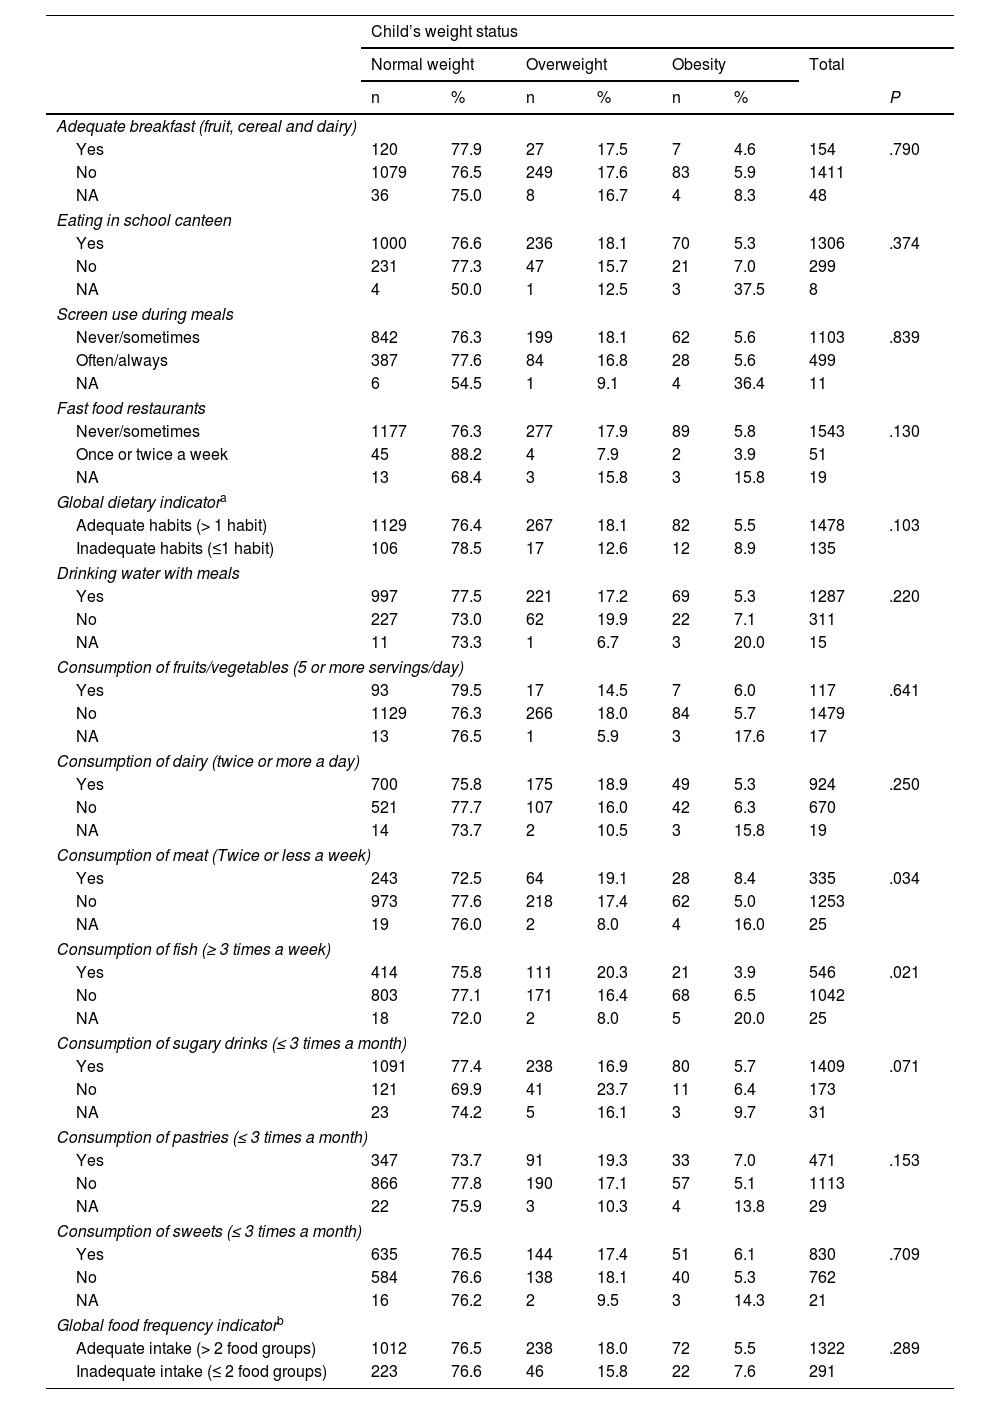
Table 3 presents data on eating behaviours and food group intake frequency. We found a statistically significant difference in the intake of fish, with a higher prevalence of obesity among children who consumed less fish than recommended (P = .021). On the other hand, when it came to the consumption of meat, the prevalence of obesity was greater in children who consumed the amount recommended (8.4%) compared to children who did not adhere to meat intake recommendations (5.0%). We did not find significant differences in any other eating behaviours or dietary habits based on weight status categories.
Distribution of weight category based on eating behaviours and food intake frequency (n = 1613). POIBIN, Barcelona (2017).
| Child’s weight status | ||||||||
|---|---|---|---|---|---|---|---|---|
| Normal weight | Overweight | Obesity | Total | |||||
| n | % | n | % | n | % | P | ||
| Adequate breakfast (fruit, cereal and dairy) | ||||||||
| Yes | 120 | 77.9 | 27 | 17.5 | 7 | 4.6 | 154 | .790 |
| No | 1079 | 76.5 | 249 | 17.6 | 83 | 5.9 | 1411 | |
| NA | 36 | 75.0 | 8 | 16.7 | 4 | 8.3 | 48 | |
| Eating in school canteen | ||||||||
| Yes | 1000 | 76.6 | 236 | 18.1 | 70 | 5.3 | 1306 | .374 |
| No | 231 | 77.3 | 47 | 15.7 | 21 | 7.0 | 299 | |
| NA | 4 | 50.0 | 1 | 12.5 | 3 | 37.5 | 8 | |
| Screen use during meals | ||||||||
| Never/sometimes | 842 | 76.3 | 199 | 18.1 | 62 | 5.6 | 1103 | .839 |
| Often/always | 387 | 77.6 | 84 | 16.8 | 28 | 5.6 | 499 | |
| NA | 6 | 54.5 | 1 | 9.1 | 4 | 36.4 | 11 | |
| Fast food restaurants | ||||||||
| Never/sometimes | 1177 | 76.3 | 277 | 17.9 | 89 | 5.8 | 1543 | .130 |
| Once or twice a week | 45 | 88.2 | 4 | 7.9 | 2 | 3.9 | 51 | |
| NA | 13 | 68.4 | 3 | 15.8 | 3 | 15.8 | 19 | |
| Global dietary indicatora | ||||||||
| Adequate habits (> 1 habit) | 1129 | 76.4 | 267 | 18.1 | 82 | 5.5 | 1478 | .103 |
| Inadequate habits (≤1 habit) | 106 | 78.5 | 17 | 12.6 | 12 | 8.9 | 135 | |
| Drinking water with meals | ||||||||
| Yes | 997 | 77.5 | 221 | 17.2 | 69 | 5.3 | 1287 | .220 |
| No | 227 | 73.0 | 62 | 19.9 | 22 | 7.1 | 311 | |
| NA | 11 | 73.3 | 1 | 6.7 | 3 | 20.0 | 15 | |
| Consumption of fruits/vegetables (5 or more servings/day) | ||||||||
| Yes | 93 | 79.5 | 17 | 14.5 | 7 | 6.0 | 117 | .641 |
| No | 1129 | 76.3 | 266 | 18.0 | 84 | 5.7 | 1479 | |
| NA | 13 | 76.5 | 1 | 5.9 | 3 | 17.6 | 17 | |
| Consumption of dairy (twice or more a day) | ||||||||
| Yes | 700 | 75.8 | 175 | 18.9 | 49 | 5.3 | 924 | .250 |
| No | 521 | 77.7 | 107 | 16.0 | 42 | 6.3 | 670 | |
| NA | 14 | 73.7 | 2 | 10.5 | 3 | 15.8 | 19 | |
| Consumption of meat (Twice or less a week) | ||||||||
| Yes | 243 | 72.5 | 64 | 19.1 | 28 | 8.4 | 335 | .034 |
| No | 973 | 77.6 | 218 | 17.4 | 62 | 5.0 | 1253 | |
| NA | 19 | 76.0 | 2 | 8.0 | 4 | 16.0 | 25 | |
| Consumption of fish (≥ 3 times a week) | ||||||||
| Yes | 414 | 75.8 | 111 | 20.3 | 21 | 3.9 | 546 | .021 |
| No | 803 | 77.1 | 171 | 16.4 | 68 | 6.5 | 1042 | |
| NA | 18 | 72.0 | 2 | 8.0 | 5 | 20.0 | 25 | |
| Consumption of sugary drinks (≤ 3 times a month) | ||||||||
| Yes | 1091 | 77.4 | 238 | 16.9 | 80 | 5.7 | 1409 | .071 |
| No | 121 | 69.9 | 41 | 23.7 | 11 | 6.4 | 173 | |
| NA | 23 | 74.2 | 5 | 16.1 | 3 | 9.7 | 31 | |
| Consumption of pastries (≤ 3 times a month) | ||||||||
| Yes | 347 | 73.7 | 91 | 19.3 | 33 | 7.0 | 471 | .153 |
| No | 866 | 77.8 | 190 | 17.1 | 57 | 5.1 | 1113 | |
| NA | 22 | 75.9 | 3 | 10.3 | 4 | 13.8 | 29 | |
| Consumption of sweets (≤ 3 times a month) | ||||||||
| Yes | 635 | 76.5 | 144 | 17.4 | 51 | 6.1 | 830 | .709 |
| No | 584 | 76.6 | 138 | 18.1 | 40 | 5.3 | 762 | |
| NA | 16 | 76.2 | 2 | 9.5 | 3 | 14.3 | 21 | |
| Global food frequency indicatorb | ||||||||
| Adequate intake (> 2 food groups) | 1012 | 76.5 | 238 | 18.0 | 72 | 5.5 | 1322 | .289 |
| Inadequate intake (≤ 2 food groups) | 223 | 76.6 | 46 | 15.8 | 22 | 7.6 | 291 | |
P value calculated with self-reported data in the subset of the sample that answered the item (excluding unanswered items [NA]). Statistical significance set at P < .05.
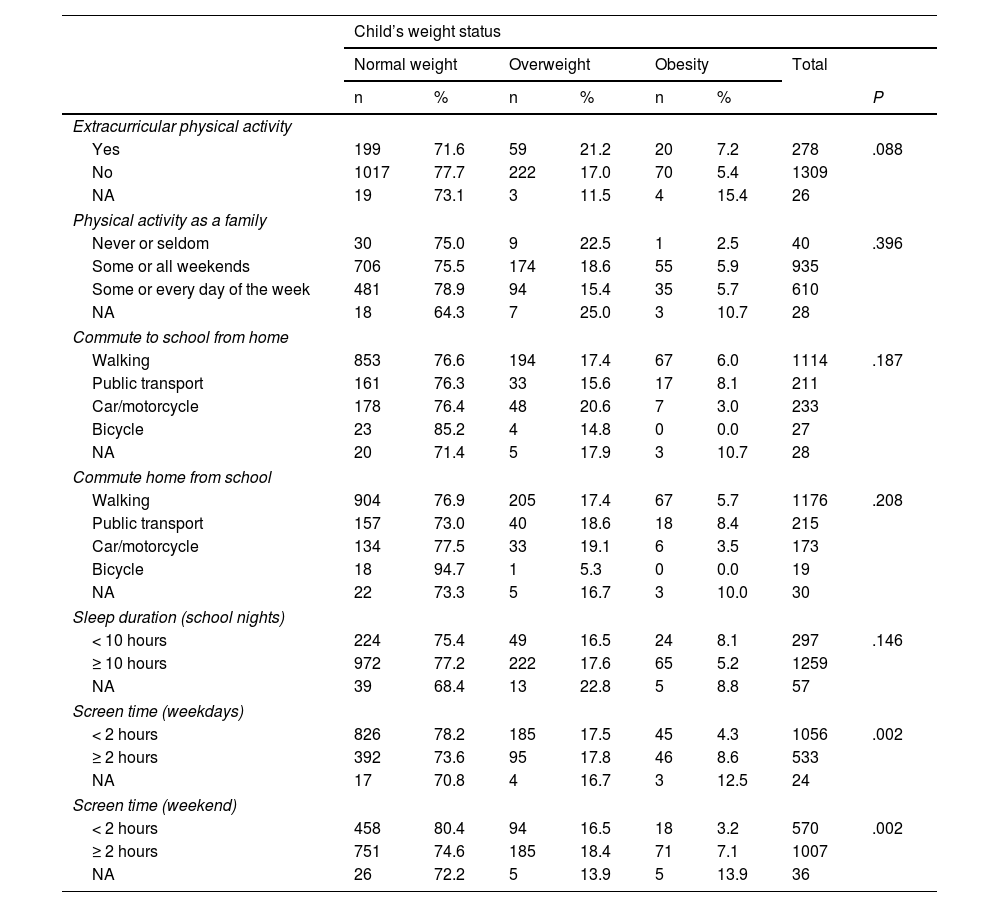
As can be seen in Table 4, the proportion of children with obesity was lesser among children with screen times of less than 2 hours a day compared to children with screen times of 2 hours or greater on weekdays (4.3% vs 8.6%) or on weekends (3.2% vs 7.1%), differences that were statistically significant.
Distribution of weight category based on physical activity, hours of sleep and screen time (n = 1613). POIBIN, Barcelona (2017).
| Child’s weight status | ||||||||
|---|---|---|---|---|---|---|---|---|
| Normal weight | Overweight | Obesity | Total | |||||
| n | % | n | % | n | % | P | ||
| Extracurricular physical activity | ||||||||
| Yes | 199 | 71.6 | 59 | 21.2 | 20 | 7.2 | 278 | .088 |
| No | 1017 | 77.7 | 222 | 17.0 | 70 | 5.4 | 1309 | |
| NA | 19 | 73.1 | 3 | 11.5 | 4 | 15.4 | 26 | |
| Physical activity as a family | ||||||||
| Never or seldom | 30 | 75.0 | 9 | 22.5 | 1 | 2.5 | 40 | .396 |
| Some or all weekends | 706 | 75.5 | 174 | 18.6 | 55 | 5.9 | 935 | |
| Some or every day of the week | 481 | 78.9 | 94 | 15.4 | 35 | 5.7 | 610 | |
| NA | 18 | 64.3 | 7 | 25.0 | 3 | 10.7 | 28 | |
| Commute to school from home | ||||||||
| Walking | 853 | 76.6 | 194 | 17.4 | 67 | 6.0 | 1114 | .187 |
| Public transport | 161 | 76.3 | 33 | 15.6 | 17 | 8.1 | 211 | |
| Car/motorcycle | 178 | 76.4 | 48 | 20.6 | 7 | 3.0 | 233 | |
| Bicycle | 23 | 85.2 | 4 | 14.8 | 0 | 0.0 | 27 | |
| NA | 20 | 71.4 | 5 | 17.9 | 3 | 10.7 | 28 | |
| Commute home from school | ||||||||
| Walking | 904 | 76.9 | 205 | 17.4 | 67 | 5.7 | 1176 | .208 |
| Public transport | 157 | 73.0 | 40 | 18.6 | 18 | 8.4 | 215 | |
| Car/motorcycle | 134 | 77.5 | 33 | 19.1 | 6 | 3.5 | 173 | |
| Bicycle | 18 | 94.7 | 1 | 5.3 | 0 | 0.0 | 19 | |
| NA | 22 | 73.3 | 5 | 16.7 | 3 | 10.0 | 30 | |
| Sleep duration (school nights) | ||||||||
| < 10 hours | 224 | 75.4 | 49 | 16.5 | 24 | 8.1 | 297 | .146 |
| ≥ 10 hours | 972 | 77.2 | 222 | 17.6 | 65 | 5.2 | 1259 | |
| NA | 39 | 68.4 | 13 | 22.8 | 5 | 8.8 | 57 | |
| Screen time (weekdays) | ||||||||
| < 2 hours | 826 | 78.2 | 185 | 17.5 | 45 | 4.3 | 1056 | .002 |
| ≥ 2 hours | 392 | 73.6 | 95 | 17.8 | 46 | 8.6 | 533 | |
| NA | 17 | 70.8 | 4 | 16.7 | 3 | 12.5 | 24 | |
| Screen time (weekend) | ||||||||
| < 2 hours | 458 | 80.4 | 94 | 16.5 | 18 | 3.2 | 570 | .002 |
| ≥ 2 hours | 751 | 74.6 | 185 | 18.4 | 71 | 7.1 | 1007 | |
| NA | 26 | 72.2 | 5 | 13.9 | 5 | 13.9 | 36 | |
P value calculated with self-reported data in the subset of the sample that answered the item (excluding unanswered items [NA]). Statistical significance set at P < .05.
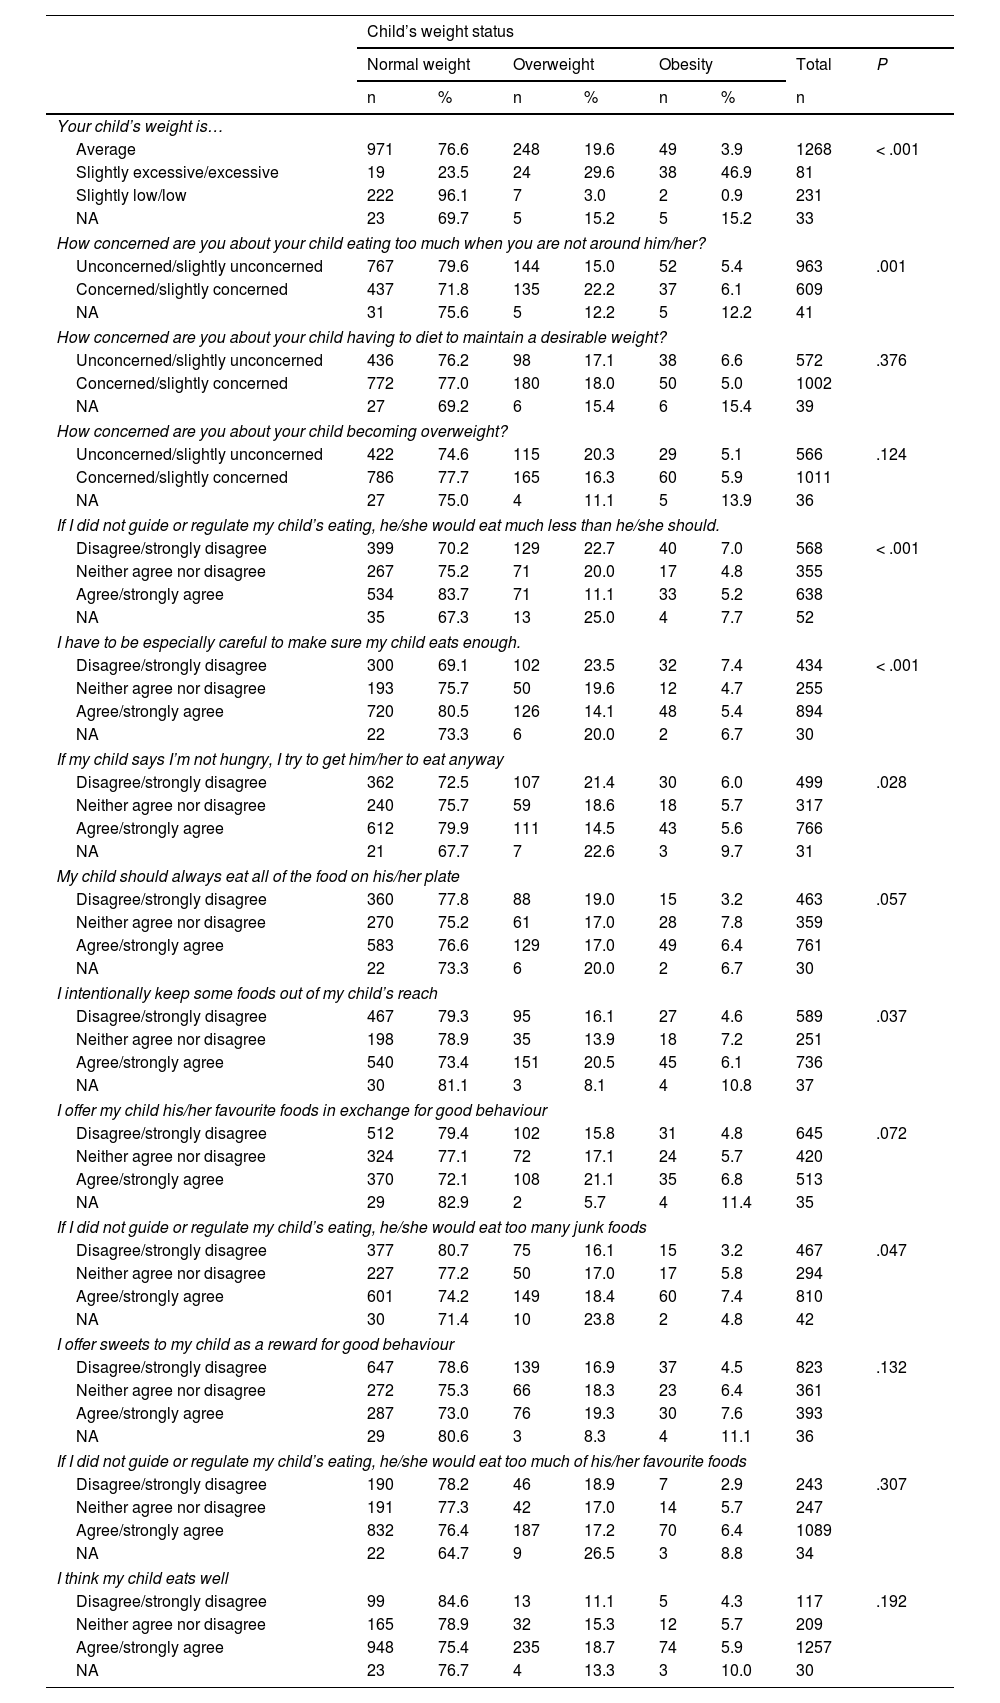
Table 5 summarises the data on the perception of families about the child’s weight and eating by child weight status. Of the parents whose children’s weight was in the obesity range, 46.9% reported that their child’s weight was slightly excessive or excessive, 3.9% that their weight was average and 0.9%, that their weight was slightly low or low (P < .001). When it came to parental control of the child’s diet, 5.2% of the parents of children with obesity agreed with the statement “If I did not guide or regulate my child’s eating, he/she would eat much less than he/she should”, while 7.0% disagreed. Furthermore, 5.4% of parents of children with obesity agreed with the statement “I have to be especially careful to make sure my child eats enough” while 7.4% disagreed (P < .001). As regards restricting intake, 7.4% of parents of children with obesity expressed agreement with the statement “If I did not guide or regulate my child’s eating, he/she would eat too many junk foods”, while 3.2% expressed disagreement (P = .047).
Distribution of weight category based on perception of family of the child’s weight and diet (n = 1613). POIBIN, Barcelona (2017).
| Child’s weight status | ||||||||
|---|---|---|---|---|---|---|---|---|
| Normal weight | Overweight | Obesity | Total | P | ||||
| n | % | n | % | n | % | n | ||
| Your child’s weight is… | ||||||||
| Average | 971 | 76.6 | 248 | 19.6 | 49 | 3.9 | 1268 | < .001 |
| Slightly excessive/excessive | 19 | 23.5 | 24 | 29.6 | 38 | 46.9 | 81 | |
| Slightly low/low | 222 | 96.1 | 7 | 3.0 | 2 | 0.9 | 231 | |
| NA | 23 | 69.7 | 5 | 15.2 | 5 | 15.2 | 33 | |
| How concerned are you about your child eating too much when you are not around him/her? | ||||||||
| Unconcerned/slightly unconcerned | 767 | 79.6 | 144 | 15.0 | 52 | 5.4 | 963 | .001 |
| Concerned/slightly concerned | 437 | 71.8 | 135 | 22.2 | 37 | 6.1 | 609 | |
| NA | 31 | 75.6 | 5 | 12.2 | 5 | 12.2 | 41 | |
| How concerned are you about your child having to diet to maintain a desirable weight? | ||||||||
| Unconcerned/slightly unconcerned | 436 | 76.2 | 98 | 17.1 | 38 | 6.6 | 572 | .376 |
| Concerned/slightly concerned | 772 | 77.0 | 180 | 18.0 | 50 | 5.0 | 1002 | |
| NA | 27 | 69.2 | 6 | 15.4 | 6 | 15.4 | 39 | |
| How concerned are you about your child becoming overweight? | ||||||||
| Unconcerned/slightly unconcerned | 422 | 74.6 | 115 | 20.3 | 29 | 5.1 | 566 | .124 |
| Concerned/slightly concerned | 786 | 77.7 | 165 | 16.3 | 60 | 5.9 | 1011 | |
| NA | 27 | 75.0 | 4 | 11.1 | 5 | 13.9 | 36 | |
| If I did not guide or regulate my child’s eating, he/she would eat much less than he/she should. | ||||||||
| Disagree/strongly disagree | 399 | 70.2 | 129 | 22.7 | 40 | 7.0 | 568 | < .001 |
| Neither agree nor disagree | 267 | 75.2 | 71 | 20.0 | 17 | 4.8 | 355 | |
| Agree/strongly agree | 534 | 83.7 | 71 | 11.1 | 33 | 5.2 | 638 | |
| NA | 35 | 67.3 | 13 | 25.0 | 4 | 7.7 | 52 | |
| I have to be especially careful to make sure my child eats enough. | ||||||||
| Disagree/strongly disagree | 300 | 69.1 | 102 | 23.5 | 32 | 7.4 | 434 | < .001 |
| Neither agree nor disagree | 193 | 75.7 | 50 | 19.6 | 12 | 4.7 | 255 | |
| Agree/strongly agree | 720 | 80.5 | 126 | 14.1 | 48 | 5.4 | 894 | |
| NA | 22 | 73.3 | 6 | 20.0 | 2 | 6.7 | 30 | |
| If my child says I’m not hungry, I try to get him/her to eat anyway | ||||||||
| Disagree/strongly disagree | 362 | 72.5 | 107 | 21.4 | 30 | 6.0 | 499 | .028 |
| Neither agree nor disagree | 240 | 75.7 | 59 | 18.6 | 18 | 5.7 | 317 | |
| Agree/strongly agree | 612 | 79.9 | 111 | 14.5 | 43 | 5.6 | 766 | |
| NA | 21 | 67.7 | 7 | 22.6 | 3 | 9.7 | 31 | |
| My child should always eat all of the food on his/her plate | ||||||||
| Disagree/strongly disagree | 360 | 77.8 | 88 | 19.0 | 15 | 3.2 | 463 | .057 |
| Neither agree nor disagree | 270 | 75.2 | 61 | 17.0 | 28 | 7.8 | 359 | |
| Agree/strongly agree | 583 | 76.6 | 129 | 17.0 | 49 | 6.4 | 761 | |
| NA | 22 | 73.3 | 6 | 20.0 | 2 | 6.7 | 30 | |
| I intentionally keep some foods out of my child’s reach | ||||||||
| Disagree/strongly disagree | 467 | 79.3 | 95 | 16.1 | 27 | 4.6 | 589 | .037 |
| Neither agree nor disagree | 198 | 78.9 | 35 | 13.9 | 18 | 7.2 | 251 | |
| Agree/strongly agree | 540 | 73.4 | 151 | 20.5 | 45 | 6.1 | 736 | |
| NA | 30 | 81.1 | 3 | 8.1 | 4 | 10.8 | 37 | |
| I offer my child his/her favourite foods in exchange for good behaviour | ||||||||
| Disagree/strongly disagree | 512 | 79.4 | 102 | 15.8 | 31 | 4.8 | 645 | .072 |
| Neither agree nor disagree | 324 | 77.1 | 72 | 17.1 | 24 | 5.7 | 420 | |
| Agree/strongly agree | 370 | 72.1 | 108 | 21.1 | 35 | 6.8 | 513 | |
| NA | 29 | 82.9 | 2 | 5.7 | 4 | 11.4 | 35 | |
| If I did not guide or regulate my child’s eating, he/she would eat too many junk foods | ||||||||
| Disagree/strongly disagree | 377 | 80.7 | 75 | 16.1 | 15 | 3.2 | 467 | .047 |
| Neither agree nor disagree | 227 | 77.2 | 50 | 17.0 | 17 | 5.8 | 294 | |
| Agree/strongly agree | 601 | 74.2 | 149 | 18.4 | 60 | 7.4 | 810 | |
| NA | 30 | 71.4 | 10 | 23.8 | 2 | 4.8 | 42 | |
| I offer sweets to my child as a reward for good behaviour | ||||||||
| Disagree/strongly disagree | 647 | 78.6 | 139 | 16.9 | 37 | 4.5 | 823 | .132 |
| Neither agree nor disagree | 272 | 75.3 | 66 | 18.3 | 23 | 6.4 | 361 | |
| Agree/strongly agree | 287 | 73.0 | 76 | 19.3 | 30 | 7.6 | 393 | |
| NA | 29 | 80.6 | 3 | 8.3 | 4 | 11.1 | 36 | |
| If I did not guide or regulate my child’s eating, he/she would eat too much of his/her favourite foods | ||||||||
| Disagree/strongly disagree | 190 | 78.2 | 46 | 18.9 | 7 | 2.9 | 243 | .307 |
| Neither agree nor disagree | 191 | 77.3 | 42 | 17.0 | 14 | 5.7 | 247 | |
| Agree/strongly agree | 832 | 76.4 | 187 | 17.2 | 70 | 6.4 | 1089 | |
| NA | 22 | 64.7 | 9 | 26.5 | 3 | 8.8 | 34 | |
| I think my child eats well | ||||||||
| Disagree/strongly disagree | 99 | 84.6 | 13 | 11.1 | 5 | 4.3 | 117 | .192 |
| Neither agree nor disagree | 165 | 78.9 | 32 | 15.3 | 12 | 5.7 | 209 | |
| Agree/strongly agree | 948 | 75.4 | 235 | 18.7 | 74 | 5.9 | 1257 | |
| NA | 23 | 76.7 | 4 | 13.3 | 3 | 10.0 | 30 | |
NA, no answer.
Data from self-report family questionnaire (n = 1613).
P value calculated with self-reported data in the subset of the sample that answered the item (excluding unanswered items [NA]). Statistical significance set at P < .05.
Our study found a prevalence of obesity of 7% in children aged 3 to 4 years in the city of Barcelona, with a higher prevalence in schools in neighbourhoods with lower SES. In families of children with obesity, there was a greater proportion of parental obesity, of parents of foreign origin, of low SES and of a maximum household educational attainment of secondary or primary education. When it came to dietary habits, a greater prevalence of obesity was associated with a fish intake below recommendations. In addition, a screen time of 2 hours a day or greater was also associated with a higher prevalence of obesity. When it came to the perception of families, nearly half of families of children with obesity perceived that the weight of their children was slightly excessive or excessive.
The prevalence of childhood obesity observed in our study had increased compared to previously reported data in this age group.4 This increasing in the frequency of childhood obesity is consistent with the reports of the national health survey of Spain, which have shown a progressive increase in the prevalence of childhood obesity between 2003 and 2017.5 Few studies offer data on the prevalence of obesity in children under 5 years.14,15,24 In our study, we found a high prevalence of obesity in early childhood.2,25
In general, countries with a higher prevalence of childhood obesity are those in which there is greater social inequality.26 In our study, we found that more disadvantaged areas had a higher prevalence of childhood obesity. Thus, factors like parental foreign origin (mother and/or father), low household SES or a highest educational attainment of primary or secondary school in the parents were associated with a greater proportion of excess weight in the children, as previously described in the domestic and international literature.27,28
Our study identified inadequate dietary habits in young children that are associated with weight problems. Nine in ten children did not have an adequate breakfast. A breakfast including dairy, fruit and cereal is a key factor that contributes to a healthy diet.29 The literature shows that the consumption of healthy foods in school is associated with a decreased prevalence of obesity and overweight. In agreement with these findings, the results of our study were similar to those of the ALADINO study conducted in Spain in 2011,30 in which the meals offered by schools adhered to Spanish dietary guidelines for healthy nutrition. This suggests that adherence to dietary recommendations may be associated with a reduction in the frequency of obesity and overweight in the preschoolers and schoolchildren. Other analysed aspects, such as using screens during mealtimes or consuming fast food, are associated with an increased risk of weight problems.31 However, our study did not yield evidence of these associations. We ought to highlight that there is little evidence of a direct association between the prevalence of obesity in the age group under study and the exposure to fast food restaurants. In our study, we found significant differences in the consumption of meat and fish. Specifically, we found that consumption of fish seemed to have a protective effect while the results for meat were contradictory. We found an increased prevalence of obesity in children who consumed meat with appropriate frequency.22 A possible explanation is that even if the frequency of meat intake adhered to recommendations, other components of the diet could be unhealthy or foods could be eaten in excessive amounts.32–34
The WHO recommends moderate consumption of red meat due to its association with chronic degenerative diseases found in epidemiological studies.35
As regards screen use, the increasing trend in screen time has led to a decrease in the time devoted to healthier activities. According to the WHO guidelines, screen time (television, mobile phones, computers, gaming consoles etc.) should not exceed 2 hours a day.36 The data showed that a high percentage of children of either sex aged 3 to 4 years spent more than 2 hours using screens on weekdays (1 in 3) and weekends (2 in 3). In our study, we found that the prevalence of obesity doubled in children with screen times greater than 2 hours. The use of screens is associated with a decrease in the time spent resting and/or engaging in physical activity.37
The findings of our study were consistent with those of the previous literature, as most parents of children with obesity underestimated the weight of their children.38 Similarly, a study conducted in Portugal between 2013 and 2014 identified different factors associated with the frequency of underestimating weight status in families based on the weight status of the child. Families were more likely to underestimate weight in children of either sex who were overweight.39
The limitations of the study included those intrinsic to cross-sectional designs, which preclude the establishment of causality. Another limitation was the collection of data through a self-report questionnaire, which carries a risk of information bias.
Among the strengths of the study, we should highlight that it is the first to collect data on childhood overweight and obesity in very young children for the city of Barcelona. The sample size was large enough to estimate the population prevalence of overweight and obesity. Lastly, we collected information on how families perceived the weight of their children in a representative sample in the city of Barcelona.
In conclusion, the prevalence of obesity is very high in children of both sexes aged 3 to 4 years, and there are social and geographical inequalities, with a higher prevalence in socioeconomically disadvantaged areas. In addition, the sociodemographic characteristics of the household, parental nutritional status and screen time were determinants associated with weight in children.
FundingThis research did not receive any external funding.
Conflicts of interestThe authors have no conflicts of interest to declare.
