

To design a risk map (RM) as a tool for identifying and managing risks in the paediatric emergency department and to assess the impact of the improvement actions developed based on the identified risks in terms of the level of risk to patient safety.
MethodologyA multidisciplinary working group reviewed the entire care process by applying the Failure Mode and Effects Analysis (FMEA) tool. Project phases: (1) RM 2017 and planning of improvement actions; (2) Development and implementation of improvement actions; (3) RM 2019; (4) Analysis: evolution of the RM and impact of improvement actions.
ResultsA total of 106 failure modes (FMs) were identified in the 2017 RM (54.7% high- or very high risk). We applied prioritization criteria to select the improvement actions to plan. Nineteen improvement actions were planned, with assigned responsible parties and deadlines, to address 46 priority FMs. One hundred percent were implemented. In the 2019 RM, we identified 110 FMs (48.2% high risk) and found an overall reduction of the risk level of 20%. Analysing the 46 priority FMs that had been addressed by the 19 planned improvement actions, we found that 60% had changed from high to medium risk level and that the risk level had decreased, both overall (–27.8%) and by process.
ConclusionThe FMEA is a useful tool to identify risks, analyse the impact of improvement strategies and monitor the risk level of a complex clinical care department. The improvement actions developed succeeded in reducing the level of risk in the processes in our unit, improving patient safety.
Diseñar un Mapa de Riesgos (MR) como herramienta para identificar y gestionar los riesgos en Urgencias Pediátricas y analizar el impacto de las acciones de mejora desarrolladas a partir de los riesgos identificados, en el nivel de riesgo para la Seguridad del Paciente (SP).
MetodologíaUn grupo de trabajo multidisciplinar revisó todo el proceso asistencial aplicando la herramienta AMFE (“Análisis Modal Fallos y Efectos”). Fases del proyecto: 1ª) MR 2017 y planificación acciones de mejora; 2ª) Desarrollo e implantación de acciones de mejora; 3ª) MR 2019; 4ª) Análisis: evolución del MR e impacto de las acciones de mejora.
ResultadosEn el MR 2017 se identificaron 106 modos de fallo (MF) (54,7% riesgo alto o muy alto). Se aplicaron criterios de priorización para seleccionar las acciones de mejora que debían planificarse. Se planificaron 19 acciones de mejora, con responsables y plazos, que permitían abordar 46 MF prioritarios. Se implantaron el 100%. En el MR 2019 se identificaron 110 MF (48.2% riesgo alto) y se objetivó una reducción global del nivel de riesgo del 20%. Analizando los 46 MF prioritarios que se habían abordado mediante las 19 acciones de mejora planificadas, se comprobó que el 60% habían pasado de nivel de riesgo alto a medio y que se había reducido el nivel de riesgo tanto a nivel global (−27.8%) como desglosado por procesos.
ConclusiónEl AMFE es una herramienta útil para identificar riesgos, analizar el impacto de las estrategias de mejora y monitorizar el nivel de riesgo de un servicio clínico complejo. Las acciones de mejora desarrolladas han logrado reducir el nivel de riesgo de nuestros procesos, mejorando la SP.
Patient safety (PS) (Supplemental material: Appendix B1, Abbreviations) must be prioritised by health care organizations that seek excellence in care. Today, establishing strategies to guarantee PS through the implementation of risk management plans and safe practices aimed at preventing adverse events (AEs) is considered a duty.1
The Study of Health Care-Related Adverse Events in Emergency Departments in Spanish Hospitals (EVADUR),2 sponsored by the Sociedad Española de Medicina de Urgencias y Emergencias (Spanish Society of Emergency Medicine and Urgent Care, SEMES) provided a perspective of PS in hospital emergency departments (HEDs) throughout Spain. Based on its results, 12% of patients managed in HEDs experienced at least 1 AE, and 70% of experienced AEs were preventable.
The particular characteristics of HEDs (diversity and complexity of health care processes, concurrent care of a number of patients with no defined limit presenting with illnesses of varying nature and complexity that may have underlying disease and usually not known to the care team, time constraints, scarcity of clinical information for decision-making, working conditions and organizational aspects) make them one of the care settings where PS is most at risk.1,3–5
On the other hand, paediatric patients have particular characteristics that make them more vulnerable to AEs, such as age-related variations in vital signs, anatomical, physiological or developmental characteristics of each age group, or body weight-based medication dosing.5
Since 2014, our paediatric emergency department (PED) operates within an integrated quality and risk management system for patient safety, certified as adhering to official Spanish standards UNE-EN-ISO-9001:2015 and UNE-179003. Our risk management system is based on two complementary strategies: reactive management of voluntarily reported events through a systems-based methodology focused on the development of barriers to prevent recurrence of the event, and proactive management with analysis of risks and the potential or observed harm to patients in the care delivery process,1,6,7 identifying critical points for PS with the aim of anticipating problems and developing and implementing safe practices to minimise the probability of an AE.
The risk map (RM) is a proactive tool that, through descriptive data and appropriate indicators, allows the periodic evaluation of the risks in a system and to assess the effectiveness of developed interventions once they are implemented.1 The safety representatives of the unit had previous experience in the development of RMs and had applied Failure Mode and Effects Analysis (FMEA)8 at a small scale to review some subprocesses with the multidisciplinary participation of professionals working in other departments (“Online prescription” with the Pharmacy Department and “Urgent microbiological testing” with the Microbiology Department).
The objectives of our project were to identify and manage the risks in the PED of a tertiary care hospital through the development of a RM, and to assess the impact on PS of the implemented improvement actions.
MethodsTo design the RM, we used FMEA applied to the PED Process Map (Supplemental Material, Appendix B2). We reviewed all operational processes by asking three questions:
- •
What could fail? Failure modes (FMs) or risks to PS.
- •
What impact could the failure have on the patient? Effects.
- •
What could cause this failure? Root causes (Contributory factors classification framework of the National Patient Safety Agency9).
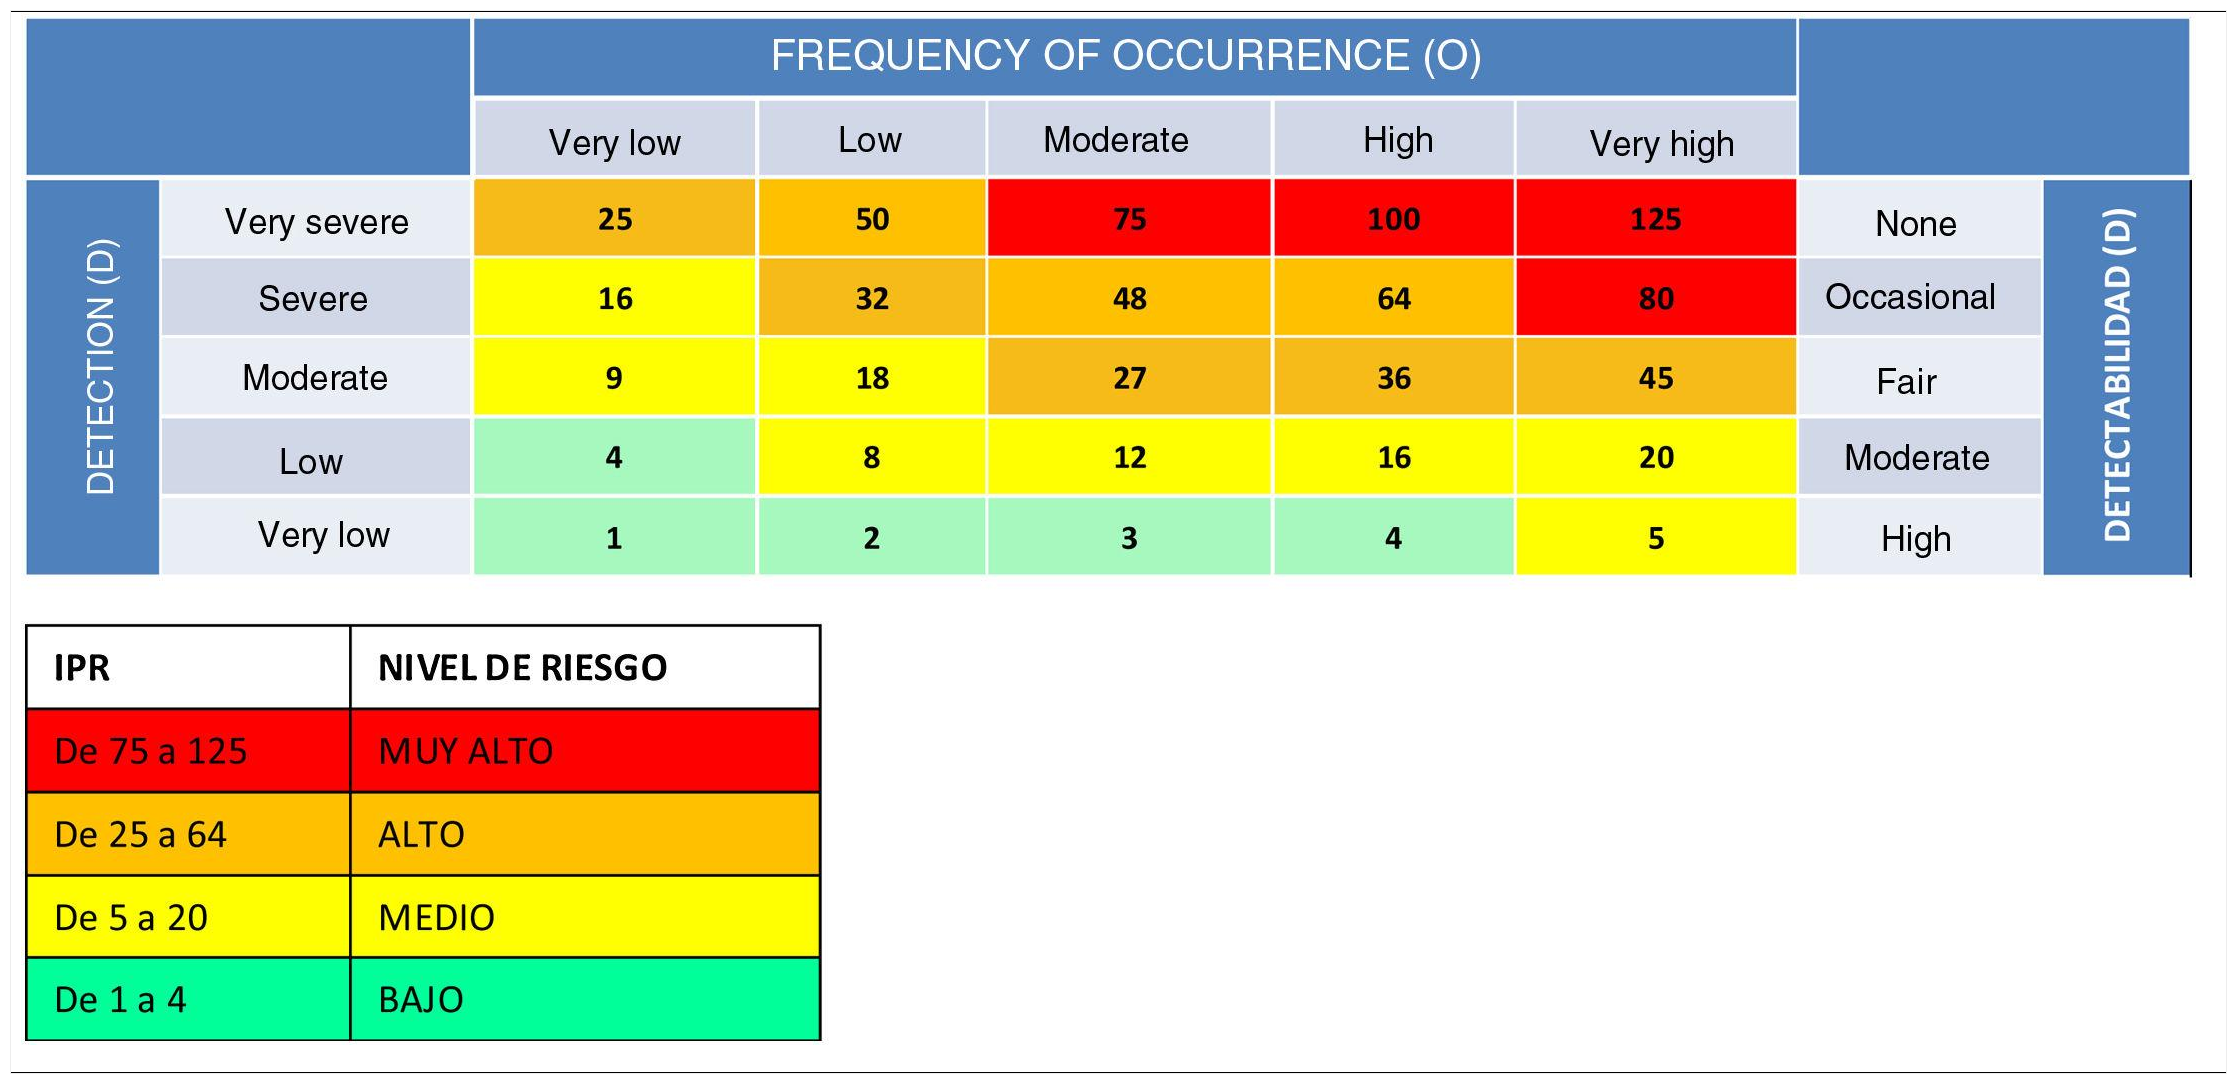
Subsequently, we rated each of the identified FMs by grading their severity (S), frequency of occurrence (O) and ease of detection (D) on a scale of 1–5 (Table 1). Using these scores, we calculated the risk priority number (RPN = S × O × D), a value that allows a theoretical estimation of the level of risk associated with each FM (Table 2), in order to prioritise the management of risks with the greatest impact on patient safety.
Criteria for assigning severity (S), frequency of occurrence (O) and ease of detection (D) scores. Adopted from the internal proactive risk management protocol document (code GP-HGM-01).
| Severity: What is the probability that the failure mode will have an impact on the patient and produce serious harm? | ||
|---|---|---|
| Very severe | Critical failure mode that affects the safety of the product or the process with irreversible effects on system performance and organization outcomes. Health care-related catastrophic (death) or permanent severe harm (loss of limb, permanent physical lesion or organ injury) | 5 |
| Severe | Failure mode that may have a very serious impact on the safety of the product or process, with effects that severely compromise system performance and organization outcomes. Severe non-permanent health care-related harm (need of intensive care or surgery) | 4 |
| Moderate severity | Failure mode with a moderately important impact on the safety of the product or process, with effects that could compromise system performance and organization outcomes. Moderate health care-related harm (need of additional treatment, need of additional nonsurgical procedure, significant increase in length of stay) | 3 |
| Low severity | Failure mode with an impact that is irrelevant to the safety of the product or process and that would not significantly affect system performance and organization outcomes. Mild health care-related harm that could nevertheless need observation or follow-up. | 2 |
| Very low severity | Failure mode of little importance, not expected to have any real impact on system performance and organization outcomes. It does not cause health care-related harm. | 1 |
| Frequency of occurrence: what is the likelihood that the failure will occur? | ||
|---|---|---|
| Very high | Nearly inevitable failure. Weekly frequency (routinely, once or twice a week) | 5 |
| High | Very probable failure. Monthly frequency (some instances every month) | 4 |
| Moderate | Probable failure. Occurrence every three or six months (several times a year) | 3 |
| Low | Occasional failure. Annual frequency (sometime in the past 3 years) | 2 |
| Very low | Isolated failure. Frequency: has occurred sometime in the history of the facility | 1 |
| Ease of detection: what is the likelihood that the failure can be detected before reaching the patient? | ||
|---|---|---|
| None | The failure cannot be detected before it has an effect and will almost certainly reach the patient | 5 |
| Occasional | The failure is such that it is difficult to detect with established procedure before it has an effect | 4 |
| Fair | The failure is detectable, possibly in the late stages of the process, but in some cases escapes control measures and produces an adverse event. It is not always detected before it causes an effect | 3 |
| Moderate | The failure, while obvious and easily detectable, could on occasion escape initial control measures, although it would be detected nearly always in the last stages of the process before it has an effect | 2 |
| High | The failure is obvious. It is very unlikely that it will not be detected by existing control measures and remedied before it causes an adverse event in the patient | 1 |
Formation of a multidisciplinary working group of physicians and nursing staff including safety representatives, quality assurance representatives and consultants of the risk management operations unit.
Development of the 2017 Risk Map. The process map of the unit was reviewed using the FMEA approach, and all the information was recorded in a form created with Excel (Supplemental material, Appendix B3: Risk matrix). The following sources of information were used to identify FMs:
- •
Brainstorming, analysis and consensus of participants
- •
Review of incidents reported through the safety incidents and medication error online notification platform of the Community of Madrid (CISEMadrid) or safety briefings.10
- •
Previous experiences (electronic prescription and urgent microbiological testing risk maps).
- •
Assessment of user experience (complaints, perceived quality surveys and focus groups11).
The members of the working group assigned S, O and D scores by consensus. Lastly, the RPN of each FM was calculated, and FMs were classified according to the level of risk (Table 2). The classification in 4 levels of risk based on the RPN was adopted from the proactive risk management protocol of the hospital (code GP-HGM-01), a document developed inhouse by the Risk Management Operations Unit.
Planning of improvement actions (IAs) for FMs considered a priority due to their level of risk (very high or high). Criteria were established to prioritize the implementation of IAs: risk priority number (RPN), potential impact of the IA in the overall reduction of risk (some IAs address several FMs simultaneously), congruence with the strategic plans of the institution and feasibility (available resources).
Phase 2. Development and implementation of improvement actionsFor each IA, a responsible individual was appointed and deadlines established for implementation, which was followed up at regular intervals as established by the quality and risk management system of the unit.
Phase 3. 2019 Risk MapDevelopment of the 2019 RM. The same working group that had developed the 2017 RM gathered in 2019 to update it using the same methodology and taking into account that the introduction of new information and technology applications (paediatric triage [TRIPED-GM], electronic health record [HCIS] and electronic prescription [FARHOS] systems) had brought changes to some operational processes that could result in new FMs.
Phase 4. Analysis of changes in the RMComparison of FMs identified in 2017 and 2019: distribution by process, risk stratification, and risk level, overall and by process.
Verification of the implementation of planned IAs (based on 2017 RM).
Analysis of the impact of implemented IAs on the level of risk to patient safety.
Presentation of resultsWe expressed categorical variables as absolute frequencies and percentages.
For each RM (2017 and 2019), we described the number of FMs identified, overall and by process, and the stratification of risk (absolute frequency and proportion of FMs classified into each level of risk). We estimated the risk, overall and by process, by calculating the total sum and median of RPN scores assigned to each identified FM.
To assess the impact of IAs, we specifically analysed those FMs addressed through the planned and implemented IAs, comparing the risk stratification profile and calculating the relative reduction in the level of risk (summation of RPNs for each FM, overall and by process).
ResultsTable 3 shows the count of FMs, overall and by process, and the level of risk, overall and by process, in the 2017 and 2019 RMs. In 2017, 106 FM were identified, of which 54.7% (58) were classified as high risk (57) or very high risk (1) (Table 4). Managing this volume of risks was not feasible, so it was necessary to apply the prioritization criteria described in the methods section to plan improvement strategies. Finally, 19 IAs were planned (Table 5) to address 46 FM prioritised on account of their risk level. In 2019, 110 FMs were identified, of which 48.2% (53) were classified as high risk (Table 4).
Comparisons of 2017 and 2019 risk maps: number of risks and level of risk (median RPN), overall and by process.
| Process | Number of failure modes | Risk level (RPN summation) | Risk level (Median RPN) | ||||||
|---|---|---|---|---|---|---|---|---|---|
| 2017 | 2019 | 2017 | 2019 | 2017 | 2019 | ||||
| Registration-triage | 9 | 10 | +11.1% | 243 | 262 | +7.8% | 20 | 24 | +20.0% |
| Life-threatening emergency management | 3 | 3 | – | 92 | 115 | +25.0% | 20 | 45 | +125.0% |
| Triage level 2-5 management | 12 | 13 | +8.3% | 476 | 428 | −10.1% | 42 | 32 | −23.8% |
| Observation | 10 | 9 | −11.1% | 344 | 251 | −27.0% | 27 | 24 | −11.1% |
| Diagnostic tests | 25 | 27 | +8.0% | 756 | 735 | −2.8% | 30 | 27 | −10.0% |
| Treatment | 32 | 31 | −3.1% | 881 | 858 | −2.6% | 24 | 24 | – |
| Discharge management | 15 | 17 | +13.3% | 537 | 513 | −4.5% | 30 | 24 | −20% |
| GLOBAL | 106 | 110 | +3.8% | 3329 | 3142 | −5.6% | 30 | 24 | −20% |
RPN, risk priority number.
Improvement actions planned based on the 2017 risk map.
| IMPROVEMENT ACTIONS |
|---|
| 1. Written contingence plan (management of information technology incidents) |
| 2. Protocol for unequivocal patient identification with a system to warn of allergies/intolerances (to foods/drugs) by placing stickers (red/white) on the patient ID bracelet |
| 3. Development, implementation and validation of a new, patented paediatric triage scale (TRIPED-GM) |
| 4. Simulation programme to train on multidisciplinary teamwork in the care of children with emergent conditions |
| 5. Assignment of roles in the care of critically ill patients (at the beginning of each shift) |
| 6. Reimplantation of the role of the OU manager (supervision and management of patient workflow in the OU) |
| 7. Implantation of the FARHOS electronic prescription software (with direct access from the electronic health records system) in the OU, and training of medical and nursing staff (in collaboration with the Pharmacy Department) |
| 8. Electronic prescription protocols with automated dose calculation and application of maximum dose restrictions |
| 9. Vests to minimise interruptions during drug prescription/preparation |
| 10. Training in the “Five rights of medication administration” |
| 11. Procedure of verbal medication orders in emergencies (closed-loop with double-checking of the drug, dose and route of administration) |
| 12. SBAR tool for the transfer of clinical information in the hand-off of remaining patients during shift changes |
| 13. Workshops on health care humanization and effective communication |
| 14. Procedure for biological sample collection (sticker printing and confirmation of the samples needed before collection procedure) |
| 15. Urgent microbiological testing sample tracking and traceability record |
| 16. Safe transport protocol |
| 17. Increased supervision of medical residents (resident onboarding plant and UO manager/chief) |
| 18. Lumbar puncture workshops for incoming medical residents |
| 19. Application of FMEA to the subprocess “managing admission to inpatient ward”, with a multidisciplinary approach and with participation of the Department of Paediatric Inpatient Care and the Departments of Admission and Environmental Services/Housekeeping. |
FMEA, failure mode effect analysis; OU, observation unit; SBAR, situation, background, assessment, recommendation.
When we analysed the changes in our RM, we found that the total number of FMs had increased by 3.8% in 2019 (110 FMs compared to 106 in 2017). However, as can be seen in the risk stratification table (Table 4), this increase consisted mainly of FMs classified as moderate and low risk, with a 6.5% reduction in the proportion of FMs classified as high or very high risk (from 54.7% in 2017 to 48.2% in 2019).
Overall, the level of risk, estimated with the median RPN, decreased by 20% in the 2019 RM. In the analysis by process, we found a reduction in the level of risk for all processes except “Registration/Triage” and “Management of life-threatening emergencies” (Table 3).
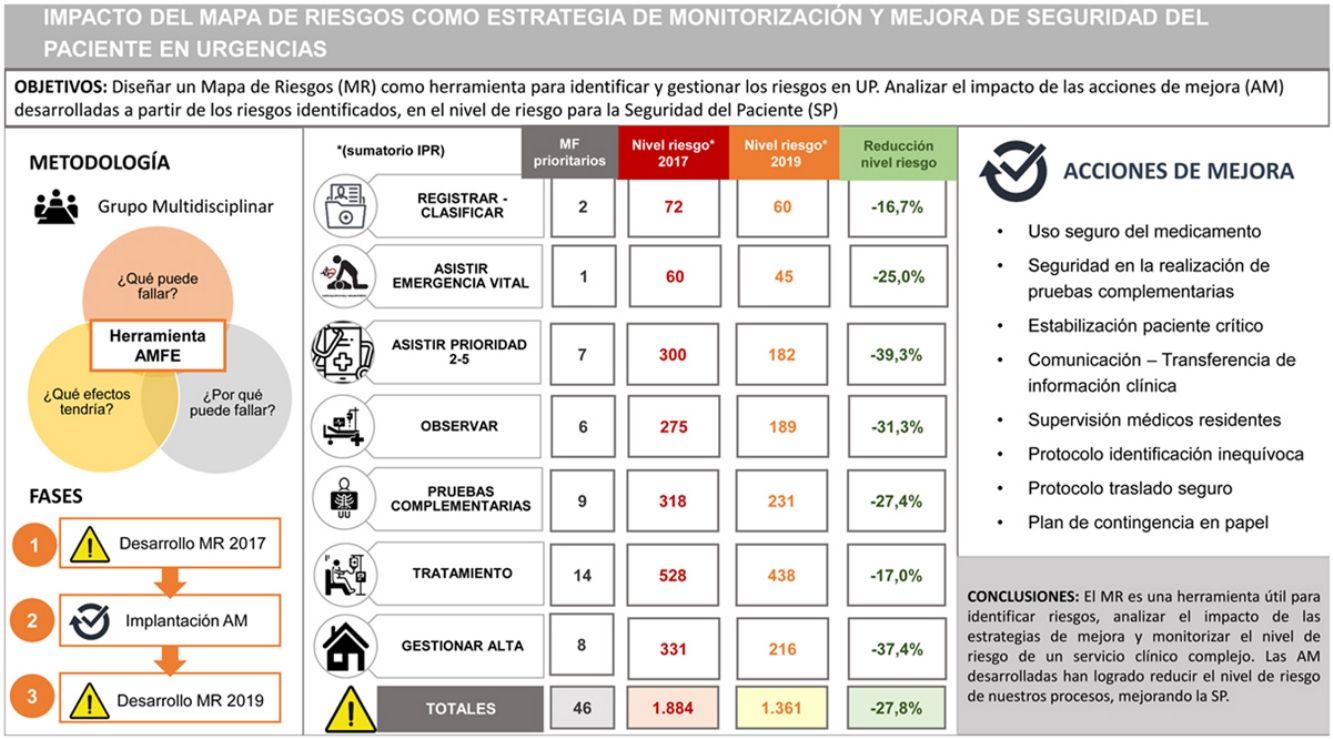
All IAs planned based on the risks identified in 2017 had been implemented. To assess the impact of the 19 implemented IAs, we specifically analysed the 46 prioritised risks (FMs) that these strategies were meant to address. Sixty percent of these FMs went from being classified as high risk in 2017 to being classified as moderate risk in 2019. Table 6 reflects the impact of improvement actions in the 46 FMs they addressed, showing a reduction in the level of risk, both overall (−27.8%) and in the analysis broken down by process.
Impact of improvement actions developed in managed risks: comparison of risk level (RPN sum) overall and by process, considering specifically the 46 managed risks.
| Process | Number of FMs | Level of risk (RPN sum) | ||
|---|---|---|---|---|
| 2017 | 2019 | Reduction in level of risk | ||
| Registration-triage | 2 | 72 | 60 | −16.7% |
| Life-threatening emergency management | 1 | 60 | 45 | −25.0% |
| Triage level 2-5 management | 7 | 300 | 182 | −39.3% |
| Observation | 6 | 275 | 189 | −31.3% |
| Diagnostic tests | 9 | 318 | 231 | −27.4% |
| Treatment | 14 | 528 | 438 | −17.0% |
| Discharge management | 8 | 331 | 216 | −37.4% |
| OVERALL | 46 | 1884 | 1361 | −27.8% |
FM, failure mode; RPN, risk prioritization number.
Numerous publications support the usefulness of FMEA as a method to systematically assess complex processes to identify risk areas and provide the foundation for the development of interventions that minimise the probability of an AE occurring, thus contributing to improving patient safety in HEDs.1,4,12 Some publications have described experiences with the development of RMs in the field of paediatric emergency care.5,7
However, as noted by Orrego,12 while there may be an enthusiastic investment in the development of methods of analysis at the outset, these should not be the core of the safety strategy of an institution, neglecting the development of improvement strategies and the redesign of processes to improve their safety. Several studies13–16 have highlighted the importance of reviewing RPN scores to assess the effectiveness of the corrective actions planned based on a FMEA.13–16 However, we only found one study conducted in Spain that used FMEA to assess the impact of a set of actions developed to reduce prescription errors in a high-performance one-stop hospital.17 Thus, ours is the first study that has applied FMEA as a follow-up method to monitor changes in overall risk in a complex clinical care setting.
In the framework of certification in patient safety risk management (Spanish standard UNE-179003), the development and periodic revision of RMs is a proactive strategy that complements reactive management based on the analysis of the incidents reported in the unit. In fact, there is a parallelism in the distribution by processes of the FMs identified in the RM (with the largest proportion corresponding to treatment, followed by diagnostic testing) and the pattern of the incidents reported in the unit14 (distribution by processes of notifications of Period 1 of the study: predominance of treatment [35.8%] followed by diagnostic testing [32.1%]). This distribution of FMs is similar to the distribution in RMs designed in other PEDs in Spain5,7 and previous studies in the literature, in which medication errors are the most frequent incidents or AEs reported in paediatric care settings.18,19
The periodic update of our RM with the FMEA method allowed us to establish the impact of planned IAs and monitor the changes in the level of risk of the unit, overall and in each operational process. The 2019 RM evinced an increase in the total number of risks compared to 2017, probably due to the redesign of some processes through the introduction of new software applications (electronic triage, health records and prescription) that gave rise to new FMs, and also the training of the working group in the methodology, which honed the ability of its members to detect risks, especially those of moderate and low level, and allowed an increasingly thorough review of the processes. Despite this increase in the total number of FMs, we found that the overall level of risk in the PED had decreased considerably in 2019, as evinced by the risk stratification profile (reduction of 6.5% in the FMs classified as high or very high risk) and the level of risk estimated by the median RPN, which decreased by 20% in the 2019 RM. This overall reduction in risk was probably due to the fact that the implementation of corrective measures to address very high risks can indirectly reduce other lower risks.1 In the analysis by process, we only found an increase in risk in the registration/triage and management of life-threatening emergencies processes. In the case of registration/triage, the new map included a FM that had not been contemplated in the 2017 RM (“delay in administrative registration”, RPN 48). In the case of management of life-threatening emergencies, one of the FMs included in the 2017 RM (“lack of training in the stabilization of critical patients”, RPN 60) was split into 2 FMs in the 2019 RM to reflect the involvement of different contributing factors (“lack of knowledge/training in critical patient stabilization algorithms” [RPN 60] and “problems in coordination/lack of training in teamwork skills” [RPN 45], of which the latter had been the one addressed by planned IAs). The total number of FMs in this process remained the same because in the 2019 RM, one FM that was present in the 2017 RM disappeared (“error in sample identification”, as it was considered to duplicate the risks identified in the diagnostic testing process). We believe that these differences explain the increase in the level of risk in these processes.
Most of the IAs planned based on the risks identified in the 2017 RM could be grouped into 5 areas: medication safety, diagnostic test safety, stabilization of critically ill patients, communication/transfer of clinical information and supervision of medical residents. Other general safe practices were also developed that affected every process, such as the protocol to guarantee correct patient identification, the safe transport protocol and the written contingency plan to handle information technology emergencies. We believe that the key factor that allowed the successful implantation of all planned IAs was the previous application of prioritization criteria, with selection of strategies considered feasible, in line with the strategic plans of the institution and that would have the highest potential impact on the level of risk, in addition to the appointment of individuals in charge of the IAs and carrying out follow-up evaluations in the medium term.
The analysis of the FMs that had been addressed with these IAs evinced a reduction in the level of risk, overall and by process. This reduction in the level of risk was achieved through two types of strategies: some aimed at reducing the probability of a given FM occurring (multidisciplinary teamwork simulation to improve the ability of professionals to work in a coordinated fashion during the stabilization of a critically ill patient or to use electronic prescription protocols with automatic dose calculation and maximum dose restrictions that reduce the risk of prescription errors) and others that, starting from the assumption that errors are an inescapable aspect of clinical practice, aim at improving the ability to detect the error before it reaches the patient (a closed-loop system of verbal medication orders in the resuscitation bay, or the role of the observation manager to improve the supervision of medical residents).
The strengths of this study include the use of the FMEA approach, not only for diagnostic purposes (RM 2017) but also as a follow-up tool that, driven by a commitment to ongoing improvement, allowed monitoring the level of risk of a complex clinical care setting, thus contributing to improving PS. We believe that it may be useful for other HEDs, as it proposes strategies for improvement as well as a risk management model that could be extrapolated to other facilities, adapting them to the particularities of each department.
Among its limitations, we ought to highlight that FMEA is a theoretical exercise that is somewhat subjective, and this subjectivity may have an effect on the analysis of root causes and the assessment of the level of risk.16 On the other hand, the development of a RM requires a significant investment of time and resources, and its success largely depends on the commitment of the team members and the facility to hold regular and productive meetings20 (in our case, each RM required 5 full working days of each of the members of the working group). Lastly, since the study was conducted in a single centre, the risks identified in the RM are associated with the particular setting and circumstances of the PED in which it was developed. It would be interesting to carry out similar studies in other HEDs with established risk management systems to compare outcomes.
ConclusionThe development of a RM allows detection of critical points for PS during health care delivery. Failure mode effect analysis is a useful tool to identify threats to PS in health care settings, assess the impact of improvement strategies developed based on the identified risks and monitor the level of risk in a complex care setting. The development of improvement actions has had a significant impact in reducing the risk of health care processes in our department, contributing to improving PS.
The following is Supplementary data to this article:
Previous presentations: this study was presented at the XXXVII Congress of the Sociedad Española de Calidad Asistencial, October 2019, San Sebastian, Spain; the VIII AMCA Conference of the Asociación Madrileña de Calidad Asistencial, December 2019, Madrid, Spain; and the XXV Meeting of the Sociedad Española de Urgencias Pediátricas, March 2021, held online, where it was awarded the First Prize to the Best Communication.
