
Crohn’s disease (CD) is an inflammatory bowel disease (IBD) with an increasing incidence of 0.1–13.9 per 100 000 in the pediatric population.1 Its pathogenesis is multifactorial and its diagnosis in children is challenging due to the typically prolonged duration of symptoms before confirmation. The gold standard for diagnosis is endoscopy with biopsy, although non-invasive serological markers may play a key role. Cell indices derived from routine complete blood count values have been found useful in IBD; however, this is the first study to compare the diagnostic utility of the derived neutrophil-to-lymphocyte ratio (dNLR), platelet-to-lymphocyte ratio (PLR) and neutrophil-to-lymphocyte ratio (NLR) in pediatric CD.2 We conducted a retrospective diagnostic study (IRB No. 3318-0000206) in patients aged 0–15 years who underwent endoscopy and biopsy for suspected IBD at a children’s hospital between 2015 and 2022. The exclusion criteria included diagnosis of ulcerative colitis, therapeutic endoscopy procedures and lack of complete blood counts or biopsy samples. We analyzed demographic characteristics and laboratory variables such as C-reactive protein (CRP), fecal calprotectin (FC) levels and complete blood count values. Blood samples were processed using an automated hematology analyzer (DxH 900, Beckman Coulter), and the NLR and PLR were calculated as the ratios of the neutrophil or platelet count, as applicable, by the lymphocyte count. We obtained the dNLR by dividing the neutrophil count by the difference between the total leukocyte and neutrophil counts. The statistical analyses were conducted with the software IBM SPSS Statistics version 25.0. We assessed diagnostic accuracy by means of receiver operating characteristic (ROC) curves and the Youden index. We calculated the sensitivity, specificity and predictive values defining statistical significance as a P value of less than .05. A total of 502 pediatric endoscopies were performed between 2015 and 2022. After applying the exclusion criteria, the analysis included 36 patients: 22 with Crohn’s disease (CD group) and 14 with normal biopsies (no CD [NCD] group). The NCD group included patients who underwent diagnostic endoscopy and colonoscopy for suspected IBD but had normal or non-inflammatory findings on biopsy. The mean age was 9.9 years in the NCD group vs 11.8 years in the CD group (P = .062), and male patients predominated in both (71% vs 54%; P = .311). The neutrophil count, NLR, dNLR, and PLR were significantly higher in patients with CD (P < .05). The leukocyte count was higher in the CD group (P = .115), whereas the lymphocyte count was higher in the NCD group (P = .270). The sensitivity, specificity and positive predictive value (PPV) for diagnosis of CD were 86%, 71% and 82%, respectively, for the neutrophil count, 91%, 64%, and 80% for the NLR, 81%, 78%, and 85% for the dNLR and 81%, 92%, and 94%, for the PLR (Table 1). The PLR yielded the highest diagnostic accuracy, with a cutoff of 155.3, an area under the curve (AUC) of 0.945 and an odds ratio of 58.5 (P = .0005) (Fig. 1A). When the PLR surpassed this threshold, the probability of a CD diagnosis increased from 61% to 95% (Fig. 1B).
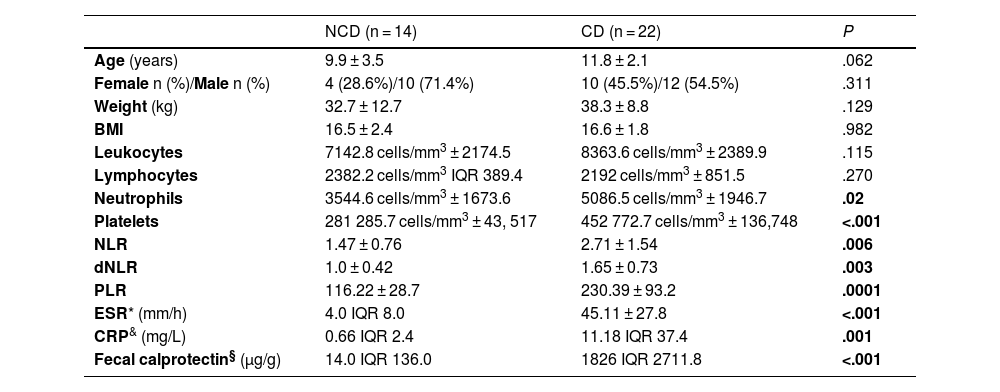
Demographic and laboratory variables for the analyzed sample. Diagnostic performance of the studied inflammatory markers.
| NCD (n = 14) | CD (n = 22) | P | |
|---|---|---|---|
| Age (years) | 9.9 ± 3.5 | 11.8 ± 2.1 | .062 |
| Female n (%)/Male n (%) | 4 (28.6%)/10 (71.4%) | 10 (45.5%)/12 (54.5%) | .311 |
| Weight (kg) | 32.7 ± 12.7 | 38.3 ± 8.8 | .129 |
| BMI | 16.5 ± 2.4 | 16.6 ± 1.8 | .982 |
| Leukocytes | 7142.8 cells/mm3 ± 2174.5 | 8363.6 cells/mm3 ± 2389.9 | .115 |
| Lymphocytes | 2382.2 cells/mm3 IQR 389.4 | 2192 cells/mm3 ± 851.5 | .270 |
| Neutrophils | 3544.6 cells/mm3 ± 1673.6 | 5086.5 cells/mm3 ± 1946.7 | .02 |
| Platelets | 281 285.7 cells/mm3 ± 43, 517 | 452 772.7 cells/mm3 ± 136,748 | <.001 |
| NLR | 1.47 ± 0.76 | 2.71 ± 1.54 | .006 |
| dNLR | 1.0 ± 0.42 | 1.65 ± 0.73 | .003 |
| PLR | 116.22 ± 28.7 | 230.39 ± 93.2 | .0001 |
| ESR* (mm/h) | 4.0 IQR 8.0 | 45.11 ± 27.8 | <.001 |
| CRP& (mg/L) | 0.66 IQR 2.4 | 11.18 IQR 37.4 | .001 |
| Fecal calprotectin§ (µg/g) | 14.0 IQR 136.0 | 1826 IQR 2711.8 | <.001 |
| Neutrophils | NLR | dNLR | PLR | |
|---|---|---|---|---|
| AUC ROC (95% CI) | 0.763 (0.587−0.939) | 0.773 (0.610−0.935) | 0.794 (0.639−0.949) | 0.945 (0.877−1.0) |
| Cutoff point | 3362.6 cells/mm3 | 1.39 | 1.13 | 155.3 |
| Sensitivity (95% CI) | 86.3% (65−97) | 90.9% (70.8−98.8) | 81.8% (59.7−94.8) | 81.8% (59.7−94.8) |
| Specificity (95% CI) | 71.4% (41.9−91.6) | 64.2% (35.1−87.2) | 78.5% (49.2−95.3) | 92.8% (66.1−99.8) |
| PPV (95% CI) | 82.6% (67.1−91.7) | 80% (66.1−89.1) | 85.7% (63.8−94.3) | 94.7% (72.9−99.1) |
| NPV (95% CI) | 76.9% (52.5−90.9) | 81.8% (53.1−94.6) | 73.3% (52.1−87.4) | 76.4% (56.9−88.8) |
| Pre-test probability | 61% | |||
| PTP(+) | 83% (67−92) | 80% (66−89) | 86% (68−95) | 95% (73−99) |
| PTP(−) | 23% (9−48) | 18% (6−47) | 27% (12−48) | 24% (11−43) |
| OR (95% CI) | 15.8 (2.94−85.0) | 18 (2.92−110.9) | 16.5 (3.09−88.0) | 58.5 (5.83−586.1) |
| P | .0001 | .0001 | .0001 | .0005 |
AUC ROC, Area under the Receiver Operating Characteristic Curve; BMI, body mass index; CD, Crohn disease; CI, confidence interval; CRP, C-reactive protein; dNLR, derived neutrophil-to-lymphocyte ratio; ESR, erythrocyte sedimentation rate; IQR, interquartile range; NCD, no CD (normal biopsy); NLR, neutrophil-to-lymphocyte ratio; NPV, negative predictive value; OR, odds ratio; PLR, platelet-to-lymphocyte ratio; PPV, positive predictive value; PTP(+), post-test probability of a positive result; PTP(−), post-test probability of a negative result.
 ROC curves for the neutrophil count, neutrophil-to-lymphocyte ratio (NLR), derived neutrophil-to-lymphocyte ratio (dNLR), and platelet-to-lymphocyte ratio (PLR) for diagnosis of CD. (B) Fagan nomogram: when a patient had a PLR above the cut-off point (>155.3), the probability of having CD increased from 61% to 95% (blue line). Conversely, when the PLR did not exceed this cutoff value, the probability decreased from 61% to 24% (red line). Therefore, 1 out of every 1.1 patients with a positive result (PLR > 155.3) received a diagnosis of CD.")
(A) ROC curves for the neutrophil count, neutrophil-to-lymphocyte ratio (NLR), derived neutrophil-to-lymphocyte ratio (dNLR), and platelet-to-lymphocyte ratio (PLR) for diagnosis of CD. (B) Fagan nomogram: when a patient had a PLR above the cut-off point (>155.3), the probability of having CD increased from 61% to 95% (blue line). Conversely, when the PLR did not exceed this cutoff value, the probability decreased from 61% to 24% (red line). Therefore, 1 out of every 1.1 patients with a positive result (PLR > 155.3) received a diagnosis of CD.
The reported NLR cutoff for differentiating CD patients from healthy controls ranges from 2.13 to 2.85.3 In our study, the cutoff was lower (1.39), which may be explained by the higher lymphocyte counts in children compared to adults. In a study of over 200 subjects, the NLR yielded an AUC of 0.74, a sensitivity of 68%, a specificity of 76% and a negative predictive value (NPV) of 70% for CD diagnosis.4 The performance of the NLR was superior in our study (AUC, 0.77; sensitivity, 91%; specificity, 64%; NPV, 82%). Likewise, the PLR was the most accurate diagnostic parameter in our study, with an AUC of 0.945, a cutoff of 155.3, a sensitivity of 81%, a specificity of 92% and a PPV of 94%. These results were superior to those reported by Feng et al., who found that the PLR correlated positively with the CRP level in patients with CD (r = 0.29; P < .01), with an AUC of 0.860, a cutoff of 132.8, a sensitivity of 76% and a specificity of 84%. In that study, as in ours, the PLR was more accurate than the NLR.4 Calprotectin levels correlate with disease activity in both CD and ulcerative colitis.5 In our cohort, calprotectin median values were significantly higher in patients with CD (1826 µg/g) compared to the NCD group (14 µg/g); however, we were unable to determine the diagnostic utility of this marker due to a significant proportion of missing values, which constituted a methodological limitation. In the same vein, missing data for CRP and erythrocyte sedimentation rate values is a concern that restricts the comparability of these new biomarkers with those traditionally used in routine care. Furthermore, while exploring cell indices in healthy controls would be interesting, analyzing a potentially ill population is a more realistic scenario and offers the advantage that results could eventually be applied in clinical practice in the initial evaluation of patients with suspected IBD. This study highlights the potential of the PLR as a preliminary screening tool to prioritize patients for invasive diagnostic procedures when values exceed 155.3, and to consider less invasive initial testing in those with PLRs at or below 155.3. Comparison with biomarkers such as fecal calprotectin would enhance the evaluation of the diagnostic utility of cell indices. Variability in disease location, symptom duration and treatment complicates establishing universal thresholds. Therefore, future studies should explore a biomarker panel approach to improving diagnostic accuracy and the role of cell indices in differentiating CD from ulcerative colitis, monitoring disease activity and guiding treatment. Prospective validation in larger cohorts is necessary to confirm the utility of cell indices as noninvasive markers for tracking disease progression and optimizing treatment in pediatric CD.
