The management of coronavirus disease 2019 (COVID-19) has been changing since the beginning of the pandemic caused by this virus (SARS-COV-2).
The initial lack of knowledge on the pathogenic mechanisms of the virus, the absence of published evidence and the severity of disease in adult patients led to therapeutic approaches in the first wave of the pandemic that have been changing as our understanding of the disease improved.1 We conducted a retrospective descriptive study in the paediatric emergency department of the Hospital Universitario La Paz in Madrid, Spain, analysing and comparing the characteristics of patients and their management in the first wave (31/03/2020–26/06/2020) and second wave (20/07/2020–30/11/2020) of the pandemic.
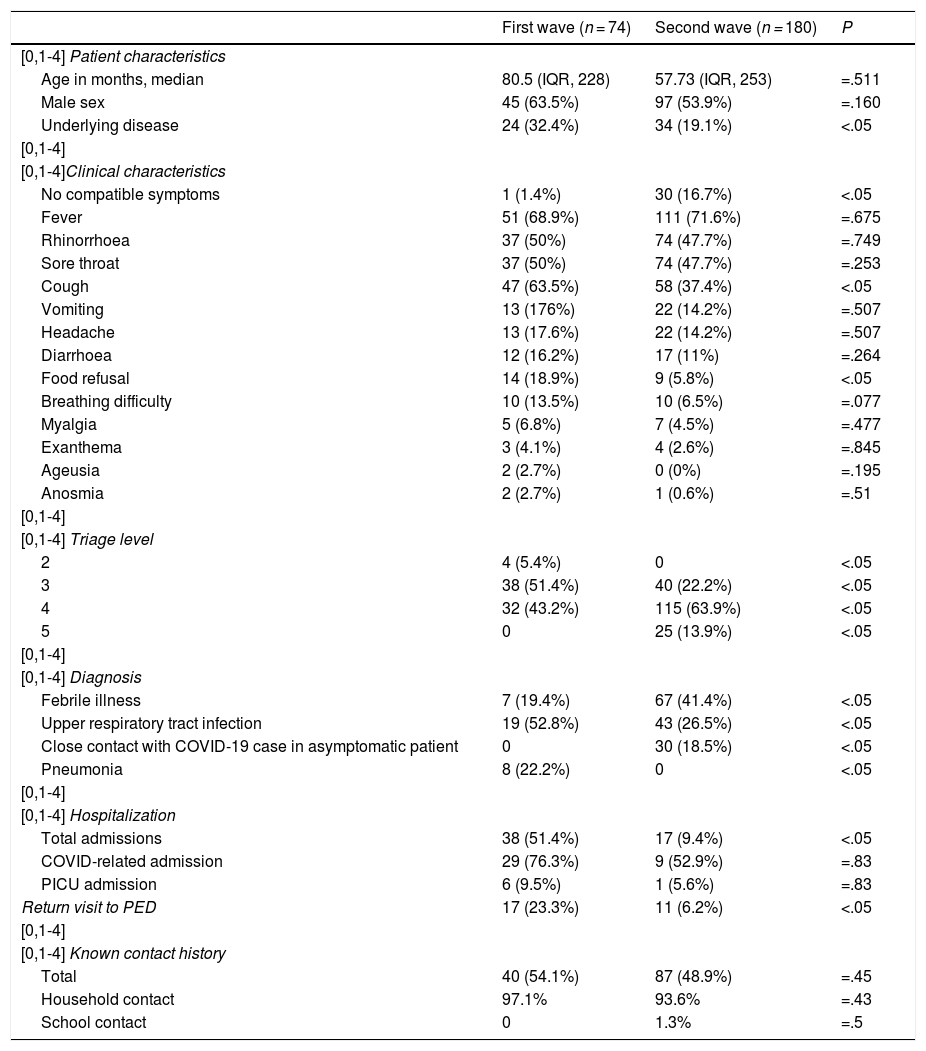
In the first wave, 74 patients received a diagnosis of SARS-CoV-2 infection,2,3 compared to 180 patients in the second wave. Table 1 summarises the main characteristics of the cases.
Summary of demographic and clinical characteristics of patients managed in each wave.
| First wave (n = 74) | Second wave (n = 180) | P | |
|---|---|---|---|
| [0,1-4] Patient characteristics | |||
| Age in months, median | 80.5 (IQR, 228) | 57.73 (IQR, 253) | =.511 |
| Male sex | 45 (63.5%) | 97 (53.9%) | =.160 |
| Underlying disease | 24 (32.4%) | 34 (19.1%) | <.05 |
| [0,1-4] | |||
| [0,1-4]Clinical characteristics | |||
| No compatible symptoms | 1 (1.4%) | 30 (16.7%) | <.05 |
| Fever | 51 (68.9%) | 111 (71.6%) | =.675 |
| Rhinorrhoea | 37 (50%) | 74 (47.7%) | =.749 |
| Sore throat | 37 (50%) | 74 (47.7%) | =.253 |
| Cough | 47 (63.5%) | 58 (37.4%) | <.05 |
| Vomiting | 13 (176%) | 22 (14.2%) | =.507 |
| Headache | 13 (17.6%) | 22 (14.2%) | =.507 |
| Diarrhoea | 12 (16.2%) | 17 (11%) | =.264 |
| Food refusal | 14 (18.9%) | 9 (5.8%) | <.05 |
| Breathing difficulty | 10 (13.5%) | 10 (6.5%) | =.077 |
| Myalgia | 5 (6.8%) | 7 (4.5%) | =.477 |
| Exanthema | 3 (4.1%) | 4 (2.6%) | =.845 |
| Ageusia | 2 (2.7%) | 0 (0%) | =.195 |
| Anosmia | 2 (2.7%) | 1 (0.6%) | =.51 |
| [0,1-4] | |||
| [0,1-4] Triage level | |||
| 2 | 4 (5.4%) | 0 | <.05 |
| 3 | 38 (51.4%) | 40 (22.2%) | <.05 |
| 4 | 32 (43.2%) | 115 (63.9%) | <.05 |
| 5 | 0 | 25 (13.9%) | <.05 |
| [0,1-4] | |||
| [0,1-4] Diagnosis | |||
| Febrile illness | 7 (19.4%) | 67 (41.4%) | <.05 |
| Upper respiratory tract infection | 19 (52.8%) | 43 (26.5%) | <.05 |
| Close contact with COVID-19 case in asymptomatic patient | 0 | 30 (18.5%) | <.05 |
| Pneumonia | 8 (22.2%) | 0 | <.05 |
| [0,1-4] | |||
| [0,1-4] Hospitalization | |||
| Total admissions | 38 (51.4%) | 17 (9.4%) | <.05 |
| COVID-related admission | 29 (76.3%) | 9 (52.9%) | =.83 |
| PICU admission | 6 (9.5%) | 1 (5.6%) | =.83 |
| Return visit to PED | 17 (23.3%) | 11 (6.2%) | <.05 |
| [0,1-4] | |||
| [0,1-4] Known contact history | |||
| Total | 40 (54.1%) | 87 (48.9%) | =.45 |
| Household contact | 97.1% | 93.6% | =.43 |
| School contact | 0 | 1.3% | =.5 |
The median age of the total sample under study was 62.7 months (interquartile range [IQR], 254), and 56.7% were male. We did not find differences in the age and sex distribution of patients between the 2 waves.
At first, all cases were confirmed by means of the polymerase chain reaction (PCR) test, which was the only test available at the time.2,3
In the second wave, antigen tests were already available and led to the detection of 40 of the cases (22.2%).
In the first wave, the SARS-CoV-2 PCR test was only ordered in patients that required admission or that were symptomatic and had underlying disease.2,3 In the second wave, testing was performed in all patients with compatible symptoms, that required admission or that were asymptomatic but with known contact with a positive case in the household. This is reflected in the higher percentage of patients with underlying disease in the first wave.2,3 In addition, the proportion of cases detected in asymptomatic patients was much smaller in the first wave compared to the second.
Overall, the triage level was higher in patients in the first wave, when level 3 was most frequent, compared to level 4 in the second wave.2,3
When it came to clinical manifestations, we found statistically significant differences between the 2 waves in the proportion of patients presenting with cough and food refusal, both of which were more frequent in the first wave.3 In the second wave, there was a significantly greater proportion of patients without symptoms suggestive of COVID-19.
The most frequent diagnoses in both waves were upper respiratory tract infection and fever without a source.2,3 In the first wave, there were 8 cases of pneumonia, compared to none in the second wave. In the first wave, a chest X-ray was performed in most patients due to extrapolation of the management in adults. In the second wave, as experience grew and it became apparent that pneumonia was rare in children, this test was no longer performed routinely. It is likely that the frequency of pneumonia was overestimated in the first wave, with mild infiltration interpreted as possible pneumonia foci. We reviewed records to determine whether patients returned to the emergency department within 72 h of the initial visit to rule out the presence of complications secondary to the infection, including pneumonia.
The number of admissions and the length of stay were significantly lower in the second wave (first wave, median LOS, 4 days [IQR, 29]; second wave, median LOS, 2 days [IQR, 7]).2,3
There were no significant differences in the frequency of admission to the intensive care unit.
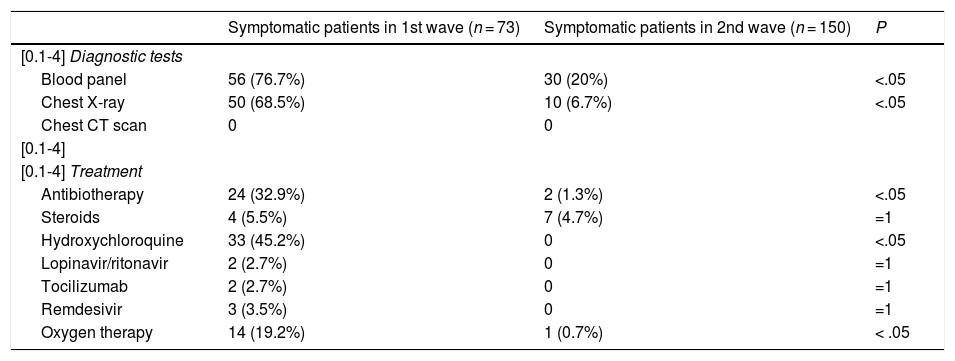
We analysed the management of symptomatic patients in each wave. In the first wave, management was more aggressive, with performance of blood tests and a chest X-ray in a significantly greater proportion of patients. None of the patients underwent a computed tomography (CT) scan (Table 2).
Summary of diagnostic tests and treatments used in symptomatic patients in each wave.
| Symptomatic patients in 1st wave (n = 73) | Symptomatic patients in 2nd wave (n = 150) | P | |
|---|---|---|---|
| [0.1-4] Diagnostic tests | |||
| Blood panel | 56 (76.7%) | 30 (20%) | <.05 |
| Chest X-ray | 50 (68.5%) | 10 (6.7%) | <.05 |
| Chest CT scan | 0 | 0 | |
| [0.1-4] | |||
| [0.1-4] Treatment | |||
| Antibiotherapy | 24 (32.9%) | 2 (1.3%) | <.05 |
| Steroids | 4 (5.5%) | 7 (4.7%) | =1 |
| Hydroxychloroquine | 33 (45.2%) | 0 | <.05 |
| Lopinavir/ritonavir | 2 (2.7%) | 0 | =1 |
| Tocilizumab | 2 (2.7%) | 0 | =1 |
| Remdesivir | 3 (3.5%) | 0 | =1 |
| Oxygen therapy | 14 (19.2%) | 1 (0.7%) | < .05 |
When it came to treatment, we found substantial differences between the two waves.2,3 Antibiotherapy was used more frequently in the first wave.2,3 Some of the other treatments used in the first wave (hydroxychloroquine, antivirals, tocilizumab) were not used in any of the patients in the second wave, a difference most marked in the case of hydroxychloroquine, which was used in 44.6% of patients in the first wave.2,3 Oxygen therapy was also less frequent in the second wave (Table 2).
The lack of knowledge and fear of severe disease in children led to a higher frequency of return visits to the emergency department in the first wave, a difference that was statistically significant.
Close contact with a case was identified in approximately 50% of patients, with transmission occurring through household contacts most frequently. It is worth noting that although schools were open during the second wave, there were very few cases attributed to in-school transmission.
In conclusion, we would like the highlight that the collapse of the health care system in Madrid in the first wave of the pandemic led to underdiagnosis of infection by SARS CoV-2 in children, as diagnostic tests were only ordered in patients with underlying disease or requiring hospital admission. This is reflected in the characteristics of the patients given the diagnosis in each wave, with a higher proportion of patients with underlying disease, higher triage levels and a higher frequency of admission in the first wave.
In addition, the lack of knowledge of the disease at the outset of the pandemic led to a more aggressive approach in diagnostic testing, hospital admission, treatment and repeated emergency visits during the first wave.
Although schools remained open during the second wave, we found that in most cases, the known contacts were household members.
Please cite this article as: Martín Espín I, Plata Gallardo M, de Miguel Cáceres C, Bueno Barriocanal M, de Ceano-Vivas La Calle M. Comparación entre la primera y la segunda ola de la pandemia producida por el coronavirus SARS-CoV-2 en urgencias pediátricas de un hospital terciario de Madrid. An Pediatr (Barc). 2021;95:477–479.
Previous presentation: this study was presented at the la XXV Annual Meeting of the Sociedad Española de Urgencias Pediátricas (SEUP); March 3–6, 2021; Donostia, Spain.


