

To characterize safety incidents in paediatric emergency departments (PEDs): frequency, sources, root causes, and consequences.
Materials and methodsWe conducted a cross-sectional, observational and descriptive study in the PED of the Clinical University Hospital XX (blinded for review). Patients were recruited through opportunity sampling and the data were collected during care delivery and one week later through a telephone survey. The methodology was based on the ERIDA study on patient safety incidents related to emergency care, which in turn was based on the ENEAS and EVADUR studies.
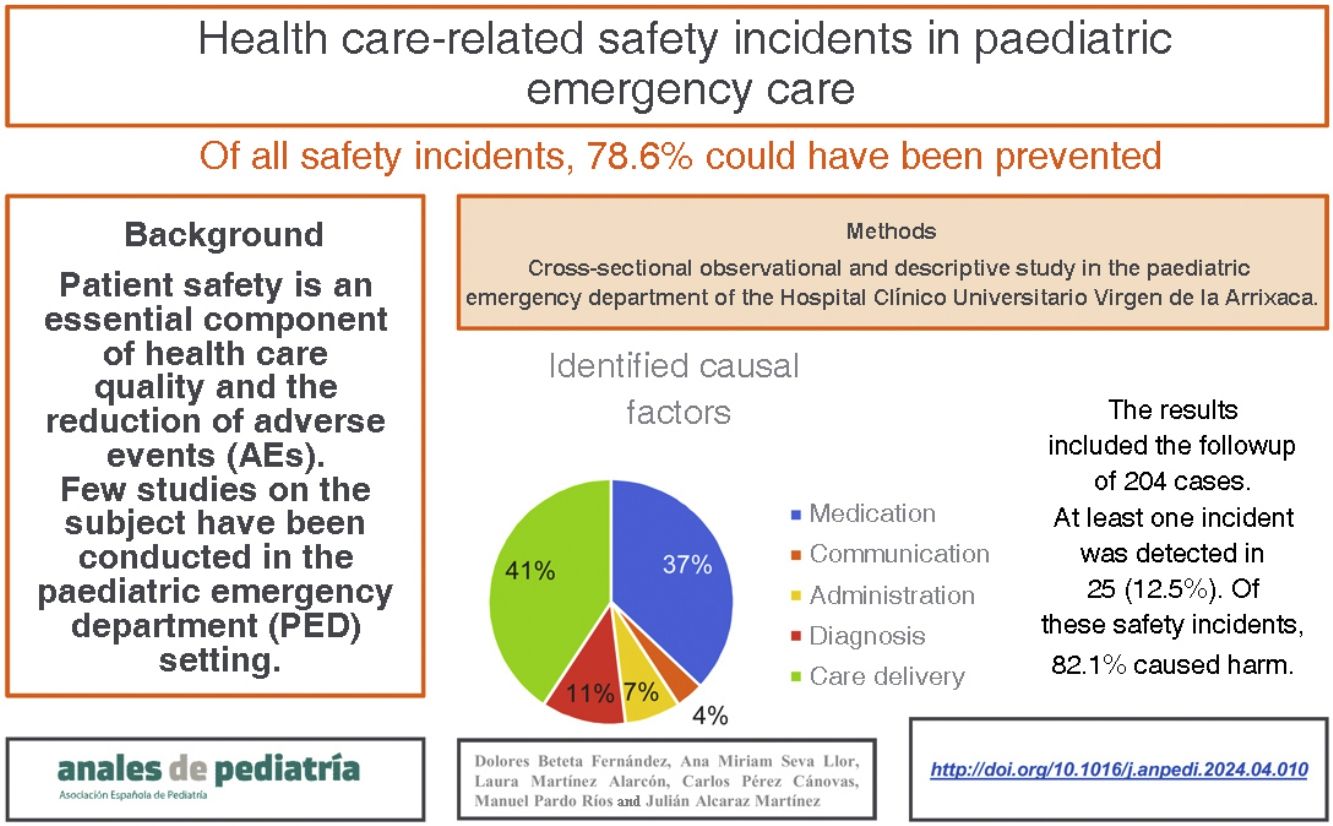
ResultsThe study included a total of 204 cases. At least one incident was detected in 25 cases, with two incidents detected in 3 cases, for a total incidence of 12.3%. Twelve incidents were detected during care delivery and the rest during the telephone call. Ten percent did not reach the patient, 7.1% reached the patient but caused no harm, and 82.1% reached the patient and caused harm. Thirteen incidents (46.4%) did not have an impact on care delivery, 8 (28.6%) required a new visit or referral, 6 (21.4%) required additional observation and 1 (3.6%) medical or surgical treatment. The most frequent root causes were health care delivery and medication. Incidents related to procedures and medication were most frequent. Of all incidents, 78.6% were considered preventable, with 50% identified as clear failures in health care delivery.
ConclusionsSafety incidents affected 12.3% of children managed in the PED of the HCUVA, of which 78.6% were preventable.
Caracterizar los incidentes de seguridad en los servicios de urgencias pediátricas (SUP): frecuencia, fuentes, factores causales y consecuencias.
Material y métodosEstudio observacional, descriptivo y transversal, en los SUP del Hospital Clínico Universitario XX (cegado para revisión). Aleatorización por oportunidad en turno de mañana, tarde y noche: Se recogieron datos durante la asistencia y una semana después por encuesta telefónica. La metodología se basó en los estudios de incidentes derivados de la atención en urgencias ERIDA, basado a su vez en los estudios ENEAS y EVADUR.
ResultadosSe incluyeron 204 casos. En 25 casos se detectó al menos un incidente, 3 casos tuvieron 2, con una tasa total de 12,3%. 12 incidentes se detectaron en la asistencia, resto en la llamada. El 10% no afectaron al paciente, el 7,1% afectaron pero sin daño y 82,1% afectaron con daño. En 13 incidentes (46,4%) la atención no se vio afectada, en 8 (28,6%) precisaron nueva consulta o derivación, en 6 (21,4%) precisaron más observación y en 1 (3,6%) tratamiento médico o quirúrgico. Los factores causales más frecuentes fueron los relacionados con los cuidados y con la medicación. Los efectos derivados de los procedimiento y medicación fueron los más usuales. El 78,6% de los incidentes se consideraron evitables, identificandose el 50% como fallo claro de actuación.
ConclusionesEl 12,3% de los niños atendidos en SUP del HCUVA sufrieron un incidente de seguridad, teniendo una evitabilidad del 78,6%.

Patient safety is an essential component of health care quality, and reducing adverse events (AEs) a priority in health care delivery. The World Health Organization (WHO), the European council and the Ministry of Health of Spain urge adherence to the published recommendations pertaining to patient safety.1–3
In Spain, the ENEAS study4,5 found an incidence of AEs of 9.3%, of which 70% required additional treatment and 42.8% were considered preventable. When it comes to the emergency care setting, the evidence is scarce, although this is a setting in which the risk is potentially high.6 The EVADUR study,7 conducted in emergency departments in Spanish hospitals, found that AEs occurred in 12% of the patients, and the ERIDA study8 also found similar figures. Few studies have been conducted in paediatric emergency departments (PEDs).9,10 The main objective of our study was to characterise safety incidents in the PED setting.
Material and methodsWe conducted a cross-sectional, observational and descriptive study in the PED of the Hospital Clínico Universitario Virgen de la Arrixaca, which serves a catchment population of 125000 children and has a large number of paediatric inpatient beds (150 in total) and managing a mean of 190 paediatric inpatients a day. The data collection method was based on the methodology applied in the ERIDA study8 and the local adverse events reporting system (SINASP).11
Ethical considerationsThe study was approved by the Health Care Ethics Committee of the Hospital Clínico Universitario Virgen de la Arrixaca. The parents or guardians of the patients had the right to access, withhold, rectify and oppose the use of data collected in the study as established in the committee’s ruling. Inclusion in the study did not entail performance of any additional interventions in the selected patients. All the collected data were coded.
Study sampleThe sample consisted of children aged 0 to 14 years managed in the PED. We calculated the sample size based on previous studies.9 We set an alpha risk of 0.05 for a precision of +0.4% in 2-tailed tests for an estimated proportion of 0.9, and calculated that we needed a minimum sample of 196 patients assuming that the total population managed at the PED of the hospital is of 63000 patients/year.
The sampling method was based on the number of cases managed per year, the sample size calculation and the dates the data were collected. Patients were recruited by convenience sampling, with chance selection of patients who were managed in the morning, afternoon and night shifts of the days when data were collected. We included the first 3 patients managed at the PED starting from the hours of from 10:00, 18:00 and 23:00 hours. We made sure the subsets were proportional for each shift and day of the week. Substitution was performed by including the following patient by order of arrival.
Data collection formWe collected the data adapting the form used in the ERIDA study.8 We eliminated the items that concerned diseases or conditions found exclusively in adults. We analysed variables such as age, sex, shift of arrival to PED, source of referral/visit, reason for visit, category, assigned triage level, professional providing initial care (paediatrician/medical resident), diagnostic tests, administered treatment, techniques/procedures used, duration of care episode, discharge destination, appropriateness of time elapsed to receiving care based on triage level.
In the cases in which there was a safety incident, we documented additional variables, such as the number of safety incidents, their cause, time of detection, impact on the patient and effects, any care delivered due to the incident, causal factors, potential preventability and whether they were documented in the health record. In our study, an AE was defined as “any instance of unintentional harm to a patient or concerning a patient” and an incident as “any event or circumstance that caused or could have caused unnecessary harm to a patient”.
Study protocolData concerning safety incidents were collected in person by the evaluators directly in the care setting and also through follow-up a week after discharge from the PED, by telephone if the patient had been discharged home or through an in-person interview if the patient remained in hospital. The evaluators were a group of independent professionals with no prior involvement with the patients or the cases included in the study.
To determine whether the cause of the incident was related to care delivery, the evaluators used a Likert scale ranging from 1 to 6, and scores ranging from 4 (moderate evidence) to 6 (definitive evidence) were interpreted as indicative of a health care-related cause. The preventability of the incident was also rated with a Likert scale ranging from 1 to 6, with 1 representing clear evidence that it was preventable and 6 that it was impossible to prevent. The potential occurrence of safety incidents was assessed in every selected patient. Before enrolment, all the professionals involved in the study were informed about patient safety in the PED, the purpose of the study and its phases, and trained on data collection methodology and the application of the questionnaire. We also analysed the agreement with the practical skills assessment questionnaire filled out by participating staff.
Evaluators collected data by direct observation throughout the PED care episode. The data on safety incidents was retrieved from the patient health records and the PED discharge summary. The assessment of incidents at 1 week consisted in the administration of a questionnaire to the parents or legal guardians of the child, by telephone if the patient had been discharged or in person if the patient was hospitalised.
Statistical analysisWe performed a descriptive analysis of the study variables and a comparative analysis between groups. In the descriptive analysis, we summarised categorical variables as absolute frequencies and percentages. Quantitative variables were expressed as mean and standard deviation (SD) or median and interquartile range (IQR). We used the χ2 test to assess the association between qualitative variables. To compared means, we used the Student t test if the data were normally distributed or the Mann-Whitney U test otherwise. Interrater reliability was measured by means of the kappa coefficient. We defined statistical significance as a P value of less than 0.05. The data were processed and analysed with the statistical package SPSS, version 25.
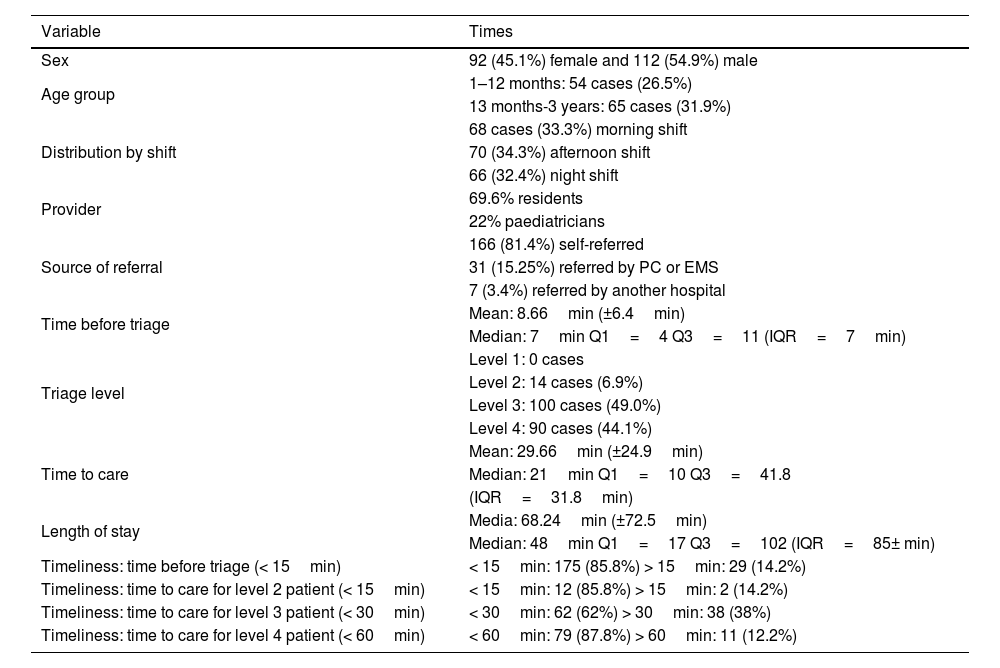
ResultsThe sample included 207 patients; 3 were lost to follow-up at the time of the telephone call, leaving a valid sample of 204 patients (Table 1). The main reasons for visiting the PED are presented in Table 2 by category. When it came to the assigned triage level, 90 cases (44.1%) were classified as level 4, 100 (49.0%) as level 3 and 14 (6.9%) as level 2. A majority of children were managed by residents (69.6%), followed in frequency by adjunct paediatricians (22%), and the rest received care from other specialists.
Characteristics of the sample: time intervals in care delivery and triage level.
| Variable | Times |
|---|---|
| Sex | 92 (45.1%) female and 112 (54.9%) male |
| Age group | 1–12 months: 54 cases (26.5%) |
| 13 months-3 years: 65 cases (31.9%) | |
| Distribution by shift | 68 cases (33.3%) morning shift |
| 70 (34.3%) afternoon shift | |
| 66 (32.4%) night shift | |
| Provider | 69.6% residents |
| 22% paediatricians | |
| Source of referral | 166 (81.4%) self-referred |
| 31 (15.25%) referred by PC or EMS | |
| 7 (3.4%) referred by another hospital | |
| Time before triage | Mean: 8.66min (±6.4min) |
| Median: 7min Q1=4 Q3=11 (IQR=7min) | |
| Triage level | Level 1: 0 cases |
| Level 2: 14 cases (6.9%) | |
| Level 3: 100 cases (49.0%) | |
| Level 4: 90 cases (44.1%) | |
| Time to care | Mean: 29.66min (±24.9min) |
| Median: 21min Q1=10 Q3=41.8 | |
| (IQR=31.8min) | |
| Length of stay | Media: 68.24min (±72.5min) |
| Median: 48min Q1=17 Q3=102 (IQR=85± min) | |
| Timeliness: time before triage (< 15min) | < 15min: 175 (85.8%) > 15min: 29 (14.2%) |
| Timeliness: time to care for level 2 patient (< 15min) | < 15min: 12 (85.8%) > 15min: 2 (14.2%) |
| Timeliness: time to care for level 3 patient (< 30min) | < 30min: 62 (62%) > 30min: 38 (38%) |
| Timeliness: time to care for level 4 patient (< 60min) | < 60min: 79 (87.8%) > 60min: 11 (12.2%) |
EMS, emergency medical system; IQR, interquartile range; PC, primary care; Q1, first quartile (25th percentile); Q3: third quartile (75th percentile). Time to care: time elapsed between triage and seeing the first care provider. Length of stay: time elapsed from arrival of patient to emergency department to discharge home, hospital admission or transfer. Time before triage: time elapsed from arrival of patient to emergency department to initial triage assessment.
In 76 cases (37.2%), the evaluation of the patient included at least one diagnostic test or procedure; in 30 cases (81.6% of this subset) a single diagnostic test or procedure. Plain radiographs were the tests ordered most frequently in the sample, in 12 cases (40%), followed by blood tests in 6 cases (20%). On the other hand, in 69 cases (33.8%) the patient received medication during the emergency care episode, with oral delivery in 65% of cases, inhaled in 20.3%, nebulised in 7.2% and via the intravenous (IV), muscular or rectal route in 7.1%.
No procedures were done in 83.3% of children, and the rest underwent a mean of 1 to 2 procedures, while 2 patients underwent 5 different procedures. The median length of stay in the PED was 21minutes (Q1,10; Q3, 41.8; IQR, 31.8). Data on timeliness of triage and care delivery in the sample can be found in Table 1. The discharge destination was the home in 179 cases (87.7%) and hospital admission in the remaining 25 patients (12.2%).
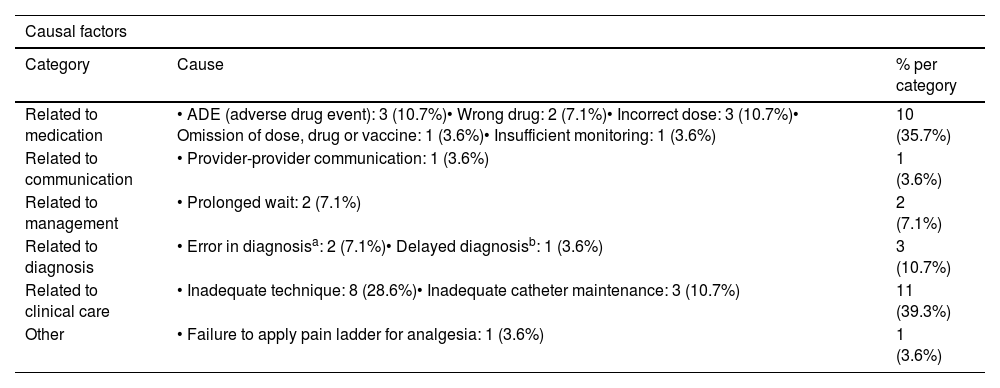
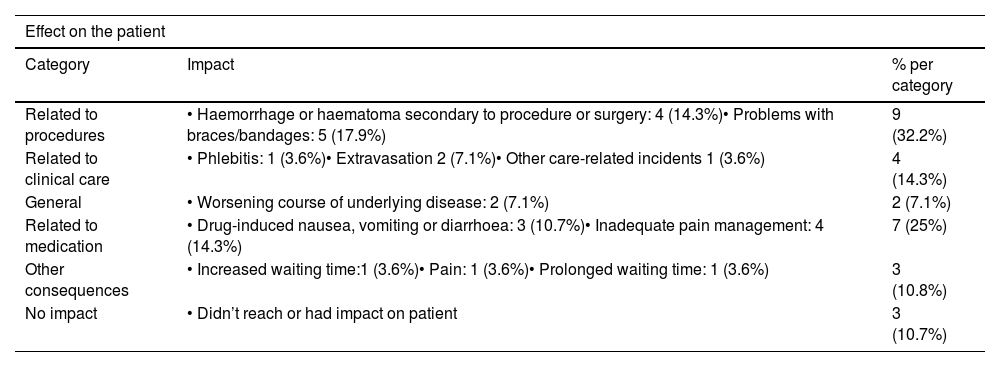
Safety incidentsAt least one incident was detected in 25 children (12.3%) in the sample, with 2 incidents detected in 3 patients, for a total of 28 incidents. Twelve incidents were detected during the care episode in the PED (42.9%), and the rest (16; 57.1%) through the telephone call a week later. Out of the incidents detected during the stay in the PED, 6 had been documented in the health record, 1 in the discharge summary, and the remaining 5 had not been documented. When it came to the impact on the patient, in 3 cases (10.7%) they did not reach the patient because they were detected in time, 2 (7.1%) reached but did not harm the patient and 23 (82.1%) reached and harmed the patient. The causal factors of the incidents and their effects are presented in Tables 3 and 4, respectively.
Distribution of factors identified as causes of safety incidents.
| Causal factors | ||
|---|---|---|
| Category | Cause | % per category |
| Related to medication | • ADE (adverse drug event): 3 (10.7%)• Wrong drug: 2 (7.1%)• Incorrect dose: 3 (10.7%)• Omission of dose, drug or vaccine: 1 (3.6%)• Insufficient monitoring: 1 (3.6%) | 10 (35.7%) |
| Related to communication | • Provider-provider communication: 1 (3.6%) | 1 (3.6%) |
| Related to management | • Prolonged wait: 2 (7.1%) | 2 (7.1%) |
| Related to diagnosis | • Error in diagnosisa: 2 (7.1%)• Delayed diagnosisb: 1 (3.6%) | 3 (10.7%) |
| Related to clinical care | • Inadequate technique: 8 (28.6%)• Inadequate catheter maintenance: 3 (10.7%) | 11 (39.3%) |
| Other | • Failure to apply pain ladder for analgesia: 1 (3.6%) | 1 (3.6%) |
Distribution of the effects of safety incidents on the patient.
| Effect on the patient | ||
|---|---|---|
| Category | Impact | % per category |
| Related to procedures | • Haemorrhage or haematoma secondary to procedure or surgery: 4 (14.3%)• Problems with braces/bandages: 5 (17.9%) | 9 (32.2%) |
| Related to clinical care | • Phlebitis: 1 (3.6%)• Extravasation 2 (7.1%)• Other care-related incidents 1 (3.6%) | 4 (14.3%) |
| General | • Worsening course of underlying disease: 2 (7.1%) | 2 (7.1%) |
| Related to medication | • Drug-induced nausea, vomiting or diarrhoea: 3 (10.7%)• Inadequate pain management: 4 (14.3%) | 7 (25%) |
| Other consequences | • Increased waiting time:1 (3.6%)• Pain: 1 (3.6%)• Prolonged waiting time: 1 (3.6%) | 3 (10.8%) |
| No impact | • Didn’t reach or had impact on patient | 3 (10.7%) |
As regards the care that the patient received as a result of the incident, in 13 incidents (46.4%) care delivery was not affected, in 8 (28.6%) the incident required another visit or referral, in 6 (21.4%) the patient required additional observation and in 1 (3.6%), further medical or surgical treatment. In the opinion of the evaluators, 22 incidents (78.6%) were preventable, and 14 incidents (50%) clearly resulted from an error.
Comparison of outcomes between groupsSafety incidents were detected in 25 (12.3%) of the 204 care episodes under study. We did not find significant differences in the frequency of incidents between children with and without chronic diseases. We also divided the patients in two categories, those who had experienced a safety incident and those who had not. The statistically significant differences between these two groups were the following:
- •
In the group with incidents, 12% of patients had a previous safety incident documented in the health record, compared to 2.85% in the group without incidents (P<.026).
- •
In the group with incidents, 64% of patients had at least one diagnostic test/procedure compared to 33% in the group without incidents (P<.02).
- •
More than one diagnostic test or procedure was performed in 50% of patients in the incident group compared to 10% in the group without incidents (P<.01).
- •
In the incident group, 72.7% of children received oral pharmacotherapy compared to 63.8% of patients without incidents. Also, 18.2% in the incident group received IV treatment compared to 1.7% in the group without incidents. None of the patients treated with inhaled drugs experienced incidents (P<.01).
- •
Twenty-eight percent of patients who experienced incidents were hospitalised compared to 4% of the patients who did not experienced incidents (P<.01).
- •
Forty-four percent of patients in the incident group underwent health care procedures compared to 12.8% of patients who did not experience safety incidents (P<.01).
We then compared the variables of interest in patients in whom safety incidents were detected during the care episode in the PED and those in whom they were detected in the follow-up telephone interview. All incidents detected in the telephone interview reached and harmed the patient, while 7.1% of incidents detected at the PED did not result in harm (P<.03). A possible explanation is that the parents or guardians of a patient may be more sensitive in identifying incidents that cause harm as opposed to those with the potential to cause harm, which are harder to detect. As regards the care received due to the incident, 53.8% of incidents detected in the PED did not result in changes to care, compared to 40% of incidents detected through the telephone interview. A greater proportion of incidents identified during the care episode required additional observation (38.5%) compared to incidents identified in the telephone interview (6.7%). Among the incidents identified in the telephone interview, 53.3% required an additional medical visit compared to 28.6% of incidents identified during the care episode (P<.009).
DiscussionA better understanding of the reach and harm produced by safety incidents is essential for the purpose of developing safety interventions aimed at reducing preventable harm12 and funnelling resources toward necessary system improvements.10 The follow-up of patients during care delivery in the PED allowed the identification of safety incidents and/or AEs; this observation was reinforced by the review of health records and the interview with the legal guardian of the child.
More than half of the incidents were detected in the follow-up at 1 week, in agreement with previous studies that found that up to 50% of safety incidents are detected within 7 days from the end of the care episode.7,13,14 However, the possibility that other incidents occurred and were not detected or occurred past that 7-day window cannot be ruled out. Thus, a study conducted in a hospital in Ottawa (Canada), in which a follow-up phone call was made 3 weeks after the care episode,15 detected safety incidents within this time frame in 2.5% of the patients (95% CI, 1.8%–3.5%). The authors determined that, overall, adverse events were most likely to occur in the first week after the emergency department visit, and none occurred in the third week. The incidence and/or prevalence of AEs in the PED is not well established, as most studies in the literature have a retrospective design16 and were conducted through the review of medical records and reports or data from reporting systems,17–19 omitting any events or incidents that have not been thus documented. This aspect needs to be taken into account in future research, for, while many authors advocate for assessment at 7 days, there is no methodological consensus about the optimal time frames for follow-up.
In our study, we found that at least 12% of children managed in the PED experienced a care-related safety incident. This percentage was higher compared previous studies in which the reported incidence of harm was of approximately 9%.10,15,20 These discrepancies could be due to the methodological differences between our study and previous works, such as the direct observation of patients during the care episode in the PED and the follow-up at 7 days from PED discharge.
In our study, we found an overall incidence of safety incidents of 12.3%, which was very similar to the incidence found in the EVADUR and ERIDA studies, of 12% and 12.04%, respectively. The profile of children who experienced PED care-related safety incidents was characterised by a more severe reason for the visit (triage levels 2 and 3), requiring more diagnostic tests and procedures and prescription of oral treatment (in which there could be dose errors) or IV treatment (in which handing of peripheral catheters could lead to complications). We also ought to highlight the occurrence of safety incidents in children with musculoskeletal complaints who required immobilization and/or bandaging, who developed haematomas or haemorrhage secondary to procedures or who had moderate to severe earache and did not receive adequate pain relief at home.
In our study, the identified risk factors for safety incidents were previous history of a safety incident and performance of diagnostic tests, with the risk increasing with the number of tests, which was also the case of procedures: the more procedures the patient underwent, the more likely a safety incident. Discharge to inpatient care was also associated with an increased frequency of safety incidents. When it came to medication-related risk factors, the oral route was associated with the highest risk, although all such incidents were detected in time and did not harm the patient. Inhalation was the sole route of administration for which no incidents were detected.
We ought to underscore that nearly 80% of incidents were deemed preventable, of which half resulted from a clear error, based on the judgment of the evaluators. Our study corroborated the low frequency of incident reporting and documentation in health records and notification forms, as half the incidents were not recorded.
Although we did not find significant differences in the occurrence of safety incidents between children with and without chronic diseases, different studies have found an increased incidence in chronically ill children associated to the greater number of drugs and interventions that they require.21–23 In our study, only 2 children with chronic conditions experienced safety incidents, both during the care episode. The first one needed a CT scan that entailed insertion of a peripheral catheter for sedation, which turned out to be complicated, as 4 attempts were made, producing cutaneous lesions and haematomas. The other patient required admission for close monitoring and administration of IV antibiotherapy, and developed phlebitis during the stay due to inadequate care. A study about medical errors in paediatric inpatients with chronic conditions in the United States published in Pediatrics in 2012,21 which analysed data for 3739 hospitals and 3.1 discharge summaries, found an overall of medical error rate per 100 discharges of 3.0 (95% CI, 2.8–3.3), which increased to 5.3 (95% CI, 4.9–5.7) in children with chronic conditions compared to 1.3 (95% CI, 1.2–1.3) in children without chronic conditions.
The main limitation of our study is that we did not include patients with triage level 1 due to ethical/legal constraints, as these patients require urgent care and the parents/legal guardians would not be able to provide informed consent prior to inclusion. There may also have been some form of bias in data collection associated with the emergency care setting (high volume of patients with multiple rooms and care pathways).
As regards future lines of research, we want to emphasise the lack of studies regarding paediatric care in the emergency medical system (EMS), a care setting on which evidence is required and that may offer opportunities for improvement, as quality is an issue that spans the entire care delivery process, and not only hospital-based care.
Our study evinced that AEs are a problem in the PED setting the awareness of which needs to be increased to enable the implementation of improvement measures and prevent the occurrence of new incidents, including: improvement of communication between health care providers, reviewing analgesia protocols (implementing a stepwise approach to analgesia in children with moderate to severe pain), electronic prescription and double-checking prior to administration of medication.
FundingThis research did not receive any external funding.
Conflicts of interestThe authors have no conflicts of interest to declare.