

A high prevalence of gastrointestinal (GI) symptoms has been described in children and adolescents with autism spectrum disorder (ASD). In addition, there is evidence that presence of GI symptoms is associated to greater severity of ASD. However, the frequency of GI symptoms in children and adolescents with ASD varies widely across studies, and their true prevalence is unknown. Therefore, the objective of this study was to estimate the prevalence of GI symptoms in children and adolescents with ASD.
Material and methodWe conducted a meta-analysis following the PRISMA guidelines. We carried out a rapid systematic search for recent clinical and observational studies published from August 2012 in PubMed. The statistical analyses were performed with the software R.
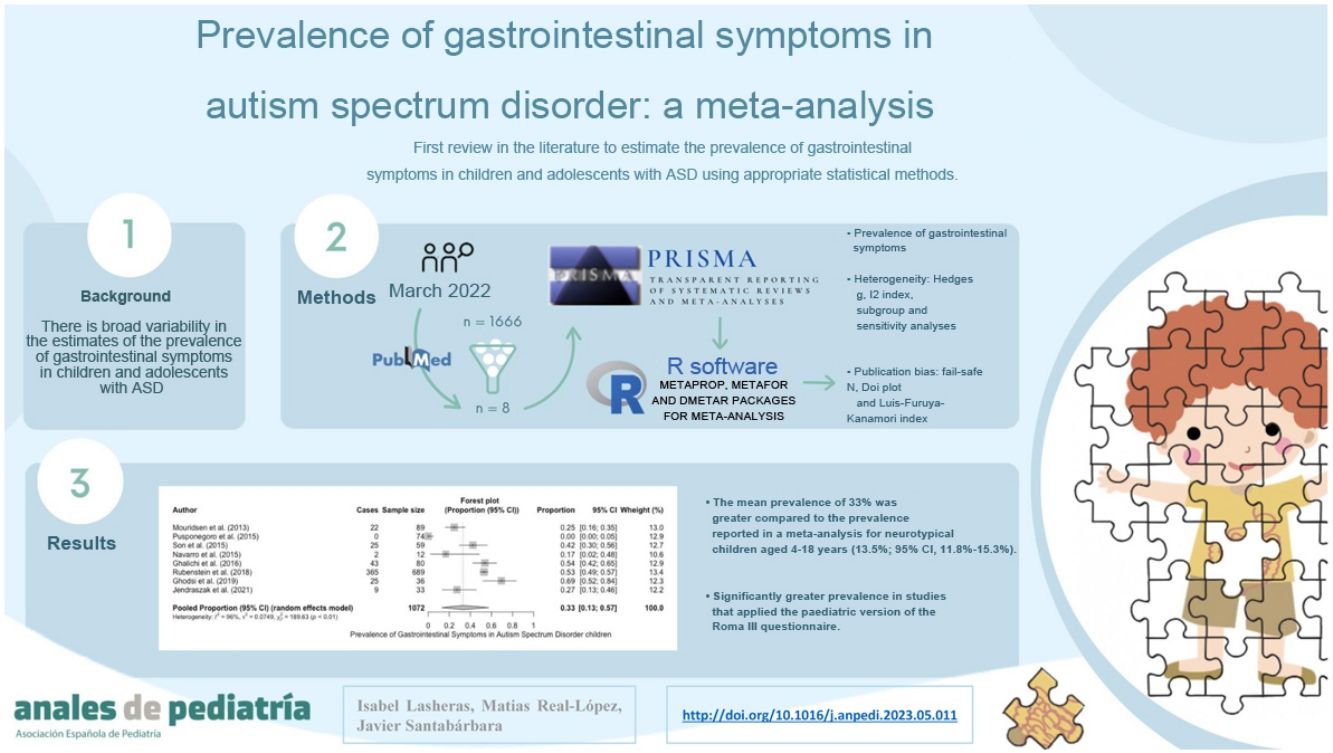
ResultsOf 91 potentially eligible articles, only 8 met our inclusion criteria. The prevalence of GI symptoms ranged between 0% and 69%, with an estimated general prevalence of 33% (95% CI, 13%–57%), higher than that reported by a previous meta-analysis for the general paediatric population. This difference is even greater in the specific comparison of studies that applied the paediatric version of the ROME III questionnaire (QPGS-ROME III).
ConclusionsThe results confirmed the hypothesis that there is a higher prevalence of functional GI symptoms in paediatric patients with ASD compared to their neurotypical peers.
Se ha descrito una elevada prevalencia de síntomas gastrointestinales (GI) en los niños y adolescentes con trastornos del espectro del autismo (TEA). Además, se ha relacionado la presencia de dichos síntomas con mayor gravedad de la clínica TEA. Sin embargo, la frecuencia de síntomas GI en niños y adolescentes con TEA es muy variable a lo largo de los estudios y no se conoce su verdadera prevalencia. Por tanto, el objetivo del presente trabajo fue estimar la prevalencia de síntomas GI en niños y adolescentes con TEA.
Material y métodoSe realizó un metaanálisis siguiendo las directrices PRISMA. Se llevó a cabo una búsqueda sistemática rápida de nuevos estudios clínicos y observacionales desde agosto de 2012 en PubMed. Los análisis estadísticos se realizaron con el software R.
ResultadosDe 91 artículos potencialmente elegibles, solo 8 cumplieron nuestros criterios de inclusión. La prevalencia de síntomas GI osciló entre el 0 y el 69%, con una prevalencia general estimada del 33% (IC del 95%: 13-57%), cifra superior a la reportada por un metaanálisis previo para la población general pediátrica. Esta diferencia es todavía mayor al comparar específicamente los estudios que emplean la versión pediátrica del cuestionario ROMA III (QPGS-ROME III).
ConclusionesEstos resultados confirman la hipótesis de que existe una prevalencia superior de síntomas GI funcionales en el TEA frente a sus coetáneos neurotípicos.
Autism spectrum disorders (ASDs) are a set of neurodevelopmental disorders characterised by persistent deficits in social interaction and communication and repetitive patterns of behaviour.1 Autism was first described in 1943 in a series of 11 children aged 2–5 years by psychiatrist Leo Kanner, who noted that 6 of them had difficulty feeding from infancy. Since then, multiple studies have explored the association between ASD, gastrointestinal (GI) symptoms and eating, contemplating the possibility of abnormal GI function in these children.2–4 In 2009, a panel of experts gathered at a symposium organised by the North American Society for Pediatric Gastroenterology, Hepatology, and Nutrition to review the literature published by 2012, which evinced that the reported prevalence of GI disorders in case series of children and adolescents with ASD ranged between 9% and 91%.4 Some studies have found that the presence of GI symptoms in autistic children is associated with an increased severity of the symptoms characteristic of ASD as well as additional symptoms (e.g. sleep disorders, anxiety, aggressive behaviour, hypersensitivity to certain stimuli),3,5,6 which could reflect an attempt on the part of the child to convey the experienced discomfort and are often the first warning sign of underlying GI problems.7 In this regard, the evidence suggests that the interaction between GI problems and the neuropsychiatric symptoms of ASD emerges from mechanisms involving the gut-brain axis that differ from those present in neurotypical (NT) children and adolescents,8,9 and some authors have proposed that the association of functional GI disorders and ASD could be considered an overlap syndrome that may benefit from nutritional and microbiota-targeted interventions.10
Still, the broad range of the prevalence estimates is indicative of a lack of agreement between studies and has cast a pall of uncertainty on many of the hypotheses that based on these results. A meta-analysis published in 2014 found an increased risk of functional GI symptoms in patients with ASD, most frequently diarrhoea, constipation and abdominal pain,11 although the prevalence of these disorders in children and adolescents with ASD remains unknown.
In light of the above, we conducted a meta-analysis with the aim of contributing estimates of the prevalence of GI symptoms in children and adolescents with ASD calculated with adequate statistical methods for the first time in the scientific literature.
Material and methodsThe meta-analysis adhered to the recommendations of the Preferred reporting items for systematic reviews and meta-analyses (PRISMA) statement12 (Appendix B, Supplemental Table 1).
Search strategyWe conducted a rapid systematic search of recent clinical and observational studies published from the date of publication of the review conducted by Coury et al. (01/08/2012)4 to present in PubMed via MEDLINE. The search strategy was the following: (Asperger’s OR Autism OR Autism spectrum disorder OR Autistic OR Pervasive developmental disorder OR PDD-NOS) AND (Abdominal pain/abdomen OR bloating OR Celiac OR Colitis OR Constipation OR Diarrhea OR Digestion OR Digestive disorders OR Disaccharidase OR Endoscopy OR colonoscopy OR Esophagitis OR Functional gastrointestinal disorder OR Gastroenterology OR Gastritis OR Gastrointestinal OR Gluten OR Gastroesophageal reflux OR Irritable Bowel Disease OR nausea OR reflux OR Vomiting).
Inclusion criteriaWe selected original articles that (1) reported data on the prevalence of GI symptoms or sufficient data to calculate it, (2) were conducted in a representative sample of children or adolescents with ASD (3) whose diagnosis of ASD was confirmed with a validated instrument, (4) published in English or Spanish and (5) for which the full text was available.
We excluded studies that preselected children and adolescents with GI comorbidities, whose samples did not include children or adolescents with ASD (e.g. coeliac disease, paediatric eating disorder, eosinophilic oesophagitis), or with samples that were not representative of children and adolescents with ASD for the purpose of estimating the prevalence of GI disorders (e.g. children with ASD who visited the emergency department due to constipation or who had received treatment before their GI symptoms were assessed).
Data collectionWe collected data on a form designed for the purpose, including the following fields: country, sample size, proportion of female patients, mean age and age range, instruments used to confirm the diagnosis of ASD and methods used for assessment of GI function.
Assessment of methodological qualityTo assess the quality of the studies, we used a tool developed for the critical appraisal of prevalence studies.13 We assessed quality based on 8 criteria, each rated on a scale from 0 to 1. In this critical appraisal system, 1 point was given for each of the following criteria that were fulfilled: (1) random sample or whole population, (2) unbiased sampling frame (i.e., census data), (3) adequate sample size (>30 subjects), (4) measures were the standard, (5) outcomes measured by unbiased assessors, (6) adequate response rate (>70%) refusers described, (7) confidence intervals and subgroup analysis, and (8) study subjects described. The possible total score ranged from 0 (poor quality) to 8 (high quality). Based on the total score, we classified studies as having a low (6–8), moderate (4–5) or high (0–3) risk of bias.
Statistical analysisWe pooled the data with generic inverse-variance weighting in an effects model,14 applying double-arcsine transformation to proportions to take into account the variability and heterogeneity in the prevalence rates reported in the included studies.15 Several studies16 have demonstrated that this adjustment may reduce the likelihood of false positives, especially when the number of studies is small. We present the main outcomes as proportions with the corresponding 95% confidence intervals (CIs) and the obtained heterogeneity statistic values.17
We assessed between-study heterogeneity with the Hedges g, considering results statistically significant if the P value was less than 0.10, and quantified it with the I2 index and the corresponding 95% CI.18 Index values of 25%–50%, 50%–75% and 75% or greater are considered indicative of low, moderate and high heterogeneity, respectively,19 indicating the degree to which the variance in the results obtained for a given exposure-disease association can be explained by sampling error. We carried out a subgroup analysis to explore the expected sources of heterogeneity in the meta-analysis of observational studies19 and a sensitivity analysis to determine the impact of individual studies on the overall results by omitting the data of each study one at a time.17 We did not perform a meta-regression, as the meta-analysis included fewer than 10 studies and the statistical power was insufficient.20
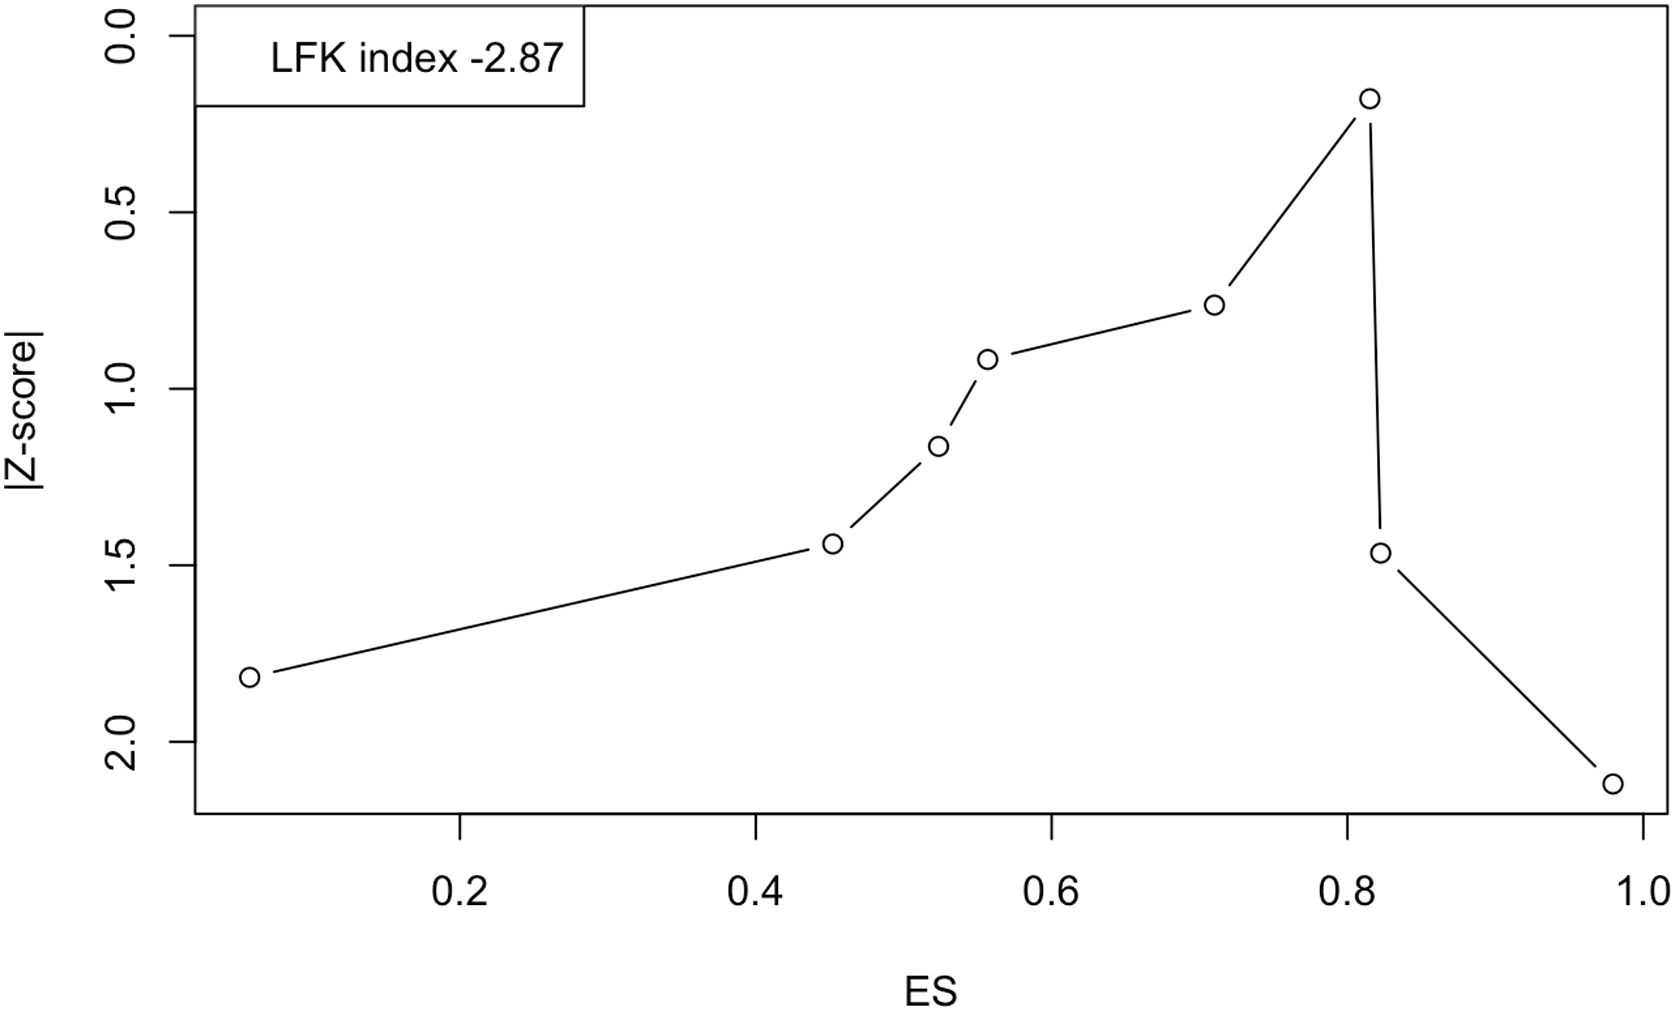
To assess the risk of publication bias, we calculated the fail-safe N, which is more precise than conventional funnel plots for meta-analysis of proportion studies21 and recommended when the analysis includes fewer than 10 studies.22 The fail-safe N indicates the number of nonsignificant, unpublished (or missing) studies that would need to be added to the meta-analysis to reduce an overall statistically significant result to nonsignificance, so that if the N is large relative to the number of observed studies, one can feel fairly confident in the conclusions.21 To make a graphical analysis of publication bias, we used the Doi plot and the Luis Furuya-Kanamori (LFK) index, which are particularly suitable for meta-analyses of proportions and offer a higher sensitivity and power than the funnel plot or Egger regression.23 As regards their interpretation, asymmetry in the Doi plot indicates potential publication bias, and the LFK index provides a numerical measure, with values ±1 considered to represent no asymmetry, values greater than ±1 but within ±2, minor asymmetry, and values greater than ±2, major asymmetry.
All the statistical analyses were performed with the R software, using the metaprop, metafor and dmetar packages for meta-analyses (https://www.r-project.org). We calculated two-tailed P values and considered values of less than 0.05 statistically significant, unless otherwise noted.
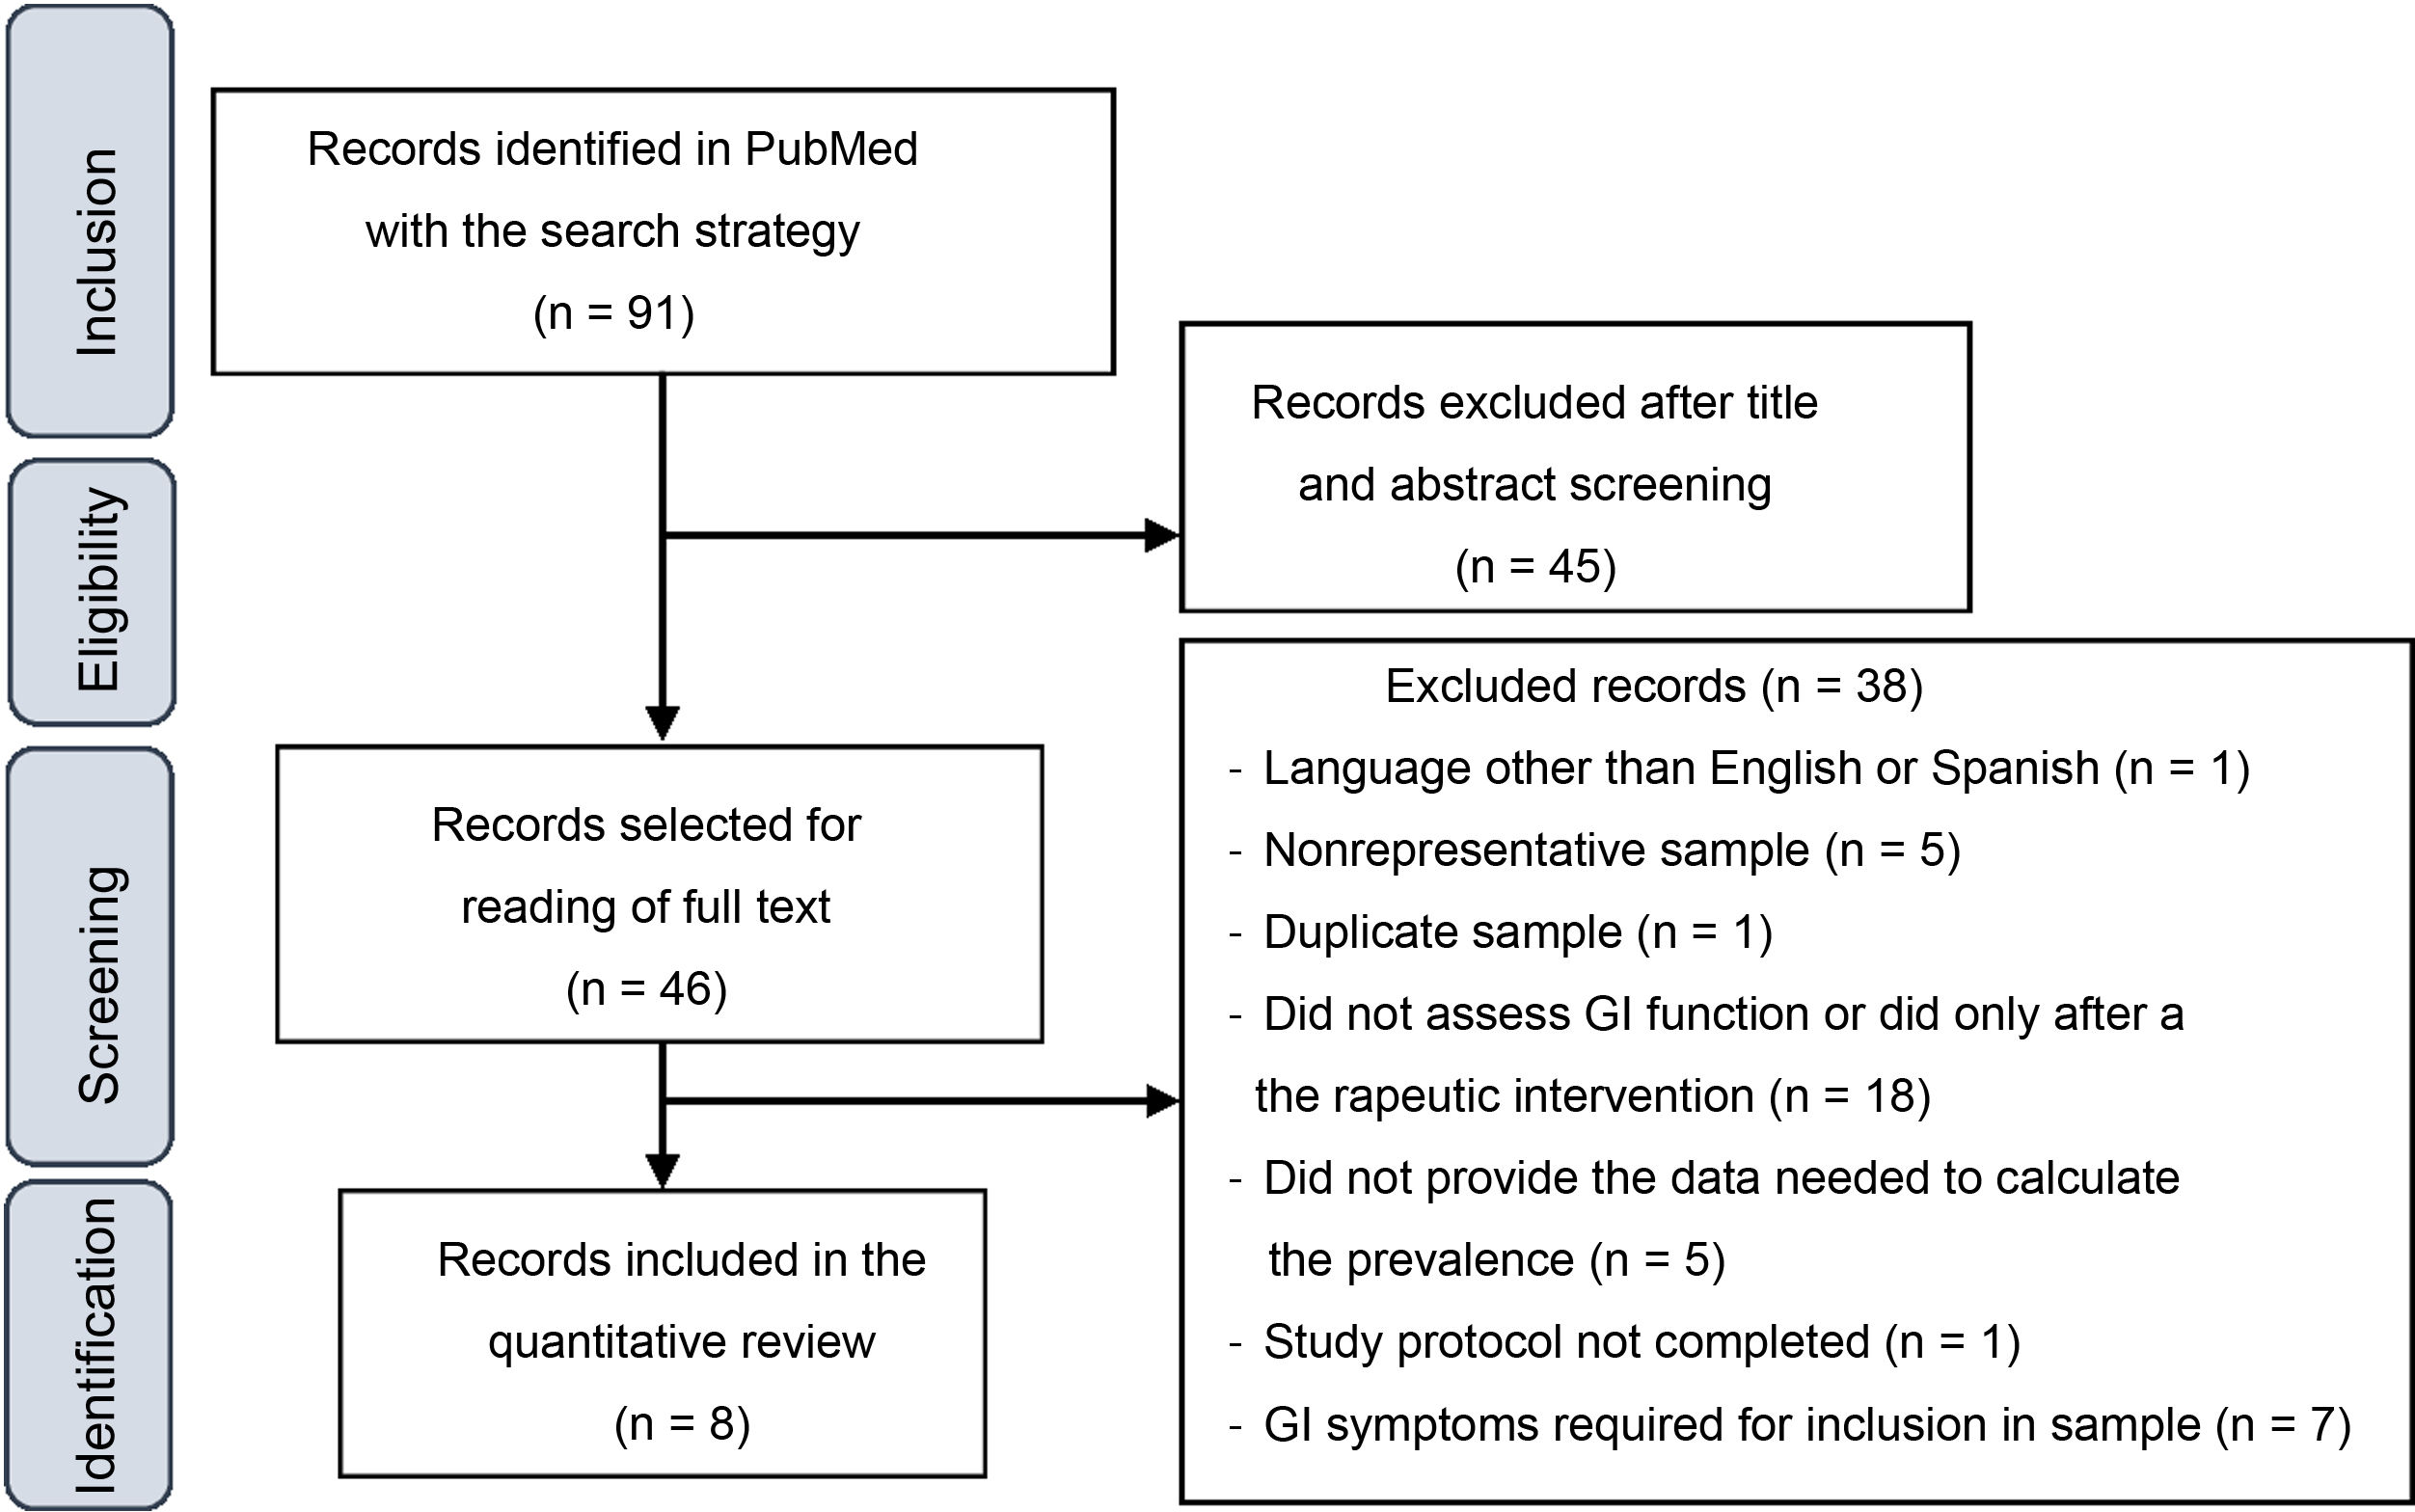
ResultsStudy selectionFig. 1 presents a flowchart of the article selection process. The initial search yielded 1666 articles, which were reduced to 91 after applying the following filters: Clinical Study, Clinical Trial, Comparative Study, Controlled Clinical Trial, Multicenter Study, Observational Study, Pragmatic Clinical Trial, Randomized Controlled Trial, 2012/08/01–2022/3/14.

After reading the titles and abstracts, 46 studies were selected for reading of the full text, after which 38 were excluded for the various reasons given in Fig. 1. At the end, 8 articles were included in the quantitative analysis of the prevalence of GI symptoms in children and adolescents with ASD.
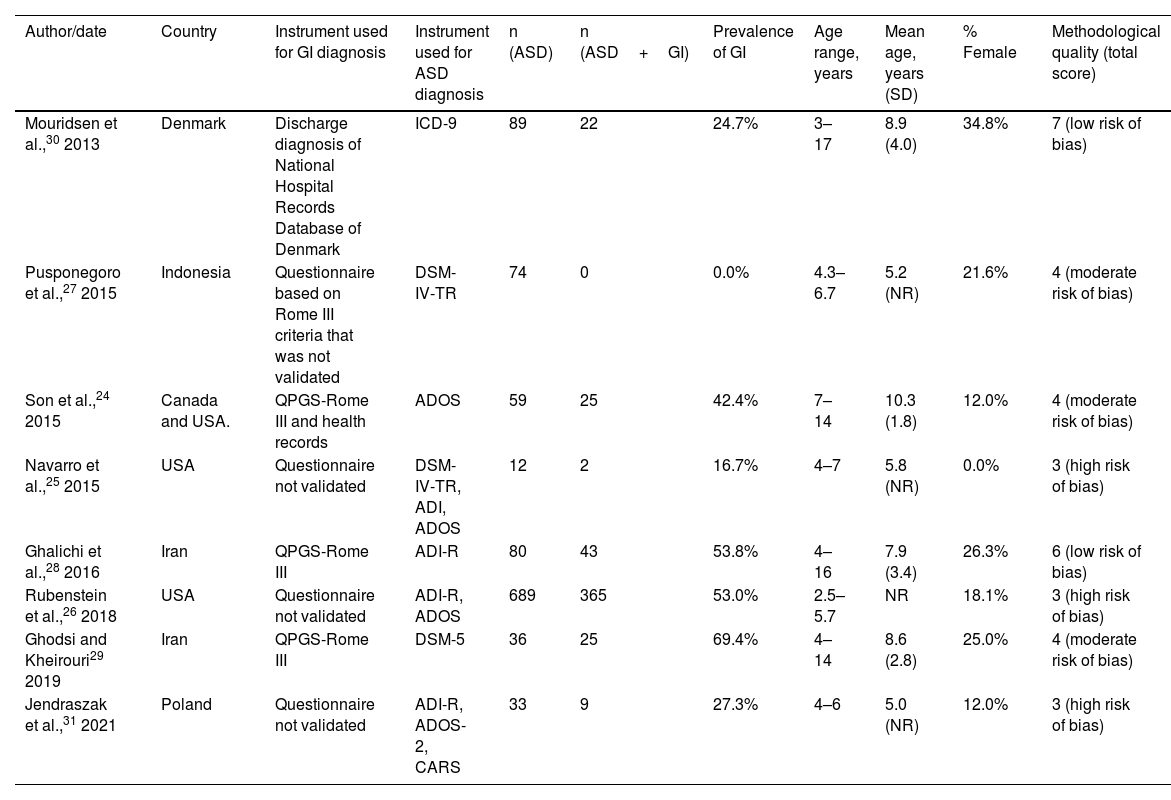
Description of selected studiesTable 1 presents the main characteristics of the 8 studies included in the quantitative review. Of all the studies, 37.5% were conducted in America,24–26 37.5%, in Asia27–29 and the remaining 25% in Europe.30,31 The sample sizes ranged from 12 to 689 children, with a mean size of 134 participants, which decreased to 54.7 with the exclusion of the largest study.31 The mean age was 7.7 years after adjusting for the sample size of each of the 7 studies that provided this information.24,25,27–30 Last of all, the proportion of female participants ranged between 0% and 34.8%, for an overall proportion of girls and female adolescents of 19.85% when the data were pooled.
Characteristics of the studies included in the quantitative review.
| Author/date | Country | Instrument used for GI diagnosis | Instrument used for ASD diagnosis | n (ASD) | n (ASD+GI) | Prevalence of GI | Age range, years | Mean age, years (SD) | % Female | Methodological quality (total score) |
|---|---|---|---|---|---|---|---|---|---|---|
| Mouridsen et al.,30 2013 | Denmark | Discharge diagnosis of National Hospital Records Database of Denmark | ICD-9 | 89 | 22 | 24.7% | 3–17 | 8.9 (4.0) | 34.8% | 7 (low risk of bias) |
| Pusponegoro et al.,27 2015 | Indonesia | Questionnaire based on Rome III criteria that was not validated | DSM-IV-TR | 74 | 0 | 0.0% | 4.3–6.7 | 5.2 (NR) | 21.6% | 4 (moderate risk of bias) |
| Son et al.,24 2015 | Canada and USA. | QPGS-Rome III and health records | ADOS | 59 | 25 | 42.4% | 7–14 | 10.3 (1.8) | 12.0% | 4 (moderate risk of bias) |
| Navarro et al.,25 2015 | USA | Questionnaire not validated | DSM-IV-TR, ADI, ADOS | 12 | 2 | 16.7% | 4–7 | 5.8 (NR) | 0.0% | 3 (high risk of bias) |
| Ghalichi et al.,28 2016 | Iran | QPGS-Rome III | ADI-R | 80 | 43 | 53.8% | 4–16 | 7.9 (3.4) | 26.3% | 6 (low risk of bias) |
| Rubenstein et al.,26 2018 | USA | Questionnaire not validated | ADI-R, ADOS | 689 | 365 | 53.0% | 2.5–5.7 | NR | 18.1% | 3 (high risk of bias) |
| Ghodsi and Kheirouri29 2019 | Iran | QPGS-Rome III | DSM-5 | 36 | 25 | 69.4% | 4–14 | 8.6 (2.8) | 25.0% | 4 (moderate risk of bias) |
| Jendraszak et al.,31 2021 | Poland | Questionnaire not validated | ADI-R, ADOS-2, CARS | 33 | 9 | 27.3% | 4–6 | 5.0 (NR) | 12.0% | 3 (high risk of bias) |
ADI, Autism Diagnostic Interview (-R, revised); ADOS, Autism Diagnostic Observation Schedule; DSM, Diagnostic and Statistical Manual of Mental Disorders (-TR, Text Revision); GI, gastrointestinal; ICD-9, International Classification of Diseases, Ninth Revision; NR, not reported; QPGS-Rome III, Questionnaire on Pediatric Gastrointestinal Symptoms Rome III version; 6-GSI, 6-Item Gastrointestinal Severity Index.
In 7 of the 8 studies, the diagnosis of ASD was confirmed by physicians, psychiatrists or psychologists at the time of recruitment using different validated diagnostic instruments.25–31 This was done through an in-person interview with the patient or the parents in all studies, except in one in which 2 psychiatrists reviewed the psychiatric records of the children to ensure they met the diagnostic criteria for ASD of the International Classification of Diseases, Ninth Revision (ICD-9).30 We included a single study that did not verify the diagnosis at the time of inclusion because the sample was recruited from a register of children with ASD that had undergone a thorough assessment by a doctor with a broad range of diagnostic tools, including the Autism Diagnostic Observation Schedule (ADOS).24
There was substantial heterogeneity in the methods chosen to assess GI function between studies. Only 37.5% applied the paediatric version of the Rome III questionnaire (QPGS-ROME III),24,28,29 which is widely recommended for diagnosis of functional GI disorders.31 One study used a variation of this questionnaire (12.5%)27 and another analysed the discharge diagnoses of GI disorders in the national health records database, classified with the ICD coding system.30 The remaining 37.5% used different questionnaires that had not been validated to assessed various GI symptoms.25,26,31 The items more frequently included in the assessment across studies were constipation or hard stools (analysed in 87.5% of the studies),24–29,31 abdominal pain (75%),24–29 vomiting or nausea (75%),24–29 abdominal distension/flatulence/aerophagia/excess gas (75%)24,27–29,31 and diarrhoea or soft stools (62.5%).24–27,31 Some studies also included nonspecific categories (“other”).26,30
We ought to mention that the only study that analysed diagnosed GI disorders did not restrict the search to functional disorders,30 and neither did another study that also assessed functional and organic disorders, such as diseases of the pancreas or liver, coeliac disease or lactose intolerance.31
As regards the quality of the studies, 2 were classified as low risk of bias28,30 and 3 as high risk of bias.25,26,31 The main limitation found in all studies was the lack of reporting of confidence intervals for prevalence calculations and subgroup analysis results, in addition to the lack of a population-based sampling frame, with the exception of the study of Mouridsen et al.30 (Table 1, Appendix B, Supplemental Table 2).
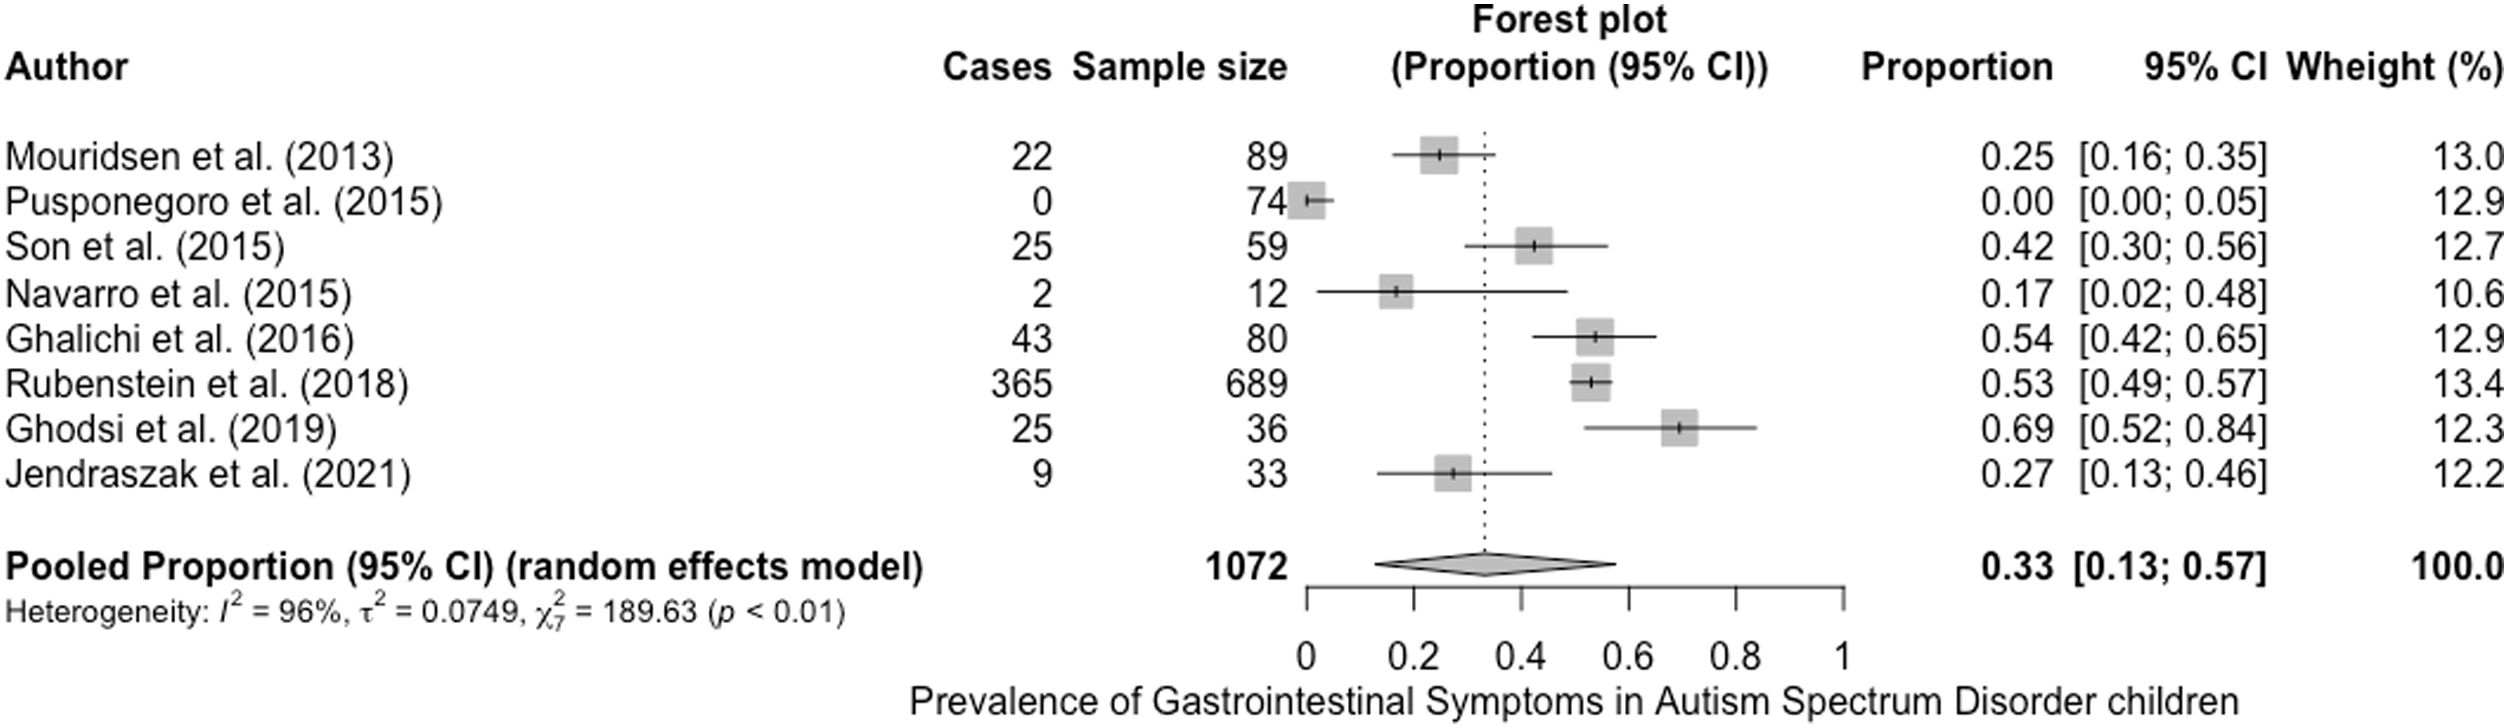
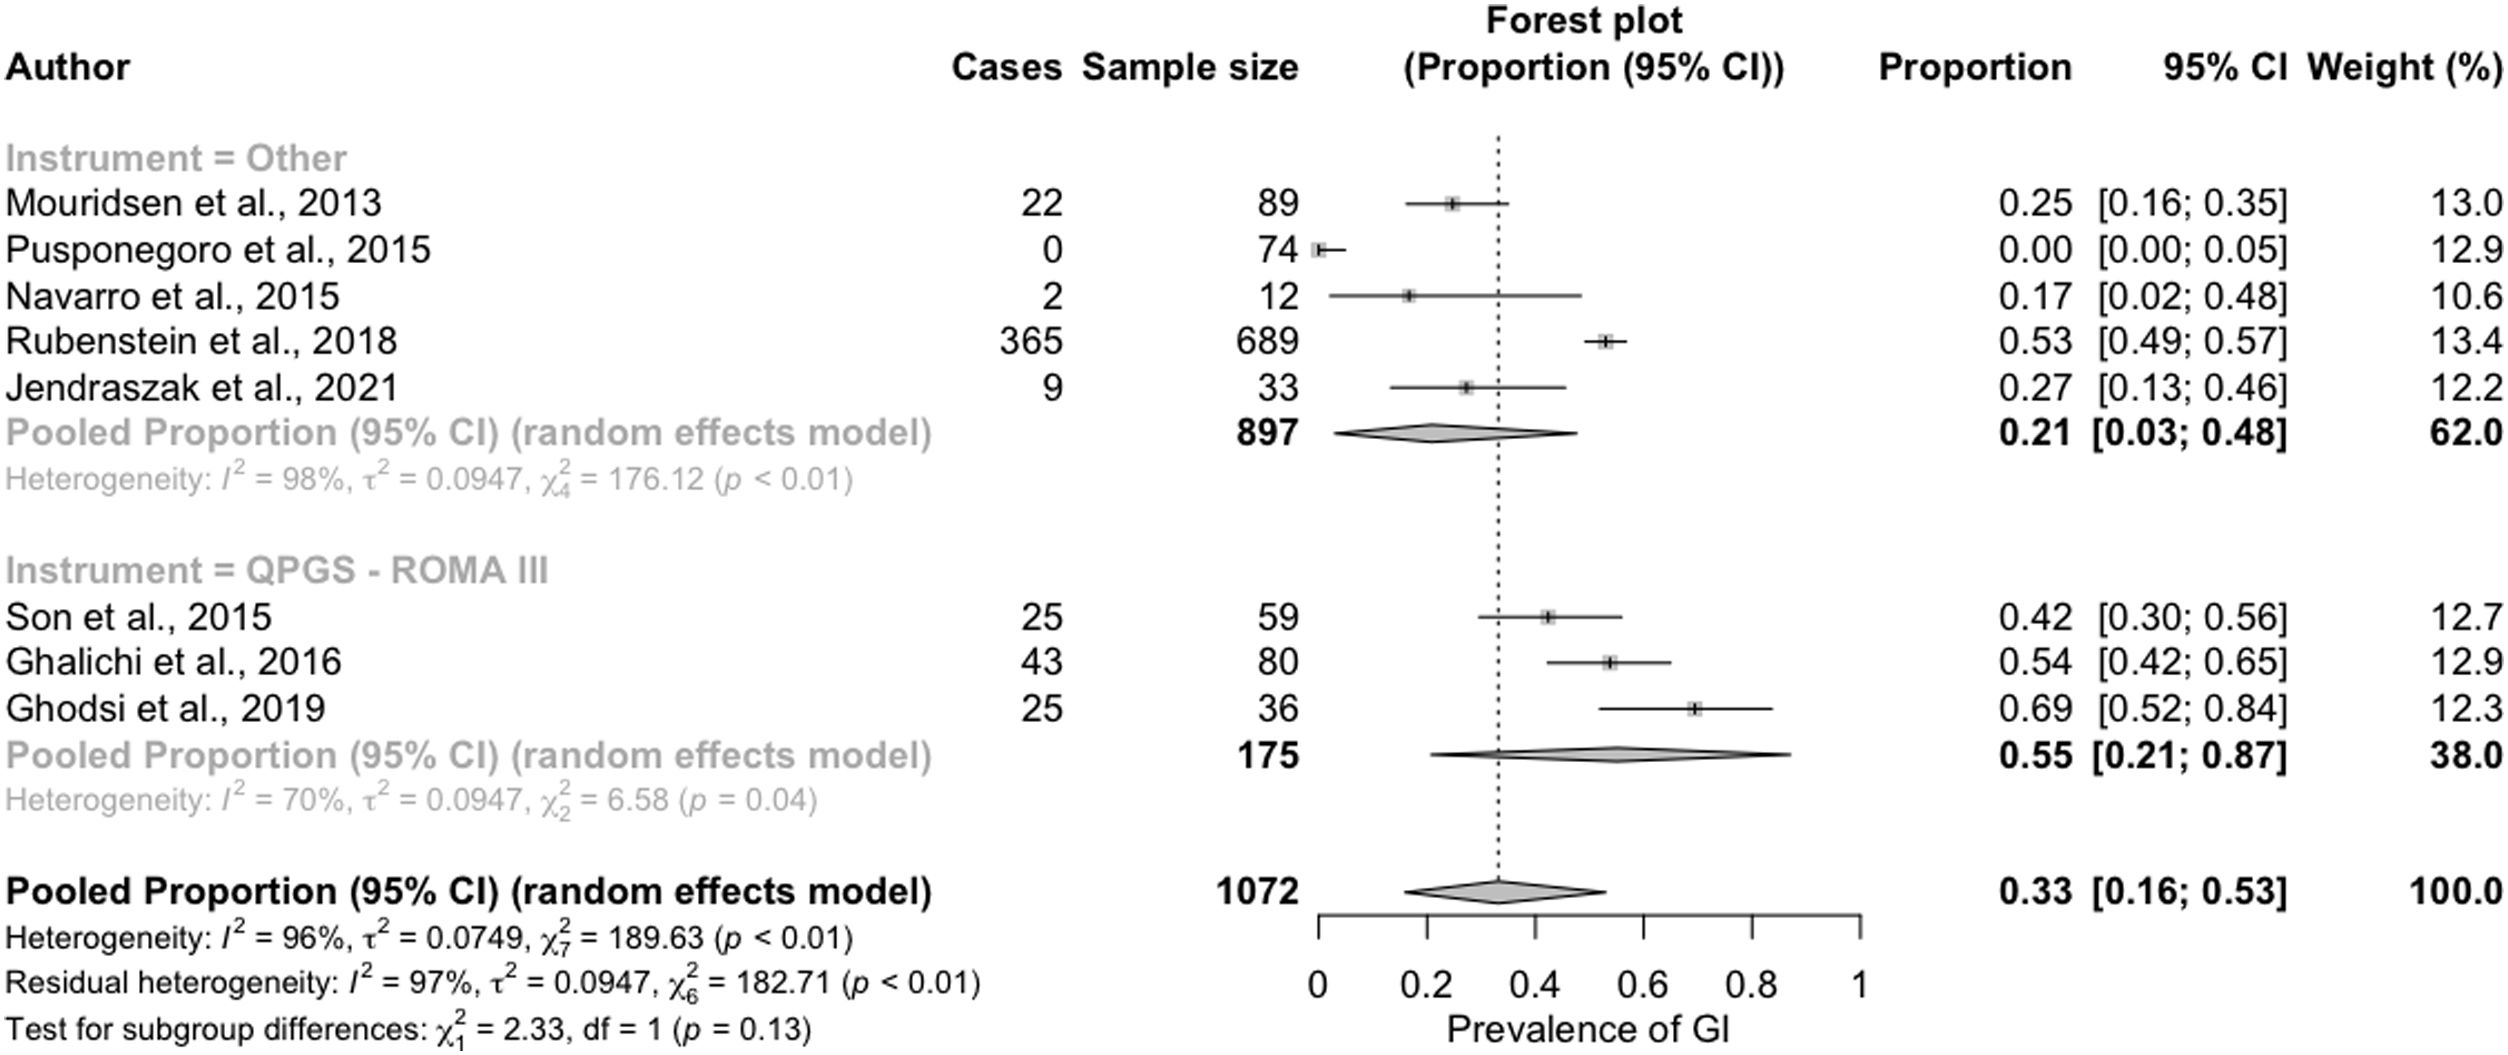
The prevalence of GI symptoms ranged from 0%27 to 69%29 (Table 1; Fig. 2). We estimated an overall prevalence of GI symptoms of 33% (95% CI, 13%–57%), with significant heterogeneity between studies (g test: P<.01; I2=96%)

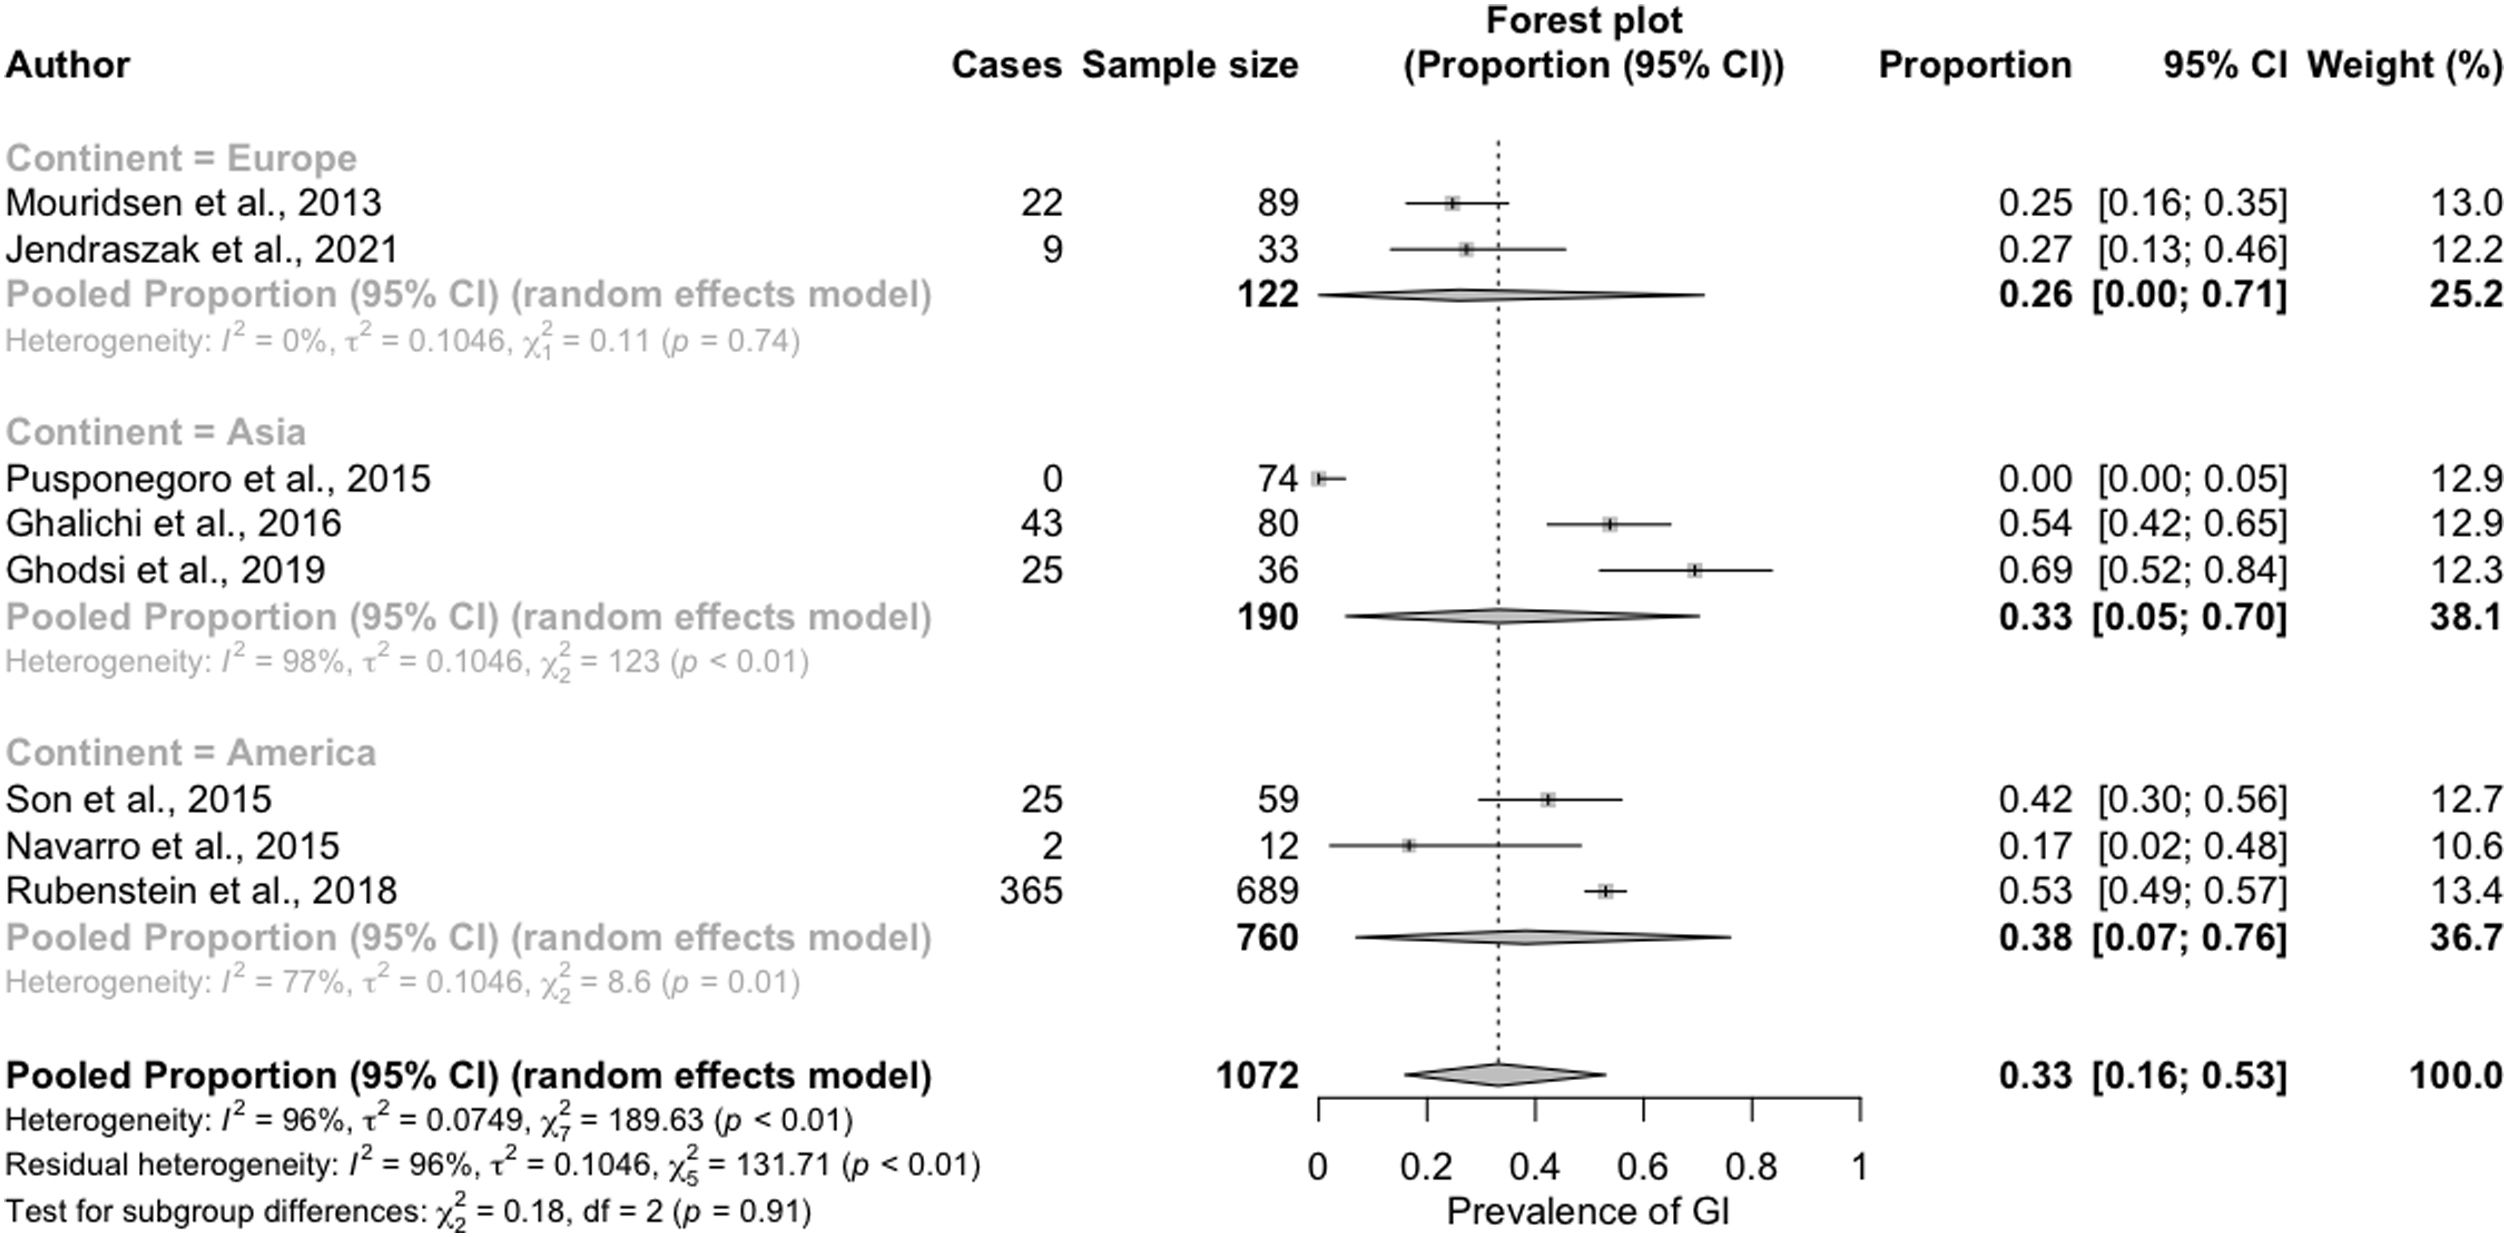
In the subgroup analysis conducted to identify the sources of heterogeneity, we that the reported prevalence of GI symptoms was greater in the studies conducted in America (38%; 95% CI, 7%–76%) or Asia (33%; 95% CI, 5%–70%) compared to those conducted in Europe (26%; 95% CI, 0%–71%). This difference, however, was not statistically significant (Fig. 3).

We also found a greater prevalence of GI symptoms in studies that applied the QPGS-Rome III QPGS questionnaire (55%; 95% CI, 21%–87%) compared to those that used other measures (21%; 95% CI, 3%–48%) (Fig. 4).

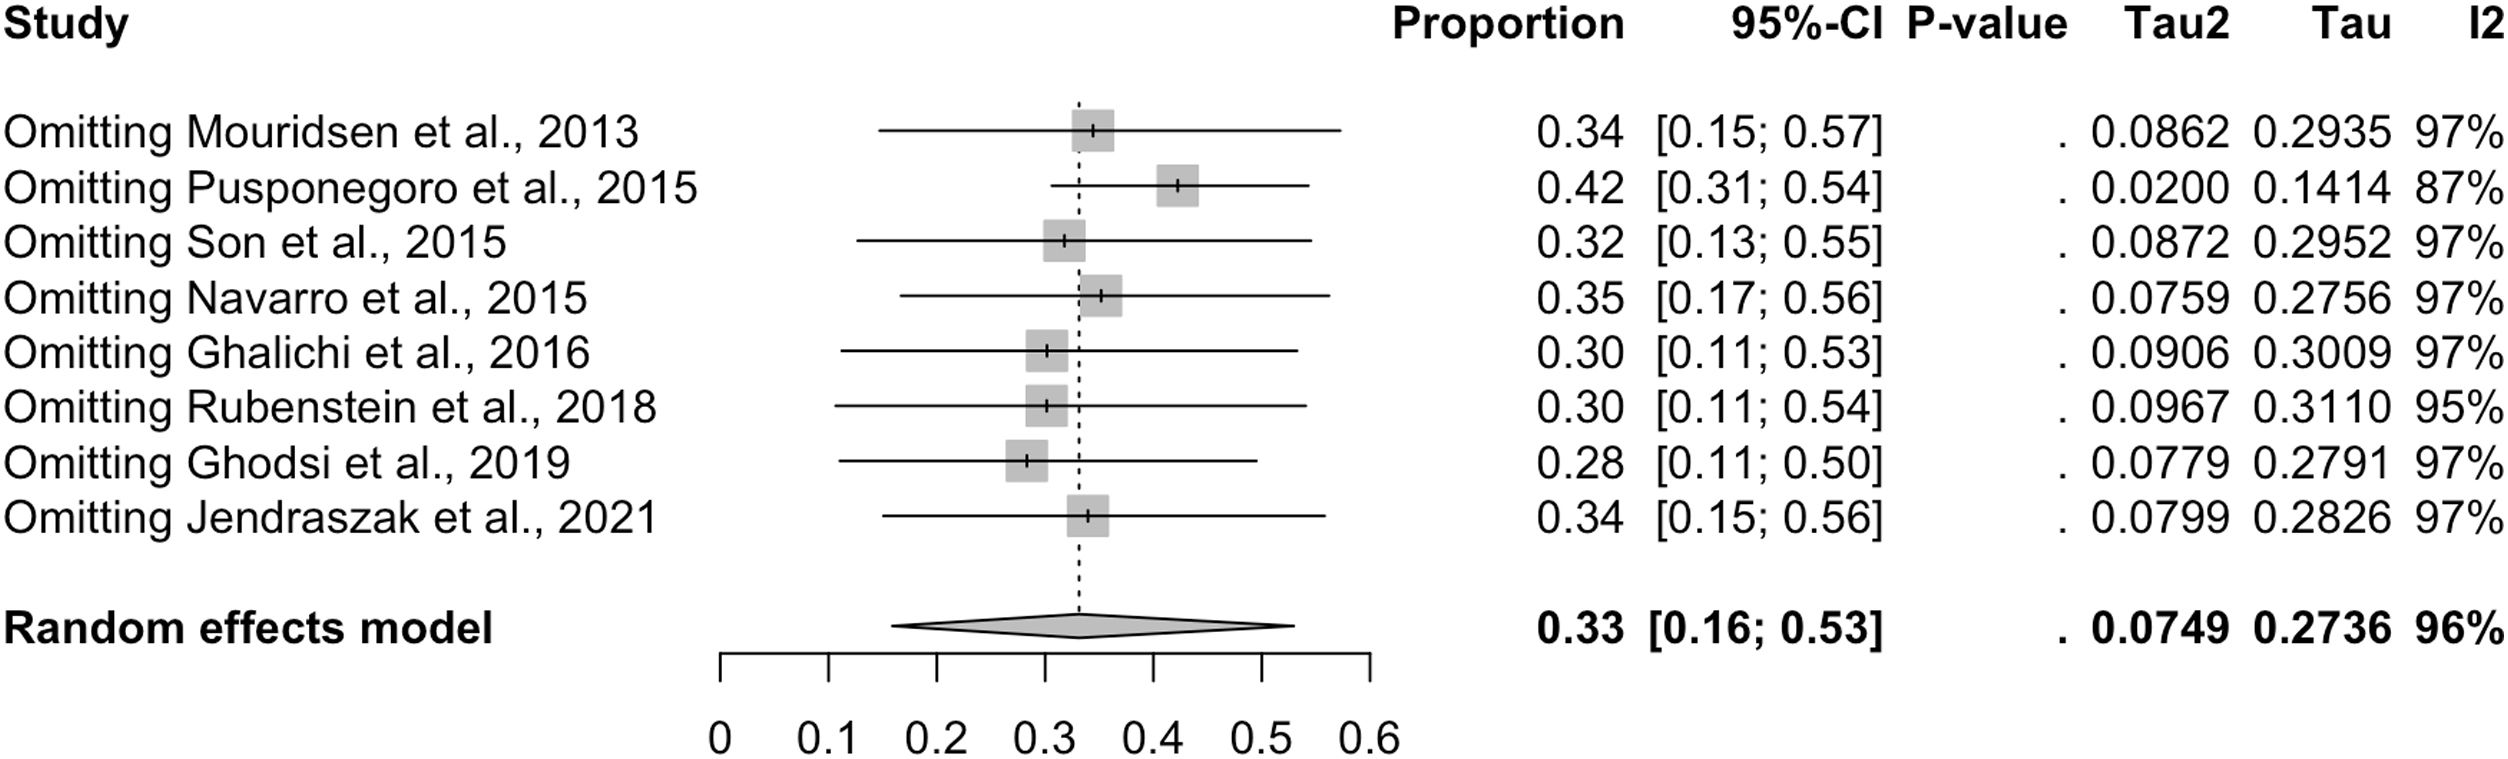
The exclusion from the analysis of each of the studies one by one did not change the overall prevalence of GI symptoms obtained from the pooled data, which ranged from 28% (95% CI, 9%–53%) with the exclusion of the study by Ghodsi and Kheirouri29 to 42% (95% CI, 26%–59%) with the exclusion of the study by Pusponegoro et al.27 (Fig. 5). This indicates that none of the studies had a disproportionate impact on the overall prevalence of GI symptoms.

Last of all, Fig. 6 shows the Doi plot and the obtained LFK index of −2.87, indicative of major asymmetry, and therefore of a probable publication bias. However, the value of the fail-safe N was 730, which suggests that 730 studies with null results would be required to reduce the observed overall prevalence to nonsignificance.
Discussion
In this meta-analysis, we estimated a prevalence of GI symptoms in children with ASD of 33% (95% CI, 13%–57%), greater than reported in a meta-analysis published in 2015 of GI symptoms in the general paediatric population aged 4–18 years (13.5%; 95% CI, 11.8%–15.3%).32 Although this comparison has limitations, since 2 studies in our meta-analysis included children younger than 4 years,26,30 a study published in 2018 showed that there are no significant differences in the prevalence of GI symptoms between children aged 0–3 years and children aged 4–18 años.33 These findings corroborate the results of the previous meta-analysis of 2014, which estimated an odds ratio of 4.42 for the probability of GI symptoms in children and adolescents with ASD compared to their neurotypical same-age peers.11
Another limitation of our study is that there was some heterogeneity in the criteria used to assess GI disorders in the analysed studies, as some excluded organic disorders25,26,31 and others did not.30 In fact, the Rome III questionnaires, recommended by the Sociedad Española de Pediatría Gastroenterología, Hepatología y Nutrición Pediátrica (Spanish Society of Paediatric Gastroenterology, Hepatology and Nutrition) for diagnosis of functional GI disorders in the paediatric population, specifically include the absence of evidence of any organic disorder as a diagnostic criterion in every case definition.34 This requirement was eliminated in the most recent version of the criteria (Rome IV), to be replaced by “after appropriate medical evaluation, the symptoms cannot be attributed to another medical condition”.35
For this reason, we considered particularly relevant to highlight that the difference in the prevalence of GI symptoms was greater when we specifically compared studies that applied the QPGS-Rome III criteria, which was estimated at 55% (95% CI, 21%–87%) in children and adolescents with ASD compared to 16.4% (95% CI, 13.5%–19.4%) in the general paediatric population.32
Thus, we recommend the use of validated questionnaires for diagnosis of functional GI disorders in this population, as it could facilitate the analysis of aggregate data in the future. Furthermore, since the presence of GI symptoms has been proposed as a modulator in the aetiology and pathogenesis of ASD36 and the response to different nutritional therapies, we think that it may be relevant to perform a disaggregate analysis based on the presence or absence of GI symptoms when assessing the effect of these interventions, as some authors have done in the past,37 to determine whether their effect on the severity of ASD is mediated by the presence of GI symptoms or independent from it.
Last of all, we ought to highlight that one of the main limitations of this study is that, since it was a rapid systematic review, the search was conducted in a single database, applying restrictive filters that probably led to missing studies that met the established inclusion criteria. As a result, the meta-analysis included a small number of studies and we could not make an analysis disaggregated by symptom. However, PubMed is the largest database in the medical literature38 and there is evidence that the meta-analysis of a small number of studies can yield valid conclusions,39 which underscores the value of the present work, especially in light of the substantial variation in the reported prevalence among the studies found in the current literature, which makes their interpretation, absent a quantitative analysis, purely speculative. In addition, we found considerable heterogeneity in the results of the different studies included in the meta-analysis, which could compromise the value of aggregating results with meta-analysis methods. However, as Cuijppers (2016), integrating the results of multiple studies in a meta-analysis has several advantages: by combining individual studies, the statistical power to detect effects (or their absence) is greater than for individual studies. This allows a more precise and accurate estimation of the true effect. Since the studies included in a meta-analysis are examined systematically, it is also possible to explore inconsistencies between studies and to examine whether the effects differ among specific subgroups of studies.40
ConclusionIn this meta-analysis, the prevalence of GI symptoms in children and adolescents with ASD ranged between 0% and 69%, with an estimated overall prevalence of 33% (95% CI, 13%–57%), a proportion that was not affected significantly by the mean age at the start of follow-up, patient sex or continent where the study was performed, but which turned out to be significantly greater in the disaggregate analysis that only included studies that applied the paediatric version of the Rome III questionnaire.
Still, the significant between-studies heterogeneity evinced by the Hedges g calls for caution in the interpretation of the results of the meta-analysis.
For the purpose of minimising these methodological limitations in the future, we recommend the use of validated questionnaires for the diagnosis of functional GI disorders in the paediatric population with ASD, specifically, the Rome IV criteria, a tool endorsed by the main societies of paediatrics for the diagnosis and severity assessment of functional GI symptoms.
Conflicts of interestThe authors have no conflicts of interest to declare.
The following is Supplementary data to this article: