
In critically ill patients, nutritional support is a challenge in terms of both estimating their requirements and ensuring adherence to the prescribed treatment.
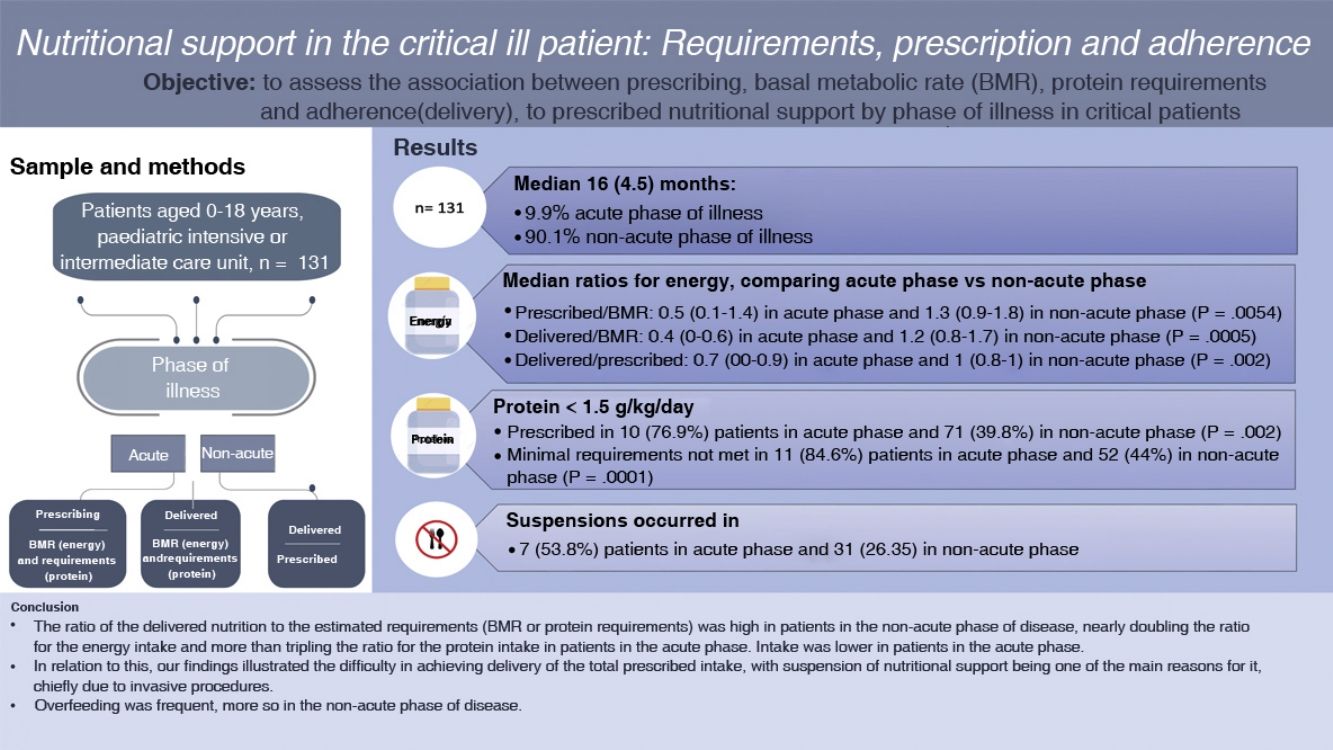
ObjectiveTo assess the association between requirements, prescription and adherence to energy and protein supplementation based on the phase of disease in critically ill patients.
Sample and methodsWe conducted a prospective, observational and analytical study in patients aged 0–18 years admitted to the paediatric intensive or intermediate care unit in 2020–2021. We collected data on demographic and anthropometric characteristics and the phase of disease (acute phase [AP] vs. non-acute phase [nAP]), in addition to prescribing (P) (indication of nutritional support), basal metabolic rate (BMR, Schofield equation), adherence to nutritional support (A) and protein requirements (R), and calculated the following ratios: P/BMR, P/R, A/BMR, A/R, and A/P.
ResultsThe sample included 131 participants with a median age of 16 (4.5) months, of who 128 (97.7%) had comorbidities and 13 (9.9%) were in the AP. Comparing the phases of disease (AP vs. nAP), the median values for energy supplementation were P/BMR, 0.5 (IQR, 0.1–1.4) vs. 1.3 (IQR, 0.9–1.8) (P = 0.0054); A/BMR, 0.4 (IQR, 0–0.6) vs. 1.2 (IQR, 0.8–1.7) (P = 0.0005); A/P, 0.7 (IQR, 0–0.9) vs. 1 (IQR, 0.8–1) (P = 0.002), and for protein were P/R, 0.7 (IQR, 0–1.1) vs. 1.2 (0.9–1.6) (P = 0.0009); A/R 0.3 (IQR, 0–0.6) vs. 1.1 (IQR, 0.8–1.5) (P = 0.0002); A/P 0.7 (IQR, 0–1) vs. 1(IQR, 0.8–1) (P = 0.002). We found AP/nAP ratios greater than 110% for energy in the P/BMR (4 patients [30.8%]/72 patients [61%]; P = 0.007), A/BMR (3 [23%]/63 [53.4%]; P = 0.009) and A/P (1 [7%]/3 [2.5%]; P = 0.007). As for protein, more than 1.5 g/kg/day was prescribed in 3 patients (23.1%) in the AP and 71 (60.1%) in the nAP. We found adherence to the prescribed intake in 2 (15.4%) patients in the AP and 66 (56%) in the nAP. We found a correlation coefficient of 0.6 between the energy P/R and the protein P/R. Prescribed support was discontinued in 7 patients (53.8%) in the AP and 31 (26.3%) in the nAP (P = 0.002).
ConclusionsThe proportion of adherence to prescribed nutritional support was high in patients in the nAP of the disease. Overfeeding was frequent, more so in the nAP. We identified difficulties in adhering to prescribed support, chief of which was the discontinuation of feeding.
El soporte nutricional en el paciente crítico es un desafío tanto en la estimación de requerimientos como en el cumplimiento de su prescripción.
ObjetivoEvaluar las relaciones entre la prescripción, el requerimiento y el cumplimiento del soporte nutricional de energía y proteínas según la fase de la enfermedad en el paciente crítico.
Pacientes y métodoEstudio observacional, analítico, de datos obtenidos a través de reclutamiento prospectivo (2020–2021), pacientes de 0–18 años hospitalizados en la unidad de cuidados intensivos o intermedios pediátrica. Se obtuvieron datos demográficos, antropométricos y del estado agudo (FA)/no agudo (FNA) de la enfermedad. Se determinaron la prescripción (P) (indicación nutricional), el gasto energético basal (GEB) (fórmula de Schofield), el cumplimiento (C) de soporte nutricional, el requerimiento (R) proteico, creándose las siguientes relaciones: P/GEB, P/R, C/GEB, C/R, C/P.
ResultadosSe incluyeron 131 sujetos con una mediana de 16 (4,5) meses; el 97,7% presentaban alguna comorbilidad y el 9,9% cursaban en FA. Al comparar FA/FNA tuvieron mediana (RIC) de energía: P/GEB 0,5 (0,1–1,4)/1,3 (0,9–1,8) (p = 0,0054); C/GEB 0,4 (0–0,6)/1,2 (0,8–1,7) (p = 0,0005); C/P 0,7 (0–0,9)/1 (0,8–1) (p = 0,002). Y proteínas: P/R 0,7 (0–1,1)/1,2 (0,9–1,6) (p = 0,0009); C/R 0,3 (0–0,6)/1,1 (0,8–1,5) (p = 0,0002); C/P 0,7 (0–1)/1 (0,8–1) (p = 0,002). Se encontró para energía FA/FNA > 110% en P/GEB en 4 pacientes (30,8%)/72 (61%) (p = 0,007), C/GEB en 3 pacientes (23%)/63 (53,4%) (p = 0,009) y C/P en 1 (7%)/3 (2,5%) (p = 0,007). En proteínas se prescribió > 1,5 g/kg/día en 3 (23,1%) pacientes en FA y 71 (60,1%) en FNA. El cumplimiento de este aporte fue de 2 (15,4%) pacientes en FA y 66 (56%) en FNA. Se encontró un coeficiente de correlación de 0,6 entre P/GEB de energía con P/R proteico. La suspensión fue de 7 (53,8%) pacientes en FA y 31 (26,3%) en FNA (p = 0,002).
ConclusionesLa relación de cumplimiento de la prescripción fue alta en pacientes en FNA de la enfermedad. La sobrealimentación fue frecuente, siendo mayor en FNA. Se observó dificultad para cumplir la prescripción, siendo la causa principal la suspensión de la alimentación.

The nutritional support of critically ill patients continues to be a challenge for the care team. It is difficult to estimate the requirements of these patients, select the route of delivery and assess adherence due to the characteristics of medically complex patients, who experience shifting disease dynamics and metabolic stress that further complicate the delivery of nutritional support.1 Critical illness is conceived as having three phases.2 The acute phase may last from hours to days, during which the main goal of treatment is to maintain the functions of vital organs, and is characterised, among other features, by an increase in inflammation, the involvement of counterregulatory hormones, protein and fatty acid catabolism and peripheral inactivation of thyroid hormones and insulin-like growth factor 1 (IGF1). It is followed by the stable phase, characterised by stabilization or weaning of vital organ support, which lasts from a few days to weeks. Last of all, there is the recovery phase, during which metabolic, endocrine and immunological disturbances normalise and protein anabolism increases.3 Depending on the phase of illness, there are changes in energy4 and protein requirements and enteral tolerance,5,6 haemodynamics and fluid and electrolyte balance in addition to metabolic and endocrine changes.7
International guidelines agree that energy requirements during the acute phase of illness should be calculated by means of indirect calorimetry or, if not available, the factorial method (Schofield equation).8,9 One meta-analysis estimated that the Schofield equation, whether using only the weight or both the weight and the height, could predict the basal metabolic rate (BMR) with an error of ±15%.10,11 When it comes to protein, current guidelines recommend guaranteeing an intake of at least 1.5 g of protein per day during the acute phase.8,12,13
Delivering adequate nutritional support in this clinical context is challenging, and malnutrition is a frequent problem in critically ill paediatric patients. On one hand, providing an excessive amount of nutrients may lead to overfeeding, which carries a risk of cellular damage and metabolic disturbances,14 while an insufficient intake is associated with increases in morbidity, mortality and length of stay.4,15,16 Insufficient nutrient delivery is usually due to either prescribing of insufficient doses or poor adherence.17,18 There are many reasons that may contribute to inadequate adherence to prescribed nutrition, which may be related to the phase of illness; changes in gastrointestinal motility are more frequent during the acute phase, as are haemodynamic, metabolic and endocrine changes. This determines the number of required procedures, the need of fluid restriction etc.,19 which, in plain terms, are associated with an increase in the number of interruptions and decrease in adherence to prescribed nutrition.17 There is substantial variability between previous studies in the reported nutrients delivered in relation to the nutrients prescribed, ranging from 25% to 59% of the prescribed energy intake and 32.7%–93.6% of the prescribed protein intake,4,11,20–22 depending on the population under study, the expertise of the care time, the estimated time elapsed to achievement of nutritional goals, the availability of systems to monitor nutrition, the use of protocols and the severity of disease.1,16,23,24
The aim of our study was to assess the association between prescribing, requirements and adherence with nutritional support, specifically the energy and protein intake, based on the phase of disease in critically ill paediatric patients.
Sample and methodsWe conducted a prospective observational descriptive and analytical study.
We included patients aged 0–18 years admitted for a minimum of 24 h to the paediatric intensive and intermediate care unit of the Hospital Clínico of the Pontificia Universidad Católica between August 2020 and January 2021. We excluded patients predominantly fed by the oral route, defined as receiving more than 70% of prescribed nutrition through this route, and patients admitted for an elective procedure for multidisciplinary assessment in the absence of acute illness.
For the total study period, we selected 3 days per month at random using Excel. The principal investigator collected the data for the past 24 h by reviewing the medical and nursing records for the patients. This amounted to a total of 18 days of data, which were then anonymised and coded for subsequent analysis.
The study was exploratory and the patients were selected by convenience sampling.
We collected data on the following variables: sex, age (in complete months), weight (kg) and height (cm) at admission, diagnosis at admission (respiratory, cardiovascular, neurologic, infectious, trauma/orthopaedics, haematological/oncological, postsurgical, other), comorbidity (yes/no; defined as the presence of any disease concomitant to the primary diagnosis at admission) and type of comorbidity (respiratory, cardiovascular, neurologic, infectious, trauma/orthopaedics, haematological/oncological, postsurgical, other). The nutritional status of the patient was assessed using the 2006 World Health Organization (WHO) child growth standards for children aged 0–5 years25 and the 2007 WHO growth reference data for children aged 5–18 years26 as reference, in adherence with current domestic guidelines.27 In the case of patients with Down syndrome, we used the weight (Wt)-for-age and height (Ht)-for-age growth charts published by Zemel et al.,28 in addition to the WHO weight-for-height and body mass index (BMI)-for-age charts for children aged more than 5 years to diagnose excess weight. For patients with cerebral palsy, we used the growth charts of Brooks et al.29 adjusted according to the Gross Motor Function Classification System (GMFCS) for the Wt-for-age and Ht-for-age. Based on the Wt-for-age distribution, we defined undernutrition as a weight below the 10th percentile (P10), risk of undernutrition as a weight between the P10 and the 25th percentile (P25), adequate nutrition as a weight between the P25 and the 75th percentile (P75), overweight as a weight between the P75 and the 95th percentile (P95) and obesity as a weight above the P95.We defined short stature as a height at or below the P10 in the Zemel and Brooks growth charts.
The basal metabolic rate was calculated with the Schofield equation using the weight or the weight and height. We obtained the prescribed amounts of energy and protein from the prescription issued by the treating physician and the actual amount of delivered nutrition (adherence) from the nursing records, expressed as kcal/kg/day and grams of protein/kg/day. We recorded the total nutrient intake, regardless of the route of delivery.
We calculated the following ratios: prescribed nutrition/BMR (P/BMR), delivered nutrition (adherence)/BMR (A/BMR), delivered nutrition (adherence)/prescribed nutrition (A/P). We classified the energy intake as underfeeding (<90%), adequate nutrition (90%–110%) or overfeeding (>110%).23 For protein, we classified intake as inadequate (<1.5 g protein/kg/day) or adequate (≥1.5 g protein/kg/day).8,12,13
We recorded the route of administration (oral, enteral, parenteral), the enteral feeding method (bolus, continuous feeding), any suspensions of nutritional support and the reason for the suspension (procedure involving airway management, gastrointestinal dysfunction, diagnostic procedure, mechanical problem).
We classified the phase of illness as acute or non-acute based on a checklist designed by the research team that took into account different physiological variables and classification criteria by disease by system, defining acute illness as meeting one or more of the criteria in the list (Appendix A, Supplemental material 1).
Ethical considerationsThe study adhered to the principles of the Declaration of Helsinki. The study was approved by the Health Sciences Scientific and Ethics Committee of the School of Medicine of Pontificia Universidad Católica de Chile (no. 200122005) and considered exempt from the need of informed consent, given its observational nature and that contact with patients or families was not required to collect the necessary data.
Statistical analysisThe statistical analyses were carried out with the following software packages: STATA version 13, prism version 9.0, SPSS version 28.0.1.0. We summarised categorical variables as absolute and relative frequencies. We used the Shapiro–Wilk test to analyse the distribution of continuous variables, which were summarised as median and interquartile range (IQR). To compare the prescription, delivery (adherence) and BMR ratios in the acute and non-acute phases of disease, we carried out an inferential analysis using the χ2 test or Fisher exact test, as applicable, and the Wilcoxon test. We calculated the Spearman correlation coefficient for the P/BMR ratios for energy intake and protein intake. We considered P values of less than 0.05 statistically significant.
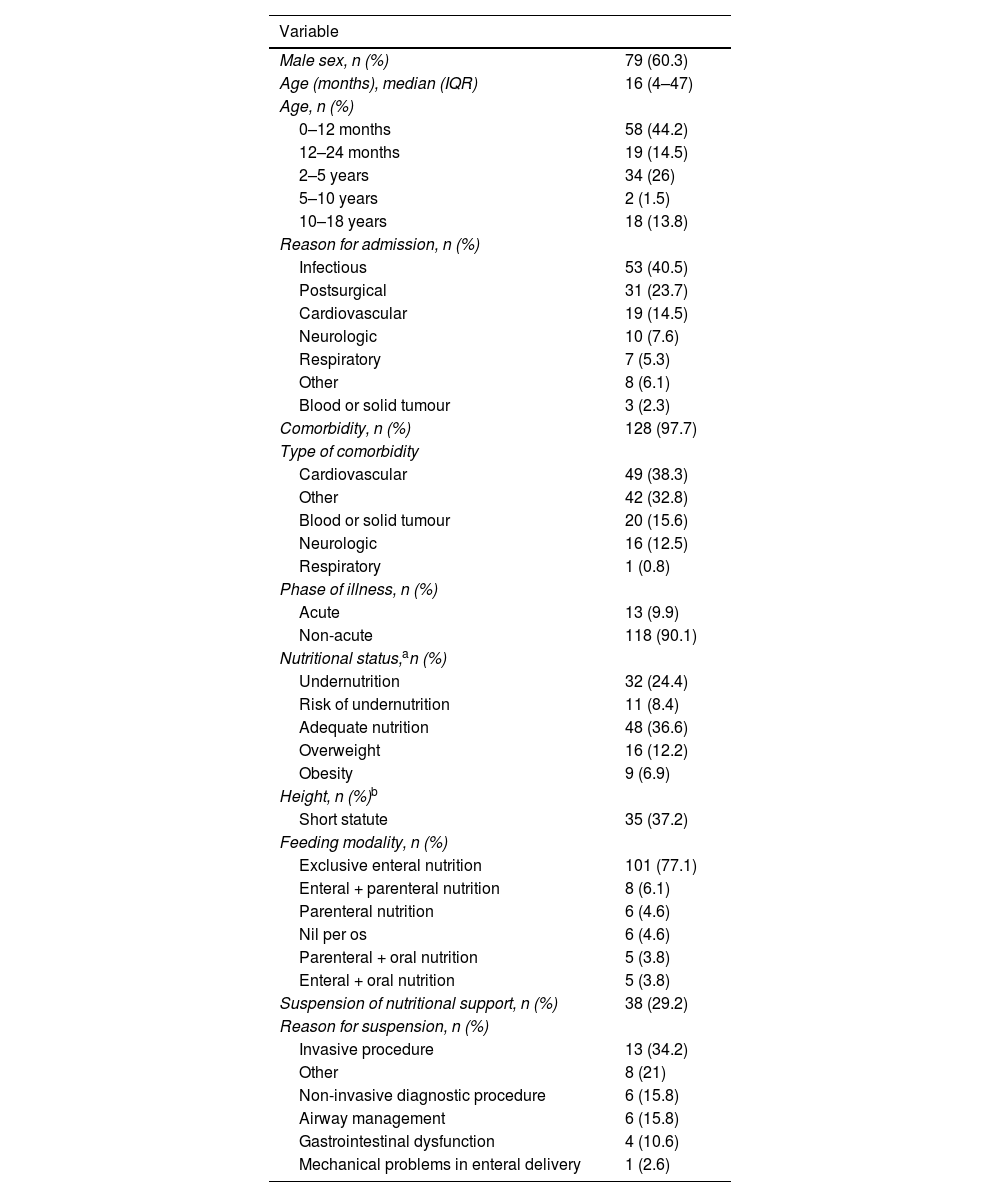
ResultsThe sample included 131 patients (Table 1 presents their demographic characteristics and nutritional data). The nutritional status could be determined in 116 patients, and a full nutritional evaluation was possible in 94 patients for whom weight and height data were available. Out of the total sample, 9 patients had GMFCS level V cerebral palsy and 12 had Down syndrome. Of note, 32.8% had undernutrition and 36.6% had adequate nutrition. The predominant feeding modality was exclusive enteral nutrition (77.1%), and the most frequent reason for suspension of nutritional support was performance of an invasive procedure.
Clinical, demographic and nutritional characteristics of the patients.
| Variable | |
|---|---|
| Male sex, n (%) | 79 (60.3) |
| Age (months), median (IQR) | 16 (4–47) |
| Age, n (%) | |
| 0–12 months | 58 (44.2) |
| 12–24 months | 19 (14.5) |
| 2–5 years | 34 (26) |
| 5–10 years | 2 (1.5) |
| 10–18 years | 18 (13.8) |
| Reason for admission, n (%) | |
| Infectious | 53 (40.5) |
| Postsurgical | 31 (23.7) |
| Cardiovascular | 19 (14.5) |
| Neurologic | 10 (7.6) |
| Respiratory | 7 (5.3) |
| Other | 8 (6.1) |
| Blood or solid tumour | 3 (2.3) |
| Comorbidity, n (%) | 128 (97.7) |
| Type of comorbidity | |
| Cardiovascular | 49 (38.3) |
| Other | 42 (32.8) |
| Blood or solid tumour | 20 (15.6) |
| Neurologic | 16 (12.5) |
| Respiratory | 1 (0.8) |
| Phase of illness, n (%) | |
| Acute | 13 (9.9) |
| Non-acute | 118 (90.1) |
| Nutritional status,an (%) | |
| Undernutrition | 32 (24.4) |
| Risk of undernutrition | 11 (8.4) |
| Adequate nutrition | 48 (36.6) |
| Overweight | 16 (12.2) |
| Obesity | 9 (6.9) |
| Height, n (%)b | |
| Short statute | 35 (37.2) |
| Feeding modality, n (%) | |
| Exclusive enteral nutrition | 101 (77.1) |
| Enteral + parenteral nutrition | 8 (6.1) |
| Parenteral nutrition | 6 (4.6) |
| Nil per os | 6 (4.6) |
| Parenteral + oral nutrition | 5 (3.8) |
| Enteral + oral nutrition | 5 (3.8) |
| Suspension of nutritional support, n (%) | 38 (29.2) |
| Reason for suspension, n (%) | |
| Invasive procedure | 13 (34.2) |
| Other | 8 (21) |
| Non-invasive diagnostic procedure | 6 (15.8) |
| Airway management | 6 (15.8) |
| Gastrointestinal dysfunction | 4 (10.6) |
| Mechanical problems in enteral delivery | 1 (2.6) |
IQR, interquartile range.
The BMR was calculated with the weight Schofield equation in 39 patients (29.77%) and the weight-height Schofield equation in 92 (70.23%).
Among the patients managed with enteral feeding, nutrition was delivered through a gastrostomy tube in 24 (21.1%), through a nasogastric tube in 76 (66.7%), and through a nasojejunal tube in 14 (12.3%). The enteral feeding modality was bolus feeding in 67 patients (58.8%) and continuous feeding in 47 patients (41.2%).
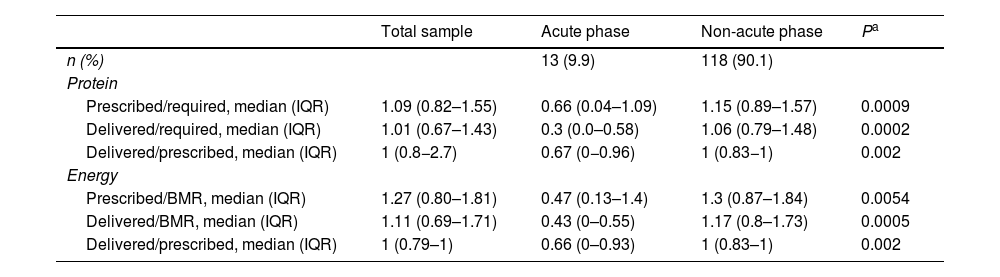
Table 2 presents the ratios of energy and protein intake requirements, amounts prescribed and amounts delivered (adherence) in the total sample and by phase of illness. We found a correlation coefficient of 0.6 for the association between the energy P/BMR and the protein prescription/protein requirements (R) (P/R), and no correlation between the protein requirement/delivery (adherence) and the A/P.
Ratios of energy and protein intake requirements, prescription and delivery (adherence) in the total sample and by phase of illness.
| Total sample | Acute phase | Non-acute phase | Pa | |
|---|---|---|---|---|
| n (%) | 13 (9.9) | 118 (90.1) | ||
| Protein | ||||
| Prescribed/required, median (IQR) | 1.09 (0.82–1.55) | 0.66 (0.04–1.09) | 1.15 (0.89–1.57) | 0.0009 |
| Delivered/required, median (IQR) | 1.01 (0.67–1.43) | 0.3 (0.0–0.58) | 1.06 (0.79–1.48) | 0.0002 |
| Delivered/prescribed, median (IQR) | 1 (0.8−2.7) | 0.67 (0−0.96) | 1 (0.83−1) | 0.002 |
| Energy | ||||
| Prescribed/BMR, median (IQR) | 1.27 (0.80–1.81) | 0.47 (0.13–1.4) | 1.3 (0.87–1.84) | 0.0054 |
| Delivered/BMR, median (IQR) | 1.11 (0.69–1.71) | 0.43 (0–0.55) | 1.17 (0.8–1.73) | 0.0005 |
| Delivered/prescribed, median (IQR) | 1 (0.79–1) | 0.66 (0–0.93) | 1 (0.83–1) | 0.002 |
BMR, basal metabolic rate; IQR, interquartile range.
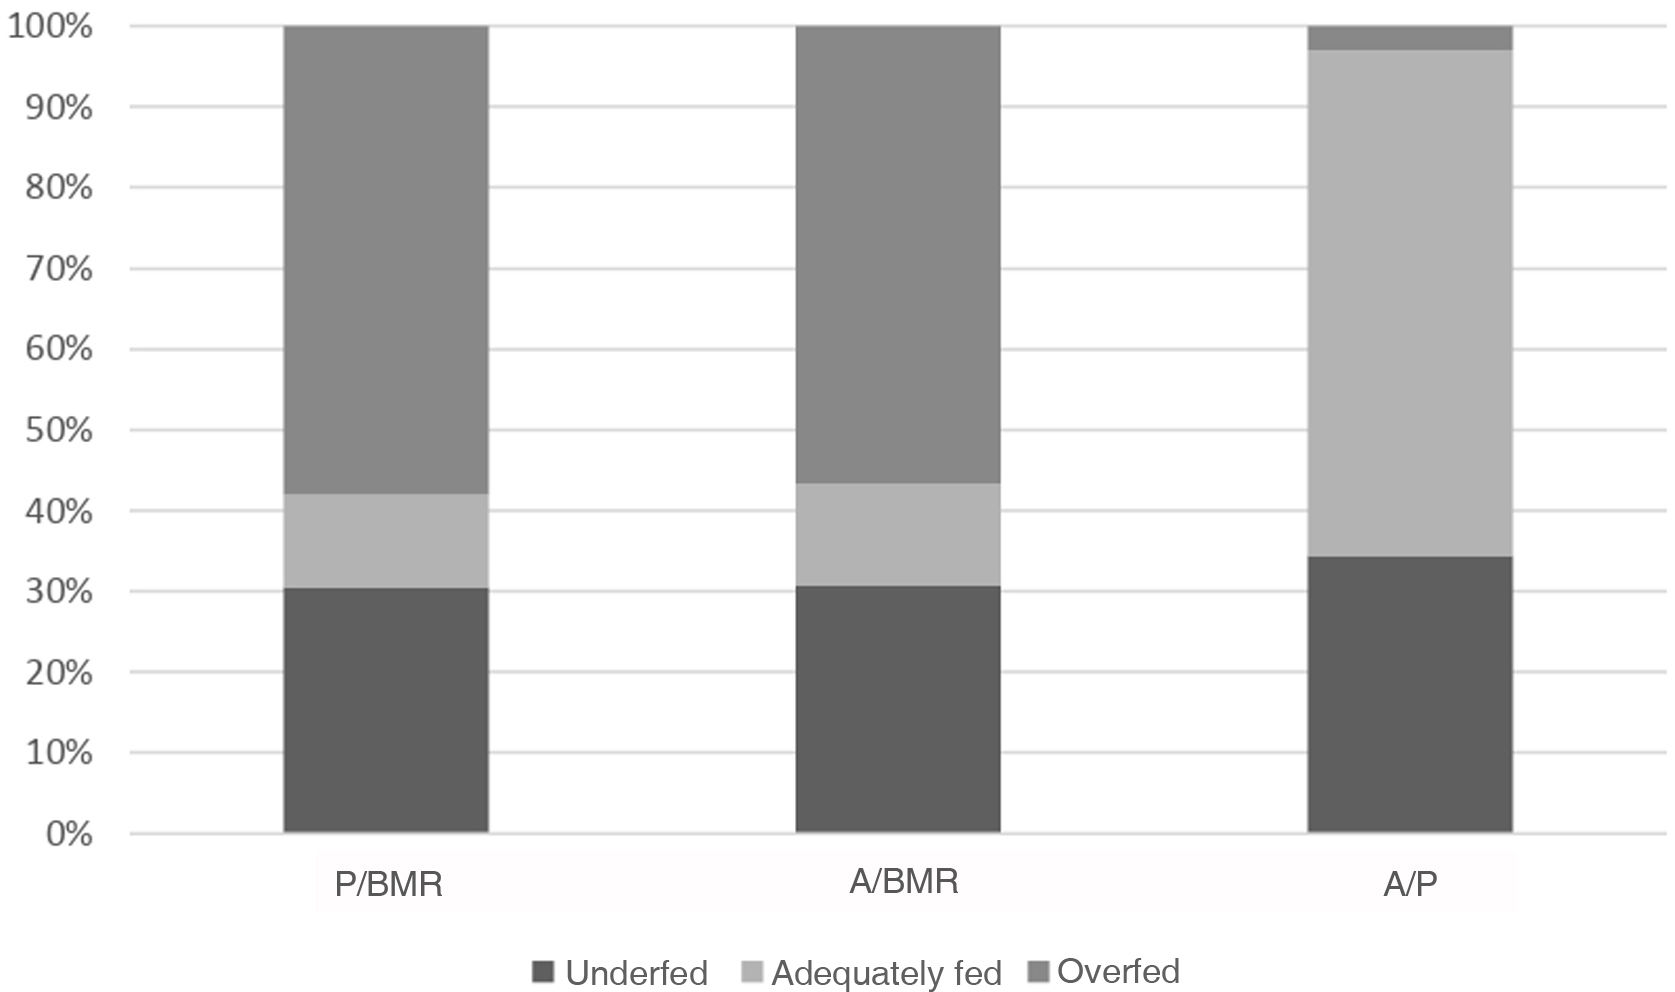
presents the distribution of underfeeding, adequate nutrition and overfeeding based on the energy intake for each of the ratios under study (P/BMR, A/BMR and A/P), and we found a statistically significant difference (P < 0.00001) on account of overfeeding for all ratios. Table 3 presents the distribution by phase of disease (acute vs. non-acute).
. A/BMR: adherence/basal metabolic rate; A/P, adherence/prescribed; P/BMR, prescribed/basal metabolic rate.")
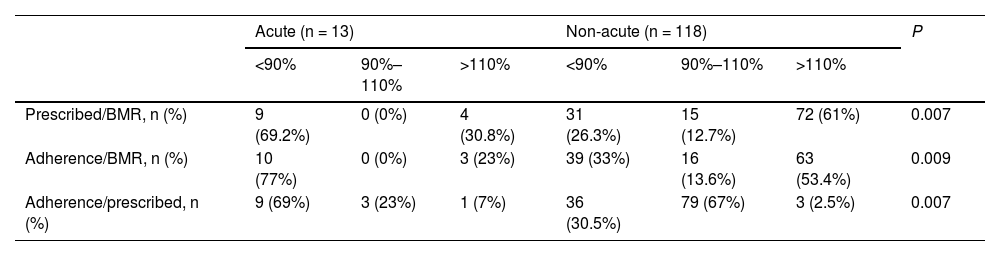
Energy requirements, prescribed intake and adherence (delivered amount) to prescribed intake ratios by phase of illness.
| Acute (n = 13) | Non-acute (n = 118) | P | |||||
|---|---|---|---|---|---|---|---|
| <90% | 90%–110% | >110% | <90% | 90%–110% | >110% | ||
| Prescribed/BMR, n (%) | 9 (69.2%) | 0 (0%) | 4 (30.8%) | 31 (26.3%) | 15 (12.7%) | 72 (61%) | 0.007 |
| Adherence/BMR, n (%) | 10 (77%) | 0 (0%) | 3 (23%) | 39 (33%) | 16 (13.6%) | 63 (53.4%) | 0.009 |
| Adherence/prescribed, n (%) | 9 (69%) | 3 (23%) | 1 (7%) | 36 (30.5%) | 79 (67%) | 3 (2.5%) | 0.007 |
BMR, basal metabolic rate.
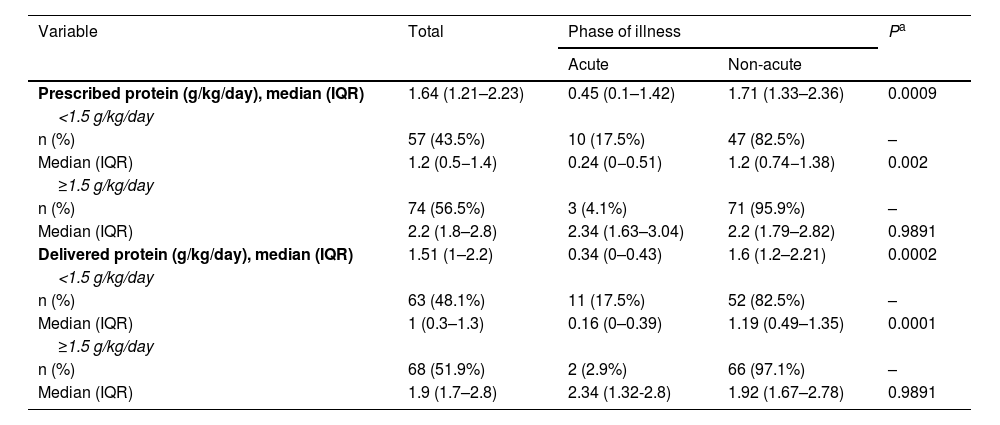
Table 4 presents the distribution of prescribed and delivered protein in the total sample and by phase of illness, and the most salient findings were the prescription of more than 1.5 g of protein/kg/day in 56.5% of the sample and the adherence to the prescription in 51.9%. We found significant differences between the prescribed amount and the delivered amount (adherence) in the groups with prescriptions of more or less than 1.5 g de protein/kg/day by phase of disease (Fisher test P = 0.016 and P = 0.007, respectively).
Protein intake by phase of illness.
| Variable | Total | Phase of illness | Pa | |
|---|---|---|---|---|
| Acute | Non-acute | |||
| Prescribed protein (g/kg/day), median (IQR) | 1.64 (1.21–2.23) | 0.45 (0.1–1.42) | 1.71 (1.33–2.36) | 0.0009 |
| <1.5 g/kg/day | ||||
| n (%) | 57 (43.5%) | 10 (17.5%) | 47 (82.5%) | – |
| Median (IQR) | 1.2 (0.5−1.4) | 0.24 (0−0.51) | 1.2 (0.74−1.38) | 0.002 |
| ≥1.5 g/kg/day | ||||
| n (%) | 74 (56.5%) | 3 (4.1%) | 71 (95.9%) | – |
| Median (IQR) | 2.2 (1.8–2.8) | 2.34 (1.63–3.04) | 2.2 (1.79–2.82) | 0.9891 |
| Delivered protein (g/kg/day), median (IQR) | 1.51 (1–2.2) | 0.34 (0–0.43) | 1.6 (1.2–2.21) | 0.0002 |
| <1.5 g/kg/day | ||||
| n (%) | 63 (48.1%) | 11 (17.5%) | 52 (82.5%) | – |
| Median (IQR) | 1 (0.3–1.3) | 0.16 (0–0.39) | 1.19 (0.49–1.35) | 0.0001 |
| ≥1.5 g/kg/day | ||||
| n (%) | 68 (51.9%) | 2 (2.9%) | 66 (97.1%) | – |
| Median (IQR) | 1.9 (1.7–2.8) | 2.34 (1.32-2.8) | 1.92 (1.67–2.78) | 0.9891 |
IQR, interquartile range.
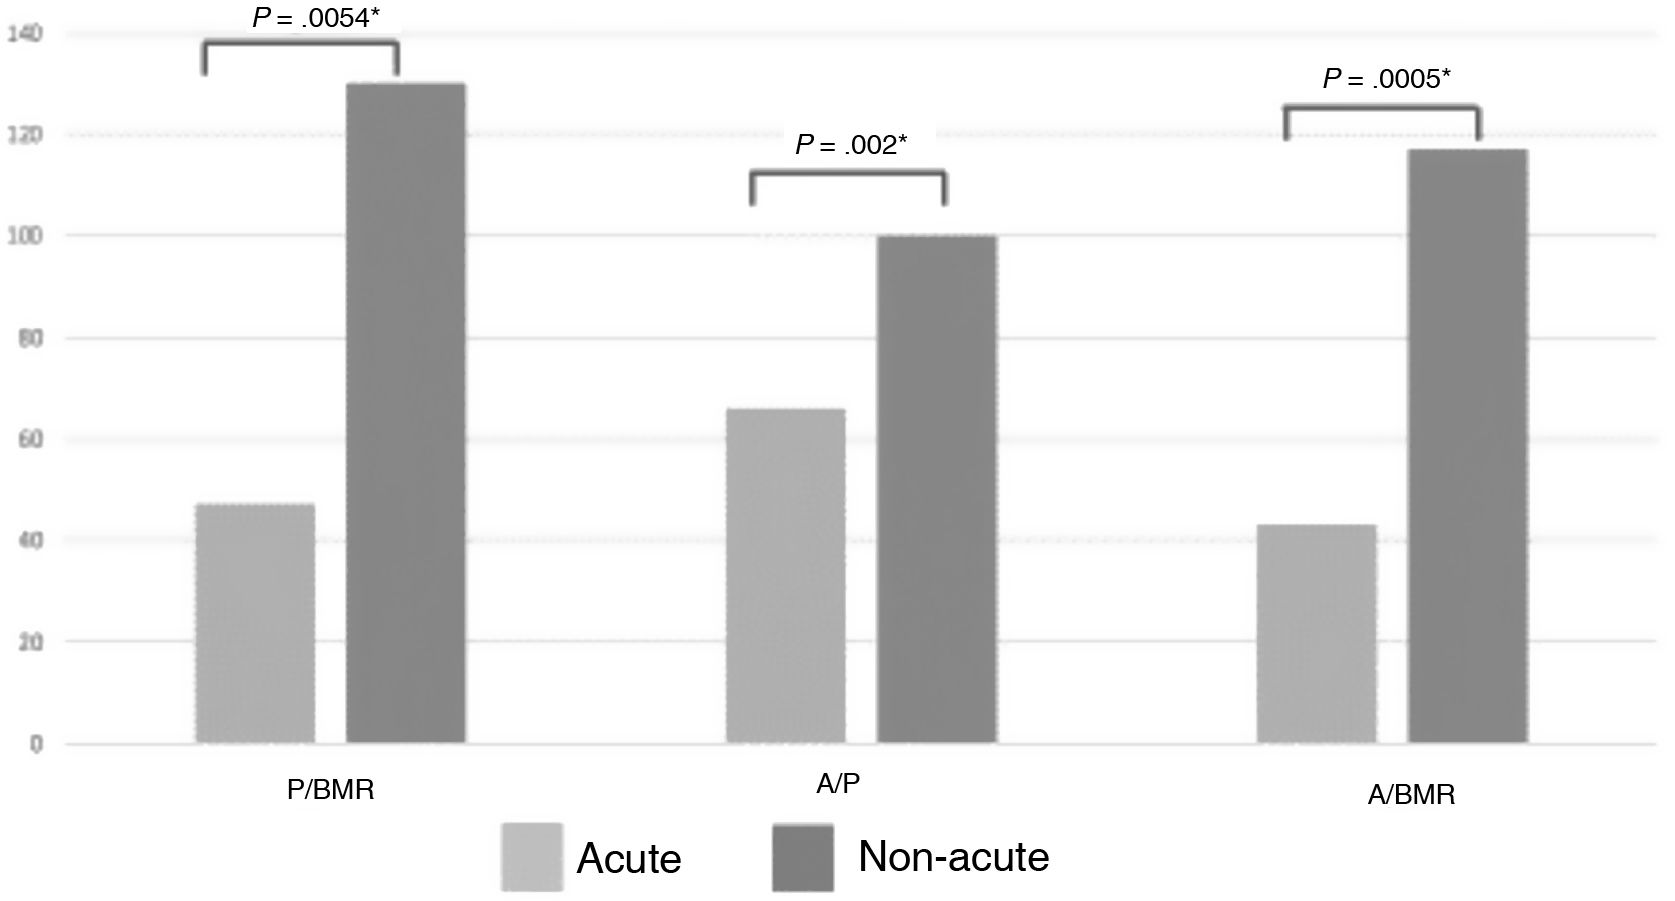
Fig. 2 compares the energy P/BMR, A/P and A/BMR by phase of illness, showing that the ratios were higher in non-acute patients.

The analysis of the variables associated with adherence to the prescribed energy intake revealed a higher frequency of underfeeding compared to the prescribed amount in patients at risk of undernutrition (7/10) (P = 0.001). On the other hand, eutrophic patients and patients with excess malnutrition have adherence of the prescription of 90-110% (adequate) with greater frequency (45/73) (p = 0.001).
Most patients in the acute phase of illness (9/13) were underfed compared to the prescribed nutrition (<90%). In contrast, in the non-acute group, adherence was adequate (90%–110%) in most patients (78/118). A small number (3/118) even received more than was prescribed (>110%) (P = 0.007). We did not find statistically significant differences in the frequency distribution of acute vs. non-acute patients by reason for suspension of nutritional therapy (P = 0.074) or type of nutritional support (P = 0.237).
DiscussionSeveral reports indicate that the protein and energy requirements of patients admitted to intensive care units are frequently not met (A/R and A/BMR) during the acute phase of illness.18,19,22,24
In our study, we found that three fifths of patients had an energy intake meeting their BMR and half had a protein intake meeting their protein requirements (A/R), with a higher proportion of patients with intakes meeting the BMR in the non-acute versus the acute phase of illness, in agreement with previous studies that found that delivery of the full required amount was harder in the early days of the intensive care unit stay, which usually correspond to the acute phase.23,30,31
A noteworthy finding in our study was that the percentage of patients in the acute phase of illness was low for the paediatric critical care setting.
In the assessment of the prescribed energy intake, based on the widespread consensus for the optimal nutrition of paediatric patients, with calculation of the BMR by means of the Schofield equation,8,12 we found that only a small percentage of patients had an adequate energy intake prescription (P/BMR), with an insufficient or excessive prescription in most patients, more frequently the latter.
Given that the acute phase of illness is characterised by ongoing changes in metabolism, the Schofield formula used in isolation cannot account for changes in metabolism following injury and can overestimate energy requirements, as observed by Mehta et al.32 in a study in which they compared indirect calorimetry measurements with these equations, highlighting the overestimation of energy requirements using equations due to hypometabolism in these patients. Other studies, like the one conducted by Oosterveld et al.,33 have not found significant differences between the calculation of the resting energy expenditure rate using indirect calorimetry and the Schofield equation, which reinforces what we have noted above, that energy requirements in these patients can be underestimated as well as overestimated.
In the assessment by phase of illness, we found that the median prescribed energy intake in patients in the acute phase was approximately half the BMR (P/BMR), similar to the findings of studies like the one published by De Jonghe et al.,17 who reported prescriptions of 78% of the energy requirements in these patients, or the study by McClave et al.,34 who reported prescription of 65.6% of the estimated requirements.
It is well known that critical illness is associated with protein catabolism, which has a negative impact in terms of an increase in both morbidity and mortality and a more difficult recovery.13,35 When we analysed the prescribed protein intake in relation to the protein requirements (P/R) and the adherence to this prescription, we found that in most patients the prescribed and actual intakes adhered to current recommendations,8,12,13 with greater adherence compared to other studies; thus, Kyle et al.21 reported a protein intake of 40.4% of the protein requirements and Wong et al.36 an intake of only 13.1% of estimated requirements on day 3 of the intensive care unit stay. We must underscore the importance of delivering nutrition consistent with current recommendations to avoid malnutrition and a negative protein balance.37 In the group of patients with acute illness, we found that 23% had prescriptions for less than 1.5 g of protein per kg of body weight, which was consistent with the studies cited above.
When we assessed adherence with the prescribed energy intake (A/P), we found that one third of the patients were underfed, a proportion that was lower than reported by De Jonghe et al.,17 who found that 90.1% of the amount prescribed was delivered, and Li et al.,22 who found a percentage of underfeeding of 85%.
It is worth noting that patients in the acute metabolic stress phase only achieved two thirds of the prescribed intake for both energy and protein. When we explored the variables that may have played a role in this outcome, we found that most patients who did not achieve a delivered/prescribed ratio greater than 90% had experienced interruptions to nutritional support, and invasive, non-invasive procedures and airway management procedures accounted for more than half of the interruptions. In addition, we found that suspensions of nutritional support were more frequent in patients at risk of undernutrition, although we were able to determine the cause or find an association with any of the variables under study that could explain it. This is an important finding, as these patients would be more likely to eventually become undernourished.
Our findings evince the substantial proportion of critically ill paediatric patients whose intake does not meet their nutritional requirements for either energy or protein. The values observed in our study were greater compared to other studies in the literature, which in our opinion highlights the importance of implementing standardised nutritional support protocols for critical patients and a multidisciplinary approach to their management with the aim of improving these outcomes, which could be subject to study in the future.24
There are limitations to our study, chief of which is that it was conducted in the context of the coronavirus disease 2019 pandemic, which changed the epidemiology of acute illness in the paediatric population and, as a result, the reasons for admission to the paediatric intensive care unit. Another limitation was the low proportion of patients in the acute phase of illness, which was defined based on the fulfilment of criteria in a checklist developed by the research team, since no existing instruments for the purpose were found, and which precluded comparisons to determine whether this low frequency would be expected in this type of paediatric unit. We did not collect data on the length of stay in the hospital and in the paediatric intensive care or intermediate care units or the duration of nutritional support to provide a more detailed interpretation of the results. Last of all, we did not compare the estimated energy requirements with values obtained by indirect calorimetry (the gold standard) or estimated protein requirements with the nitrogen balance to carry out the analyses, which would have allowed a more accurate assessment of individual requirements. One of the strengths of the study is that we integrated the phase of illness in the analysis in relation to the estimated BMR, the prescribed nutrition and the amounts that could actually be delivered, a novel approach that provides a more thorough understanding of the timing, amount and route of delivery of nutritional support in children in the intensive care unit based on the deficiencies or excesses in the nutrition that is actually delivered.
ConclusionIn the sample of patients managed in the paediatric intensive and intermediate care unit, we found that the prescribed intake in relation to the BMR was appropriate in a high proportion of patients in the non-acute phase of disease, doubling the proportion with adequate prescription of energy intake and more than tripling the proportion with adequate prescription of protein intake in the group of patients in the acute phase of illness. Intake was lower in patients in the acute phase of illness.
In relation to this, our findings illustrated the difficulty in achieving delivery of the total prescribed intake, and one of the main reasons for it was the frequent interruption of nutritional support, chiefly in relation to the performance of invasive procedures.
On the other hand, overfeeding was frequent, more so in the non-acute phase of disease.
Our findings illustrate the challenge of providing balanced nutritional support to critically ill paediatric patients, which requires ongoing evaluation through objective clinical parameters to assess the impact of prescribed nutrition in relation to the BMR.
FundingThis research did not receive any external funding.
Conflicts of interestThe authors have no conflicts of interest to declare.
The following is Supplementary data to this article: