


Air quality in schools is a concern at the European level, and few data have been published on the subject in the Community of Madrid.
Material and methodsWe conducted a longitudinal descriptive study on the presence and distribution of pollutants in four schools in Madrid selected on account of their location, exposure to traffic and proximity to green areas. We measured pollutants and assessed environmental characteristics in primary school classrooms. We measured pollutants with sensors over five data collection campaigns, each lasting two weeks. The obtained data were analyzed with the R software. We calculated the median, range and percentage of exceedance of recommended thresholds and assessed environmental conditions.
ResultsWe found levels of 2.5 µm particulate matter (PM) above the recommended threshold in 40%–70% of the measurements. Volatile organic compounds (VOCs) exceeded the recommended threshold in April in 41.52% of the measurements. The level of CO2 exceeded the recommended threshold in three of the campaigns. There was broad variation in ultrafine particles. Temperature, CO2, VOCs, PM 1, PM 0.3 and PM 2.5 levels were higher in occupied classrooms. Humidity was positively correlated to PM 0.3, PM 1 and PM 2.5 levels and negatively correlated to ultrafine particle levels.
ConclusionsThis is the first study to assess indoor pollutants and their concentration in schools in the Madrid region. We found levels of CO2, PM 2.5 and VOCs exceeding the currently recommended thresholds.
La calidad del aire en las escuelas es motivo de preocupación a nivel europeo, con escasos datos publicados sobre la Comunidad Madrid.
Material y métodosSe trata de un estudio descriptivo, longitudinal sobre la presencia y distribución de contaminantes en 4 colegios de Madrid que se seleccionaron considerando su ubicación, exposición al tráfico y cercanía a zonas verdes. Se midieron contaminantes y características ambientales en aulas de primaria. La recogida de datos se realizó con sensores en 5 campañas de 2 semanas de duración. Los datos se analizaron con el programa R. Se calcularon medianas, rangos y porcentajes de superación de límites recomendados. Se estudiaron correlaciones entre contaminantes y condiciones ambientales.
ResultadosSe encontraron niveles de partículas en suspensión (PM) de 2,5 µm por encima del umbral recomendado entre un 40 y un 70% de las mediciones. Los compuestos orgánicos volátiles (COV) superaron el umbral recomendado en abril en el 41,52%. El CO2 superó el límite recomendado en tres de las campañas. Las partículas ultrafinas mostraron gran variabilidad. Los niveles de temperatura, CO2, COV, PM 1, PM 0,3 y PM 2,5 fueron más altos en las aulas ocupadas. La humedad se correlacionó positivamente con PM 0,3, PM 1 y PM 2,5, y negativamente con ultrafinas.
ConclusionesEste es el primer estudio que evalúa los contaminantes que existen en el interior de colegios de la comunidad de Madrid y su concentración. Se observan niveles de CO2, PM 2,5 y COV por encima de las recomendaciones actuales.

In 2022, the United Nations recognized the right to a clean, healthy and sustainable environment as a human right,1 including breathing clean air. This resolution highlights the gravity of the situation, as evinced in the Global Burden of Disease Study of 2019,2 which reported 368 006 estimated deaths in Europe attributable to air pollution, a decrease of 42.4% compared to 1990.
It is well known that air quality affects health3 and that children are particularly vulnerable due to a variety of factors, both behavioral (natural curiosity, no decision-making capacity to avoid exposure) and biological (shorter stature favoring exposure to certain particles, greater relative body surface area compared to adults, longer life expectancy, higher minute ventilation and greater energy expenditure),4 so that, with the same level of pollutants in the air, their exposure is greater in absolute terms, and furthermore, it occurs in an organism in which the defense mechanisms are not yet fully developed.5 On the other hand, in high-income countries, it is common for children to spend between 7 and 8 h a day at school, where they carry out indoor and outdoor activities, coming into contact with pollutants in both settings. It is important to study them both indoors and outdoors to get an overall perspective of the type and level of exposure.6
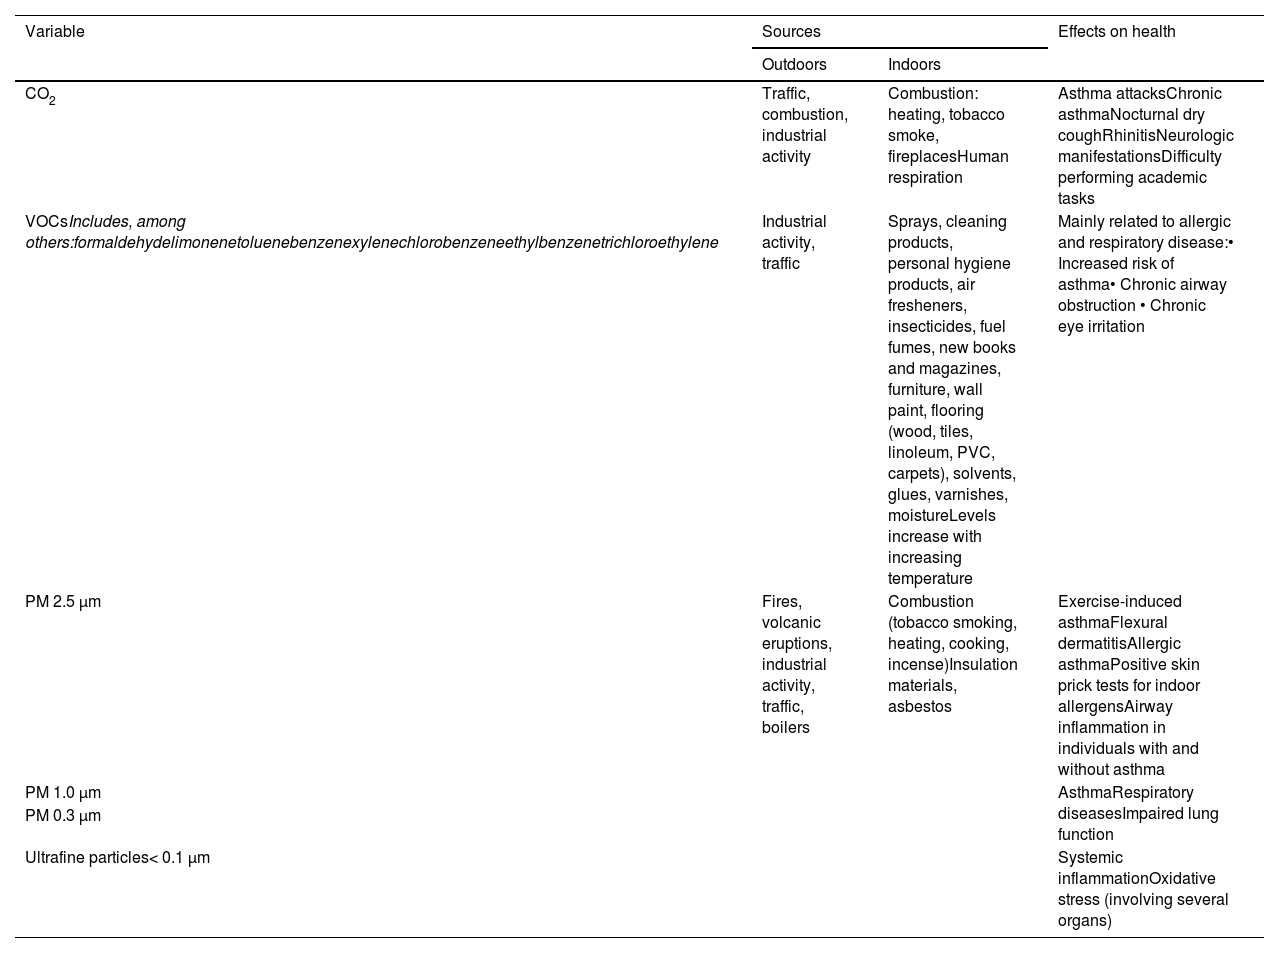
For these reasons, public health authorities have been investigating air quality in schools for more than 20 years.7 At the European level,8–11 several studies have been conducted to determine which pollutants are present in schools, their sources and their impact on the health of schoolchildren. Some of the relevant effects previously described are an increase in primary care visits for respiratory conditions,12,13 an increased risk of obesity,14 poorer academic performance15,16 or neurodevelopmental abnormalities,17 among others (Table 1).
Description of the pollutants most commonly found inside primary school classrooms, their sources and their effects on health.9–11,27,32,33
| Variable | Sources | Effects on health | |
|---|---|---|---|
| Outdoors | Indoors | ||
| CO2 | Traffic, combustion, industrial activity | Combustion: heating, tobacco smoke, fireplacesHuman respiration | Asthma attacksChronic asthmaNocturnal dry coughRhinitisNeurologic manifestationsDifficulty performing academic tasks |
| VOCsIncludes, among others:formaldehydelimonenetoluenebenzenexylenechlorobenzeneethylbenzenetrichloroethylene | Industrial activity, traffic | Sprays, cleaning products, personal hygiene products, air fresheners, insecticides, fuel fumes, new books and magazines, furniture, wall paint, flooring (wood, tiles, linoleum, PVC, carpets), solvents, glues, varnishes, moistureLevels increase with increasing temperature | Mainly related to allergic and respiratory disease:• Increased risk of asthma• Chronic airway obstruction • Chronic eye irritation |
| PM 2.5 μm | Fires, volcanic eruptions, industrial activity, traffic, boilers | Combustion (tobacco smoking, heating, cooking, incense)Insulation materials, asbestos | Exercise-induced asthmaFlexural dermatitisAllergic asthmaPositive skin prick tests for indoor allergensAirway inflammation in individuals with and without asthma |
| PM 1.0 μm | AsthmaRespiratory diseasesImpaired lung function | ||
| PM 0.3 μm | |||
| Ultrafine particles< 0.1 μm | Systemic inflammationOxidative stress (involving several organs) | ||
Abbreviations: VOCs, volatile organic compounds; PM, particulate matter.
In Spain, there has also been concern about this issue, and numerous studies have been published regarding the quality of indoor and outdoor air in schools,18–24 and pediatric scientific societies, aware of the importance of the problem, have also contributed to raising awareness and researching the subject by setting up various committees, such as the Environmental Health Committee of the Asociación Española de Pediatría (AEP, Spanish Association of Pediatrics).
In this context, we designed a multidisciplinary research project, led by architecture professionals, to describe and analyze the factors related to the presence of pollutants inside schools, paying special attention to the study of particulate matter (PM) smaller than 2.5 µm. The objective was to improve our understanding of their sources and the impact on the health of the occupants in order to propose possible solutions, both structural and in terms of usage. In this article, we present the results of the initial phase of the project, describing the presence and distribution of different pollutants as well as temperatures and humidity levels inside classrooms in four schools in the Community of Madrid that may affect the health of school-age children.
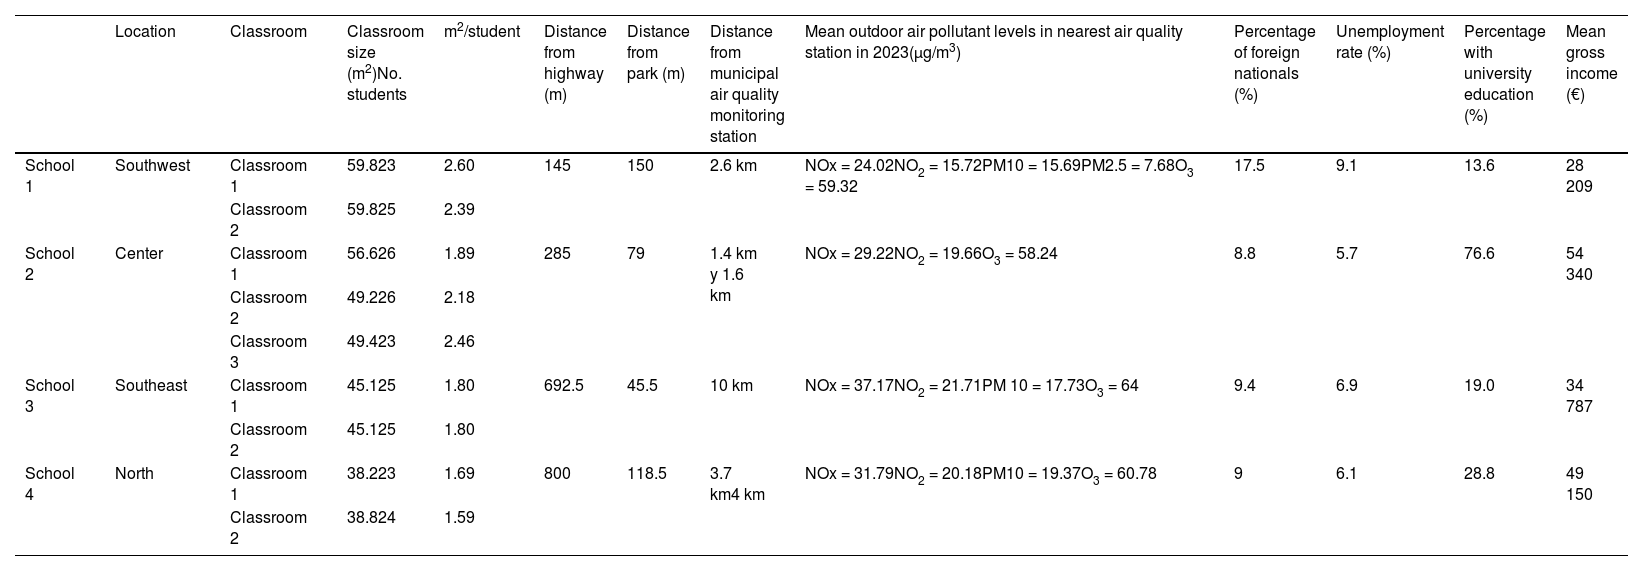
Material and methodsThe team designed a longitudinal, descriptive study to measure pollutants and environmental characteristics in four schools in the Community of Madrid. The schools were selected by convenience sampling to ensure that they were in different geographical locations, with different traffic volumes and varying proximity to green areas. Three of them are in the city of Madrid (north, east and center) and one is in another municipality on its outskirts. Table 2 presents the characteristics of the schools and their surroundings. Only school 3 had a controlled ventilation system, while the others had natural ventilation. Two classrooms were selected per school, all of them primary education classrooms, sunny and located on the first floor of the building. With the aim of maximizing the homogeneity between groups and indoor activities, as well as the comparability with other studies,10,20 we selected children aged 8–11 years.
Description of participating centers: location, socioeconomic characteristics of the district and student body.
| Location | Classroom | Classroom size (m2)No. students | m2/student | Distance from highway (m) | Distance from park (m) | Distance from municipal air quality monitoring station | Mean outdoor air pollutant levels in nearest air quality station in 2023(μg/m3) | Percentage of foreign nationals (%) | Unemployment rate (%) | Percentage with university education (%) | Mean gross income (€) | |
|---|---|---|---|---|---|---|---|---|---|---|---|---|
| School 1 | Southwest | Classroom 1 | 59.823 | 2.60 | 145 | 150 | 2.6 km | NOx = 24.02NO2 = 15.72PM10 = 15.69PM2.5 = 7.68O3 = 59.32 | 17.5 | 9.1 | 13.6 | 28 209 |
| Classroom 2 | 59.825 | 2.39 | ||||||||||
| School 2 | Center | Classroom 1 | 56.626 | 1.89 | 285 | 79 | 1.4 km y 1.6 km | NOx = 29.22NO2 = 19.66O3 = 58.24 | 8.8 | 5.7 | 76.6 | 54 340 |
| Classroom 2 | 49.226 | 2.18 | ||||||||||
| Classroom 3 | 49.423 | 2.46 | ||||||||||
| School 3 | Southeast | Classroom 1 | 45.125 | 1.80 | 692.5 | 45.5 | 10 km | NOx = 37.17NO2 = 21.71PM 10 = 17.73O3 = 64 | 9.4 | 6.9 | 19.0 | 34 787 |
| Classroom 2 | 45.125 | 1.80 | ||||||||||
| School 4 | North | Classroom 1 | 38.223 | 1.69 | 800 | 118.5 | 3.7 km4 km | NOx = 31.79NO2 = 20.18PM10 = 19.37O3 = 60.78 | 9 | 6.1 | 28.8 | 49 150 |
| Classroom 2 | 38.824 | 1.59 |
Abbreviations: NOx, nitrogen oxides; PM, particulate matter.
The project was approved by the Ethics Committee of the Hospital Gregorio Marañón (PID2021-123023OA-I00) and the administrators of participating schools, which signed an informed consent form. Families were appropriately informed of the activities that were to take place, and the research team committed to avoid interfering with school activities. None of the activities in this phase of the project involved the families or the teaching staff outside the informational meetings.
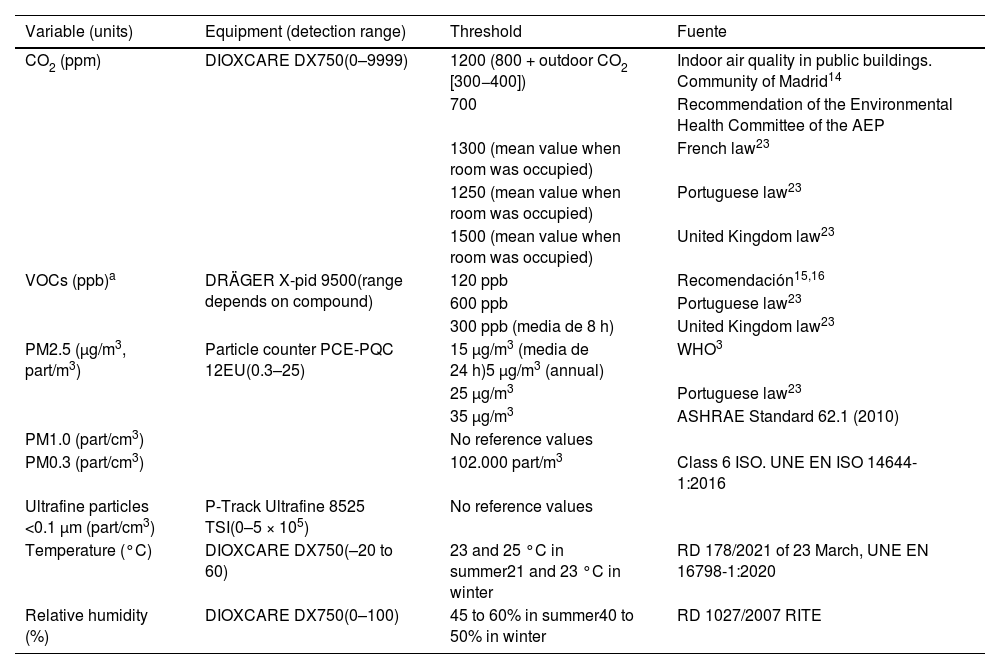
We collected data by means of sensors placed inside the classrooms, approximately one meter above the floor, corresponding to the height at which children breathe. There were five fieldwork campaigns during which we collected data from each classroom at five different times: before the students arrived, before and after the midmorning break, after the midday break and, finally, after students left. Portable measuring equipment was used for each type of pollutant. The researcher in charge of data collection visited each of the schools with the equipment within the two-week period corresponding to each campaign, taking measurements for 2–3 days between Monday and Friday, which yielded 10–15 specific measurements per classroom per campaign. The researcher collected data on the following pollutants and environmental characteristics: particulate matter with diameters of 2.5 μm or less (PM2.5), 1 μm or less (PM1) and 0.3 μm or less (PM0.3), ultrafine particulate matter of less than 0.1 μm in diameter (UFP), volatile organic compounds, temperature, humidity and CO2 (Table 3). When it came to PM2.5, we obtained the levels in terms of particles (part)/m3 in every campaign and in μm/m3 in October and December. We documented the various activities carried out during the observed school days.
Variables recorded in each campaign, measurement equipment and reference thresholds.
| Variable (units) | Equipment (detection range) | Threshold | Fuente |
|---|---|---|---|
| CO2 (ppm) | DIOXCARE DX750(0–9999) | 1200 (800 + outdoor CO2 [300−400]) | Indoor air quality in public buildings. Community of Madrid14 |
| 700 | Recommendation of the Environmental Health Committee of the AEP | ||
| 1300 (mean value when room was occupied) | French law23 | ||
| 1250 (mean value when room was occupied) | Portuguese law23 | ||
| 1500 (mean value when room was occupied) | United Kingdom law23 | ||
| VOCs (ppb)a | DRÄGER X-pid 9500(range depends on compound) | 120 ppb | Recomendación15,16 |
| 600 ppb | Portuguese law23 | ||
| 300 ppb (media de 8 h) | United Kingdom law23 | ||
| PM2.5 (μg/m3, part/m3) | Particle counter PCE-PQC 12EU(0.3–25) | 15 μg/m3 (media de 24 h)5 μg/m3 (annual) | WHO3 |
| 25 μg/m3 | Portuguese law23 | ||
| 35 μg/m3 | ASHRAE Standard 62.1 (2010) | ||
| PM1.0 (part/cm3) | No reference values | ||
| PM0.3 (part/cm3) | 102.000 part/m3 | Class 6 ISO. UNE EN ISO 14644-1:2016 | |
| Ultrafine particles <0.1 μm (part/cm3) | P-Track Ultrafine 8525 TSI(0–5 × 10⁵) | No reference values | |
| Temperature (°C) | DIOXCARE DX750(–20 to 60) | 23 and 25 °C in summer21 and 23 °C in winter | RD 178/2021 of 23 March, UNE EN 16798-1:2020 |
| Relative humidity (%) | DIOXCARE DX750(0–100) | 45 to 60% in summer40 to 50% in winter | RD 1027/2007 RITE |
Abbreviations: AEP, Asociación Española de Pediatría; ASHRAE: American Society of Heating, Refrigerating and Air-Conditioning Engineers; VOCs, volatile organic compounds; part, particles; PM, particulate matter; ppb, parts per billion; ppm, parts per million; RD, Royal Decree; RITE, Regulation on Thermal Installations in Buildings; UNE, Asociación Española de Normalización (Spanish Association for Standardization); WHO, World Health Organization.
Specific VOCs: butyl acetate, ethyl acetate, vinyl acetate, acetone, acrolein, benzene, bromomethane, 1,3-butadiene, 2-butanone, butyl acrylate, butyraldehyde, diethyl carbonate, cyclohexane, chlorobenzene, vinyl chloride, 1,1-dichloroethane, cis-1,2-dichloroethane, trans-1,2-dichloroethane, dimethyl carbonate, carbon disulfide, epichlorohydrin, styrene, ethanol, ethene, ethyl methyl carbonate, ethyl acrylate, ethylbenzene, phosphine, heptane, n-hexane, isobutylene, isopropanol, methyl methacrylate, 2-methylbutyraldehyde, 1-propanol, hydrogen sulfide, tetrachloroethane, tetrahydrofuran, toluene, trichloroethylene, xylenes (m-o-p isomers), ethylene oxide, propylene oxide.
In this article, we present the results for the data collected during the February, April, May, October and December 2023 campaigns. The data were analyzed with the R statistical software, removing outliers. The assessment of the distribution of the variables showed that only the temperature followed a normal distribution, while the remaining variables had a right-skewed distribution. Thus, in the descriptive analysis, the data were summarized as medians and percentiles, stratified by campaign, school, and whether the classroom was empty or occupied at the time of measurement. We also calculated the percentage of measurements that exceeded the recommended thresholds,23 shown in Table 3. Lastly, we analyzed the correlation between the different pollutants and between the pollutants and humidity and temperature conditions. Statistical significance was defined as a P value of less than 0.05. We did not analyze the correlation with outdoor air pollutant levels because it was outside the current scope of the project.
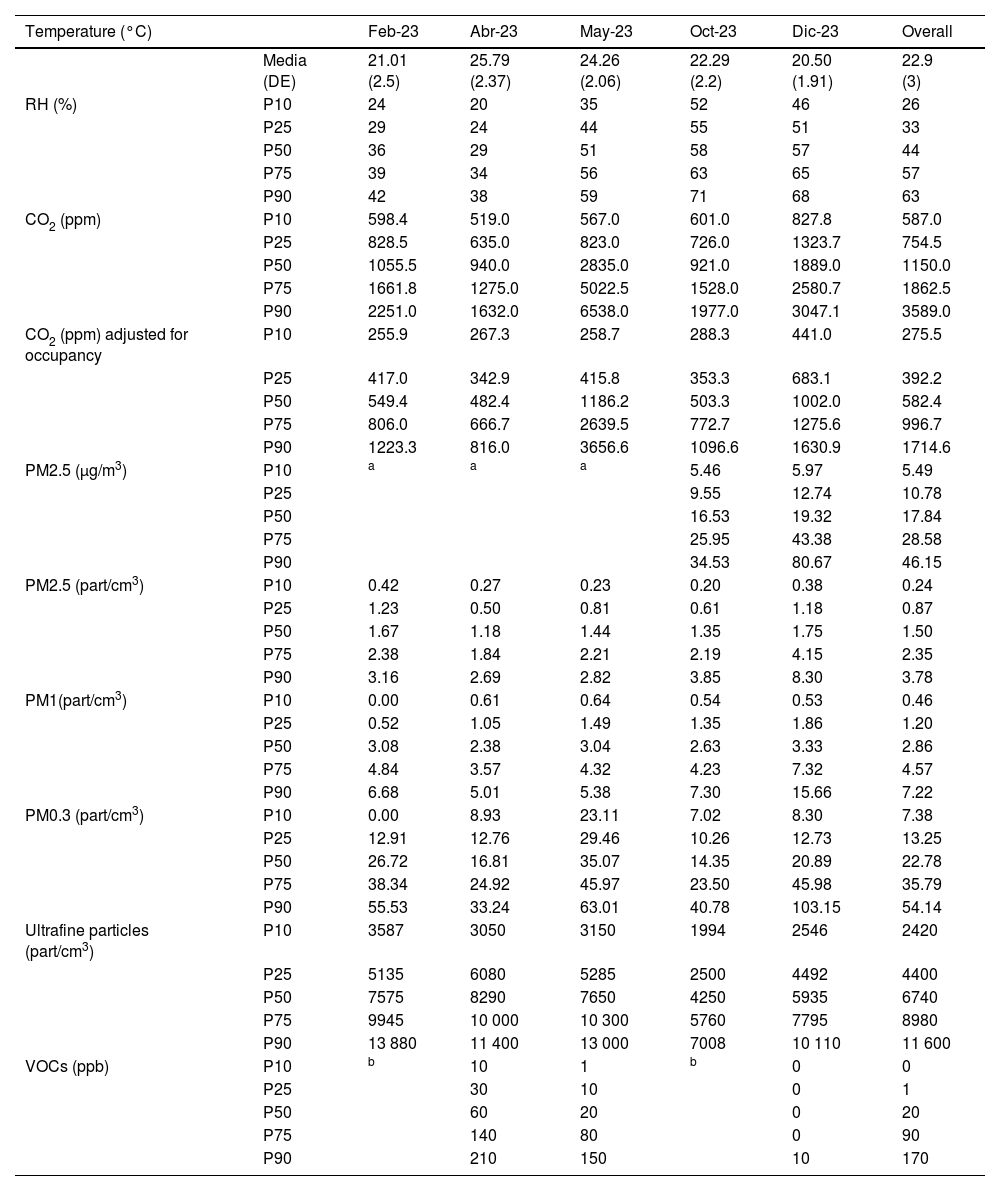
ResultsWith regard to environmental characteristics, there were no differences in temperature between centers, and the lowest values were recorded during the February and December campaigns, with a mean of 21.01 °C (standard deviation [SD], 2.5) and 20.5 °C (SD, 1.91), respectively, and the highest in April, with a mean of 25.8 °C (SD, 2.37), coinciding with a heatwave. The humidity values ranged from 29% (SD, 7) for the reading corresponding to the month of April to 60% (SD, 7) for the month of October.
Fig. 1 presents the distribution of the values obtained for each center in the total of the 5 campaigns. Table 4 presents the median and the 10th, 25th, 75th and 90th percentiles for each variable, grouping the data for the four centers, as there were no significant differences between them. We can see that PM2.5 values were higher during the cold months, especially in December. The levels of smaller particles (PM1 and PM0.3) followed a similar distribution; on the other hand, UFP levels did not follow the same trend and exhibited a wide range (median, 6585; interquartile range, 4462.5–9060.0). When it came to VOC levels, as can be seen in Fig. 1, there was dispersion in the highest values, but no differences between centers in the interquartile range. The data for VOC levels is limited to April, May and December, due to equipment failure of in the other two campaigns.

Results of the measurement of pollutants, temperature and humidity in the four schools. Grouped data for the five campaigns. Levels expressed as part/m3 for PM and ppm for VOCs.
Abbreviations: part, particles; PM, particulate matter; ppm, parts per million; RH, relative humidity; Sch, school; T, temperature; VOCs, volatile organic compounds.
Numerical summary of the mean values obtained in each campaign for VOCs, CO2, PM and ultrafine particle levels, relative humidity and temperature.
| Temperature (°C) | Feb-23 | Abr-23 | May-23 | Oct-23 | Dic-23 | Overall | |
|---|---|---|---|---|---|---|---|
| Media (DE) | 21.01 (2.5) | 25.79 (2.37) | 24.26 (2.06) | 22.29 (2.2) | 20.50 (1.91) | 22.9 (3) | |
| RH (%) | P10 | 24 | 20 | 35 | 52 | 46 | 26 |
| P25 | 29 | 24 | 44 | 55 | 51 | 33 | |
| P50 | 36 | 29 | 51 | 58 | 57 | 44 | |
| P75 | 39 | 34 | 56 | 63 | 65 | 57 | |
| P90 | 42 | 38 | 59 | 71 | 68 | 63 | |
| CO2 (ppm) | P10 | 598.4 | 519.0 | 567.0 | 601.0 | 827.8 | 587.0 |
| P25 | 828.5 | 635.0 | 823.0 | 726.0 | 1323.7 | 754.5 | |
| P50 | 1055.5 | 940.0 | 2835.0 | 921.0 | 1889.0 | 1150.0 | |
| P75 | 1661.8 | 1275.0 | 5022.5 | 1528.0 | 2580.7 | 1862.5 | |
| P90 | 2251.0 | 1632.0 | 6538.0 | 1977.0 | 3047.1 | 3589.0 | |
| CO2 (ppm) adjusted for occupancy | P10 | 255.9 | 267.3 | 258.7 | 288.3 | 441.0 | 275.5 |
| P25 | 417.0 | 342.9 | 415.8 | 353.3 | 683.1 | 392.2 | |
| P50 | 549.4 | 482.4 | 1186.2 | 503.3 | 1002.0 | 582.4 | |
| P75 | 806.0 | 666.7 | 2639.5 | 772.7 | 1275.6 | 996.7 | |
| P90 | 1223.3 | 816.0 | 3656.6 | 1096.6 | 1630.9 | 1714.6 | |
| PM2.5 (μg/m3) | P10 | a | a | a | 5.46 | 5.97 | 5.49 |
| P25 | 9.55 | 12.74 | 10.78 | ||||
| P50 | 16.53 | 19.32 | 17.84 | ||||
| P75 | 25.95 | 43.38 | 28.58 | ||||
| P90 | 34.53 | 80.67 | 46.15 | ||||
| PM2.5 (part/cm3) | P10 | 0.42 | 0.27 | 0.23 | 0.20 | 0.38 | 0.24 |
| P25 | 1.23 | 0.50 | 0.81 | 0.61 | 1.18 | 0.87 | |
| P50 | 1.67 | 1.18 | 1.44 | 1.35 | 1.75 | 1.50 | |
| P75 | 2.38 | 1.84 | 2.21 | 2.19 | 4.15 | 2.35 | |
| P90 | 3.16 | 2.69 | 2.82 | 3.85 | 8.30 | 3.78 | |
| PM1(part/cm3) | P10 | 0.00 | 0.61 | 0.64 | 0.54 | 0.53 | 0.46 |
| P25 | 0.52 | 1.05 | 1.49 | 1.35 | 1.86 | 1.20 | |
| P50 | 3.08 | 2.38 | 3.04 | 2.63 | 3.33 | 2.86 | |
| P75 | 4.84 | 3.57 | 4.32 | 4.23 | 7.32 | 4.57 | |
| P90 | 6.68 | 5.01 | 5.38 | 7.30 | 15.66 | 7.22 | |
| PM0.3 (part/cm3) | P10 | 0.00 | 8.93 | 23.11 | 7.02 | 8.30 | 7.38 |
| P25 | 12.91 | 12.76 | 29.46 | 10.26 | 12.73 | 13.25 | |
| P50 | 26.72 | 16.81 | 35.07 | 14.35 | 20.89 | 22.78 | |
| P75 | 38.34 | 24.92 | 45.97 | 23.50 | 45.98 | 35.79 | |
| P90 | 55.53 | 33.24 | 63.01 | 40.78 | 103.15 | 54.14 | |
| Ultrafine particles (part/cm3) | P10 | 3587 | 3050 | 3150 | 1994 | 2546 | 2420 |
| P25 | 5135 | 6080 | 5285 | 2500 | 4492 | 4400 | |
| P50 | 7575 | 8290 | 7650 | 4250 | 5935 | 6740 | |
| P75 | 9945 | 10 000 | 10 300 | 5760 | 7795 | 8980 | |
| P90 | 13 880 | 11 400 | 13 000 | 7008 | 10 110 | 11 600 | |
| VOCs (ppb) | P10 | b | 10 | 1 | b | 0 | 0 |
| P25 | 30 | 10 | 0 | 1 | |||
| P50 | 60 | 20 | 0 | 20 | |||
| P75 | 140 | 80 | 0 | 90 | |||
| P90 | 210 | 150 | 10 | 170 |
Abbreviations: P, percentile; part, particles; PM, particulate matter; ppb, parts per billion; ppm, parts per million; RH, relative humidity; SD, standard deviation; VOCs, volatile organic compounds.
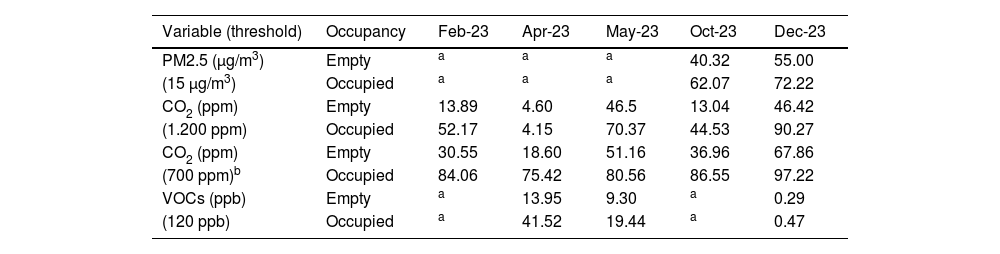
Table 5 presents the percentage of measurements of PM2.5, CO2 and VOC levels in each campaign that exceeded recommendations, taking into account whether classrooms were or not occupied at the time of measurement. We did not include smaller PM in this analysis because reference values have yet to be established for them. The analysis of the data revealed that PM2.5 levels exceeded the threshold recommended by the World Health Organization (WHO) in 40% of measurements in October and 70% of measurements in December. The highest frequency of VOC measurements exceeding the recommended threshold (41.52%) occurred in April. Carbon dioxide levels were above the recommended threshold of 1200 ppm every month they were measured except April and above 700 ppm in every campaign. During the May campaign, the 5000 ppm threshold was exceeded in 31.4% of readings in occupied classrooms. Table 6 presents the results on the association between CO2 levels and classroom occupancy.
Percentage of measurements in each campaign that exceeded the recommended threshold.
| Variable (threshold) | Occupancy | Feb-23 | Apr-23 | May-23 | Oct-23 | Dec-23 |
|---|---|---|---|---|---|---|
| PM2.5 (μg/m3) | Empty | a | a | a | 40.32 | 55.00 |
| (15 μg/m3) | Occupied | a | a | a | 62.07 | 72.22 |
| CO2 (ppm) | Empty | 13.89 | 4.60 | 46.5 | 13.04 | 46.42 |
| (1.200 ppm) | Occupied | 52.17 | 4.15 | 70.37 | 44.53 | 90.27 |
| CO2 (ppm) | Empty | 30.55 | 18.60 | 51.16 | 36.96 | 67.86 |
| (700 ppm)b | Occupied | 84.06 | 75.42 | 80.56 | 86.55 | 97.22 |
| VOCs (ppb) | Empty | a | 13.95 | 9.30 | a | 0.29 |
| (120 ppb) | Occupied | a | 41.52 | 19.44 | a | 0.47 |
PM, particulate matter; ppb, parts per billion; ppm, parts per million; VOCs, volatile organic compounds.
cMissing data due to equipment failure.
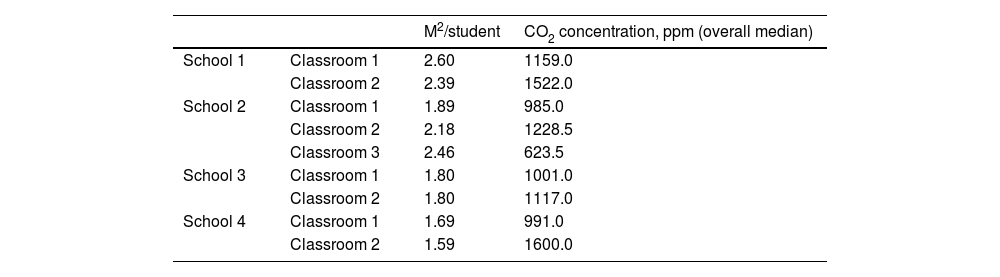
Carbon dioxide levels per classroom.
| M2/student | CO2 concentration, ppm (overall median) | ||
|---|---|---|---|
| School 1 | Classroom 1 | 2.60 | 1159.0 |
| Classroom 2 | 2.39 | 1522.0 | |
| School 2 | Classroom 1 | 1.89 | 985.0 |
| Classroom 2 | 2.18 | 1228.5 | |
| Classroom 3 | 2.46 | 623.5 | |
| School 3 | Classroom 1 | 1.80 | 1001.0 |
| Classroom 2 | 1.80 | 1117.0 | |
| School 4 | Classroom 1 | 1.69 | 991.0 |
| Classroom 2 | 1.59 | 1600.0 |
Fig. 2 presents the data on the association relationship between pollutant levels and classroom occupancy. For PM1 and PM0.3, the levels were higher when the classrooms were occupied, as was the case for PM2.5, and these differences were statistically significant. In the case of VOC levels, we found a difference in comparison to the times classrooms were not occupied, with a mean difference (MD) of 36.21 ppb (95% confidence interval [CI], 21.87–50.55). We observed a similar trend in temperature, with higher values when the classrooms were occupied (MD, 1.28 °C; 95% CI, 0.76–1.80), and in CO2 levels (MD for pooled data, 623.39 ppm; 95% CI, 378.70–868.08).
. Abbreviations: part, particles; PM, particulate matter; ppm, parts per million; RH, relative humidity; T, temperature; VOCs, volatile organic compounds.")
Differences in pollutant levels between empty and occupied classrooms. Data grouped for all campaigns, measurements and schools. Levels expressed as part/m3 for PM and ppm for VOCs. Results are significant if the box is shaded (t test with Holm-Bonferroni correction).
Abbreviations: part, particles; PM, particulate matter; ppm, parts per million; RH, relative humidity; T, temperature; VOCs, volatile organic compounds.
The analysis of the correlation between airborne particles and environmental conditions showed a positive correlation between PM2.5 and PM1 levels (correlation coefficient [CC], 0.983; P < .05) and PM2.5 and PM0.3 levels (CC, 0.439; P < .05). It also showed a positive correlation between humidity and PM0.3 levels (CC, 0.149; P < .05), PM1 levels (CC, 0.258; P < .05) and PM2.5 levels (CC, 0.259; P < .05), and a negative correlation between humidity and UFP levels (CC, −0.216; P < .05).
DiscussionThis study analyzed the presence and levels of different pollutants and the temperature and humidity inside primary education classrooms in four schools in the Community of Madrid. We found levels above the thresholds recommended by different regulatory agencies in several of the variables under study: PM2.5, VOC and CO2 levels. Their values were similar to those previously reported in the literature, so it is reasonable to assume that they would produce similar symptoms in the children who spent time in those classrooms.10
A relevant aspect worth highlighting is the absence of reference levels for small particles, as is the lack of a regulatory framework for indoor air quality in classrooms. In respect of PM2.5 concentrations, the WHO differentiates between high and low UFP exposure levels out of doors (between 1000 and 10 000 part/cm3 for a 24-h mean). There are no reference values for indoor air, and the UFP concentrations reported in the previous literature range between 5700 to 9000 part/cm3 in schools in Portugal25 or Australia26 and 12 000 to 18 000 part/cm3 in schools in Barcelona.20 In our study, we found a concentration ranging from 4417.88 part/cm3 in October, when there is a higher relative humidity, to 8290.80 part/cm3 in February, when humidity and temperature were both lower, with similar values across schools despite the differences in location, which were closer to the values reported in Portugal or Australia. When it came to particles measuring between 0.1 μm and 2.5 μm, we did not find any previous studies analyzing their association with health problems, so it is important that this potential association is investigated to better understand the role of exposure to PM in indoor air. This is one of the objectives of our project.
With regard to the presence of VOCs in classrooms, we found a statistically significant increase in their levels when the classrooms were occupied. This can be explained by the source of these compounds, including school supplies, and by the increase in temperature that occurs in classrooms when they are occupied. The data were similar in all four schools, so location probably did not play a role in these results.
Carbon dioxide levels rarely cause symptoms, but they are an indirect marker of indoor air quality, closely related to classroom ventilation and occupancy. The Community of Madrid has established objective thresholds for public buildings based on their use, considering values above 1200 ppm indicative of poor indoor air quality, especially in settings in which human respiration is the main source of CO2.27 The AEP considers 500 ppm the optimal concentration for classrooms and recommends intervention for levels above 700 ppm.28 Our study found increased CO2 levels when classrooms were occupied. This is important for the academic performance of schoolchildren. A study conducted in the United States showed that an indoor concentration exceeding the outdoor concentration by more than 1000 ppm was associated with a 0.5% to 0.9% decrease in daily attendance, corresponding to an increase of 10%–20% in student absence compared to schools with better ventilation.29 Another study, conducted in 2011, suggested that higher ventilation rates could be associated with higher scores in standardized mathematics and reading achievement tests.30 Our study found variations in CO2 concentrations in classrooms with different sizes and occupancy levels, which is likely associated with ventilation rates.
The correlation between the concentration of airborne particles and humidity has already been described in the literature, highlighting the impact that weather can have on pollutant levels.31 Increases of indoor temperatures in classrooms, as observed in the Spring campaigns in our study, must be taken into account, as they are associated with decreased student attendance11 and poorer academic performance: Goodman et al. reported that a 0.55 °C increase in indoor temperatures in school correlated to a reduction in learning of 1% of the expected gains for the year.32
As mentioned above, weather affects air quality parameters such as PM concentrations, and increases in temperature and occupancy in classrooms are associated with higher VOC and CO2 levels. Consequently, we propose that an appropriate architectural design can help reduce exposure to pollutants inside classrooms by controlling factors such as the size and orientation of the classrooms, the layout and shape of doors and windows, the choice of construction materials and furniture, the location within the urban area, etc. When it comes to schools that have already been constructed, making recommendations or suggesting changes in how the buildings are used can contribute to improving indoor air quality.
Among the strengths of our study, we would highlight the fact that it included schools that varied in terms of location and architecture. This allowed a more comprehensive approach to the identification of pollutants and their sources, in which we considered both the structure and the use of the facilities. The use of specific sensors and the detailed statistical analysis guaranteed the quality and reliability of the data. Conducting fieldwork in different campaigns, through different seasons, with measurements taken at different times of day, yielded a comprehensive overview of potential variations in indoor air quality. The study included pollutants for which the data are scarce in the current literature, such as PM1, PM0.3 and UFP. These particles, due to their small size, can reach the airways of smallest caliber and even the bloodstream, and therefore could cause disease in children.33 Thanks to the positive collaboration with the teaching staff of each school and the ongoing communication with families, we were able to optimize data collection.
There are limitations to our study, among which we ought to highlight its limited generalizability, as the sample included only four schools and may not have been representative of centers with different socioeconomic and geographical characteristics. Due to the lack of regulatory requirements for small particulate matter, it is not possible to determine the impact of their actual levels. The strength of our findings is also limited by the loss of data for PM2.5 or VOC levels at some time points. Although we carried out a longitudinal analysis, the measurement period may not have allowed detection of exceptional phenomena or long-term variation. Also, although we obtained data for specific activities in classrooms, including ventilation, the recording of these data by teaching staff was not exhaustive, which hinders the analysis of the impact of these activities on pollutant levels.
The project is still underway and is currently focused on assessing the health of classroom occupants. The sources of pollutants are also being investigated with the aim of providing guidelines for facility management, such as ventilation or cleaning recommendations or changing certain materials in furniture or other fungible items. One of the ultimate objectives of the project is the development and diffusion of a document that could serve as a guideline for improving indoor quality in schools.
In conclusion, our study assessed which indoor pollutants were present in primary schools, as well as their levels, in the Community of Madrid. The participating schools had CO2, PM2.5 and VOC levels exceeding the currently recommended thresholds. The normal range for PM2.5 levels needs to be established, and research on pollutant levels and their sources should continue until, once this knowledge is available, control measures can be developed. While awaiting the necessary evidence, our findings suggest the need to implement measures to improve air quality in classrooms.
FundingThis project has been funded through the Lime4Health project, recipient of a Knowledge Generation grant from the Spanish Ministry of Science and Innovation, 2021 (code PID 2021-123023OA-I00).

