
Right ventricle (RV) measurements are crucial for certain congenital heart diseases and various cardiovascular conditions. Echocardiographic RV diameters are especially useful for its assessment. Paediatric echocardiographic data standardisation in normal subjects is complex, scarce, and heterogeneous. The aim of this study was to establish reliable and reproducible echocardiographic reference values (Z-score) of RV diameters in a healthy Spanish paediatric cohort.
MethodsA multicentre study was conducted on 661 healthy subjects (age range 0–18 years, 43.5% female). Several regression models were tested to examine the relationship between RV diameters and biometric variables. Heteroscedasticity and residual associations (Shapiro–Wilk and Breusch–Pagan tests) and confounding factors (gender, age, inter/intraobserver agreement) were considered for an unbiased standardisation.
ResultsStructured Z-scores were computed for each RV diameter. Predicted mean value for each diameter was determined according to age, weight, height, and different body surface area. The Haycock formula provided the best fit for basal, midcavity, and longitudinal diameters (R2 0.81, 0.82, 0.9). Confounders were not significant, and therefore not included in final models (inter/intraobserver agreement > 0.9).
ConclusionsThis study reports reference values for echocardiographic RV diameters from a Spanish healthy paediatric cohort using a rigorous statistical design. These Z-scores partly cover a gap in current paediatric cardiology and represent a relevant diagnostic tool for clinical practice, as well as a useful guide to decision making at any paediatric stage.
La cuantificación del tamaño del ventrículo derecho (VD) es crucial en determinadas cardiopatías congénitas. Para su evaluación se recomiendan distintas técnicas de imagen, siendo más accesible la medición de diámetros ventriculares mediante ecocardiografía. En pediatría la normalización de parámetros ecocardiográficos es compleja, escasa y heterogénea. El objetivo de este estudio consistió en establecer Z-score de diámetros de VD fiables y reproducibles capaces de predecir valores de referencia en población pediátrica sana española.
MétodosEstudio multicéntrico prospectivo de 661 pacientes sanos (edades 0–18 años, 43.5% mujeres). Los diámetros ecocardiográficos del VD se relacionaron con variables biométricas mediante distintas ecuaciones de regresión. Para su estandarización se analizaron factores de confusión (sexo, edad y variabilidad inter/intraobservador), heterocedasticidad y residuos (test Saphiro–Wilk y Breusch–Pagan).
ResultadosSe obtuvieron curvas de normalidad (Z-score) para cada diámetro del VD que permitieron predecir el valor medio de cada diámetro en función de la edad, peso, talla y distintas superficies corporales. La superficie corporal según fórmula de Haycock ofreció un excelente ajuste para los distintos diámetros basal, medial y longitudinal (R2 0.81, 0.82, 0.9). Los factores de confusión no aportaron cambios significativos, por lo que no fueron incluidos en los modelos finales (variabilidad inter e intraobservador, CCI > 0.9).
ConclusionesSe brindan valores de referencia de diámetros VD de población pediátrica sana. Las curvas de Z-score ofrecidas cubren una importante carencia en cardiología pediátrica y son aplicables a todos los grupos de edad para evaluar el tamaño del VD, de gran interés clínico en la práctica diaria.
In cardiology, many decisions regarding medical, catheter-based or open surgery interventions are made based on the size of cardiac structures. The follow-up of children that have or have not undergone correction of congenital heart defects may also depend on how heart growth and development deviates from what is expected. The detection of pathological changes in heart structures requires a precise definition of what is normal.
In paediatrics, the normal heart size varies based on various biometric determinants intrinsic to development and is affected by multiple confounding factors. Although guidelines for the assessment of the right ventricle (RV) in adults have been published recently,1 there are currently no guidelines for the echocardiographic evaluation of the RV in paediatrics, and therefore the development of validated and reliable reference values is essential.2 Establishing the size of the normal RV in the healthy paediatric population would allow the optimal evaluation of patients with abnormalities, which would have an important impact on diagnosis and prognosis.
Our study focused in the measurement of the right ventricular diameter of healthy children to establish normal ranges (z-score distributions) useful for the detection of abnormal RVs with an easy and reproductible approach.
MethodsWe conducted a multicentre, prospective, cross-sectional observational study in 661 healthy children recruited over 4 years in different paediatric cardiology clinics. We estimated that we would need 88 patients or more per age group to obtain representative data. We calculated this sample size for a 95% confidence level and a margin of error of 0.106 assuming a standard deviation of 0.5.
We classified children into age groups applying the age bands established by the World Health Organization (WHO): newborn (0–28 days), infant (29 days to 24 months), young child (25 months to 5 years) child (6–10 years), adolescents (11–18 years).
Inclusion criteriaHealthy white children seeking care for a functional murmur or other reasons and without evidence of congenital or acquired structural abnormalities in the electrocardiogram (ECG) or echocardiographic examination. We considered a small, clinically insignificant ductus arteriosus in the first 3 days post birth and patent foramen ovale normal.
Exclusion criteriaWe excluded patients with chest wall deformities, neuromuscular disease, syndromes or chromosomal disorders, high blood pressure, pulmonary hypertension, a family history of genetic disease (such as Marfan syndrome), age 19 years or greater or preterm birth.
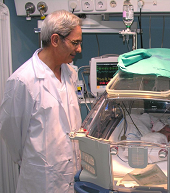
Echocardiographic evaluationTwo ultrasound systems were used: the Phillips iE33 (Phillips Medical Systems; Bothell, Washington, USA) and the Hitachi Aloka Pro Sound Alpha 7 (Aloka Medical Ltd). The images were captured with multifrequency linear transducers (8 MHz transducers for newborns and similarly aged patients and 5 MHz transducers for patients of greater age and weight). Three cardiac cycles were recorded, and each measurement was taken twice (at different heart beats), with subsequent calculation of the mean of both values. Three experienced echocardiographers measured the basal, mid-cavity and longitudinal RV diameters in the 4-chamber apical view following a standardised protocol and guidelines for the measurement of the RV3,4 (Fig. 1); the observed interrater variability is described below. The images were obtained at the end of the diastole (right before the closure of the tricuspid valve, coinciding with the onset of the QRS complex) including the trabeculations (measuring up to the endocardial border) simultaneously with ECG recording. The analysis of the images was performed in the ultrasound system or with the clinical workstation post-processing software EchoPAC version 6.3.6 (GE Medical Systems). We did not find any significant differences based on the system used for image acquisition or for post-processing analysis. We only included patients with images of good quality and an appropriate echocardiographic window (visualization of endocardium and entire RV free wall).
Definitions and reference values
We defined normal RV diameter as a diameter corresponding to a z-score between –2 and +2. We used body surface area (BSA) formulas developed by de Haycock, DuBois, Mosteller, Boyd, Gehan and Meban to normalise RV diameters.5–10
Statistical analysisWe normalised the different diameters using parametric normalization models (z-score distribution) adjusted for age and biometric variables (weight, height and body surface area). We fitted different regression models (lineal, logarithmic, exponential, square root and cubic) to analyse the association of the parameters under study. For each regression model, we analysed the residuals using graphic methods, a test of normality (Shapiro–Wilk) and a test of heteroskedasticity (Breusch–Pagan test). We defined statistical significance as a p-value of 0.05 (two-tailed).
Of the models that met the assumptions, we selected the one that was simplest and offered the best fit (R2) to develop the z-score curves. The z-score is a standardised value that expresses the number of standard deviations by which a specific value is above or below the mean of a normal population.
We used multivariate models and stratified analyses to assess the effect of sex as a confounder. We assessed inter-rater and intrarater agreement in 20 subjects and calculated the intraclass correlation coefficient (ICC) by means of repeated measures and mixed model analysis of variance.
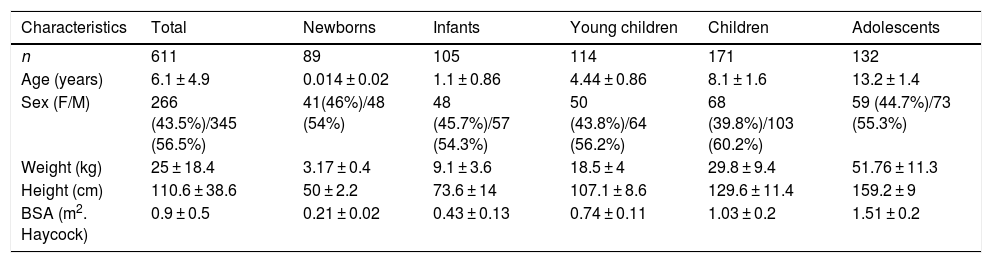
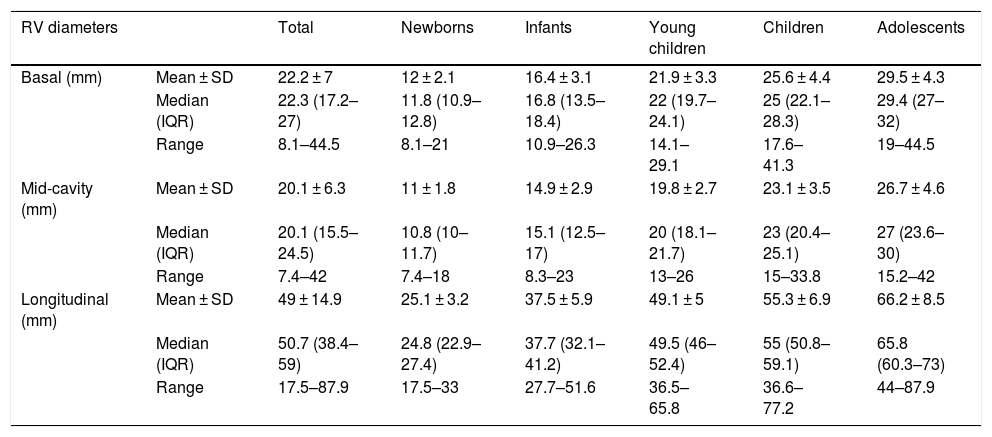
ResultsStudy sampleTable 1 presents the demographic characteristics of the sample. Table 2 presents the right ventricular diameters by age group.
Characteristics of the sample, expressed as mean ± standard deviation or as absolute frequency (percentage).
| Characteristics | Total | Newborns | Infants | Young children | Children | Adolescents |
|---|---|---|---|---|---|---|
| n | 611 | 89 | 105 | 114 | 171 | 132 |
| Age (years) | 6.1 ± 4.9 | 0.014 ± 0.02 | 1.1 ± 0.86 | 4.44 ± 0.86 | 8.1 ± 1.6 | 13.2 ± 1.4 |
| Sex (F/M) | 266 (43.5%)/345 (56.5%) | 41(46%)/48 (54%) | 48 (45.7%)/57 (54.3%) | 50 (43.8%)/64 (56.2%) | 68 (39.8%)/103 (60.2%) | 59 (44.7%)/73 (55.3%) |
| Weight (kg) | 25 ± 18.4 | 3.17 ± 0.4 | 9.1 ± 3.6 | 18.5 ± 4 | 29.8 ± 9.4 | 51.76 ± 11.3 |
| Height (cm) | 110.6 ± 38.6 | 50 ± 2.2 | 73.6 ± 14 | 107.1 ± 8.6 | 129.6 ± 11.4 | 159.2 ± 9 |
| BSA (m2. Haycock) | 0.9 ± 0.5 | 0.21 ± 0.02 | 0.43 ± 0.13 | 0.74 ± 0.11 | 1.03 ± 0.2 | 1.51 ± 0.2 |
BSA, body surface area; F, female; M, male.
Distribution of right ventricular diameters by age group.
| RV diameters | Total | Newborns | Infants | Young children | Children | Adolescents | |
|---|---|---|---|---|---|---|---|
| Basal (mm) | Mean ± SD | 22.2 ± 7 | 12 ± 2.1 | 16.4 ± 3.1 | 21.9 ± 3.3 | 25.6 ± 4.4 | 29.5 ± 4.3 |
| Median (IQR) | 22.3 (17.2–27) | 11.8 (10.9–12.8) | 16.8 (13.5–18.4) | 22 (19.7–24.1) | 25 (22.1–28.3) | 29.4 (27–32) | |
| Range | 8.1–44.5 | 8.1–21 | 10.9–26.3 | 14.1–29.1 | 17.6–41.3 | 19–44.5 | |
| Mid-cavity (mm) | Mean ± SD | 20.1 ± 6.3 | 11 ± 1.8 | 14.9 ± 2.9 | 19.8 ± 2.7 | 23.1 ± 3.5 | 26.7 ± 4.6 |
| Median (IQR) | 20.1 (15.5–24.5) | 10.8 (10–11.7) | 15.1 (12.5–17) | 20 (18.1–21.7) | 23 (20.4–25.1) | 27 (23.6–30) | |
| Range | 7.4–42 | 7.4–18 | 8.3–23 | 13–26 | 15–33.8 | 15.2–42 | |
| Longitudinal (mm) | Mean ± SD | 49 ± 14.9 | 25.1 ± 3.2 | 37.5 ± 5.9 | 49.1 ± 5 | 55.3 ± 6.9 | 66.2 ± 8.5 |
| Median (IQR) | 50.7 (38.4–59) | 24.8 (22.9–27.4) | 37.7 (32.1–41.2) | 49.5 (46–52.4) | 55 (50.8–59.1) | 65.8 (60.3–73) | |
| Range | 17.5–87.9 | 17.5–33 | 27.7–51.6 | 36.5–65.8 | 36.6–77.2 | 44–87.9 | |
IQR, interquartile range; RV, right ventricle; SD, standard deviation.
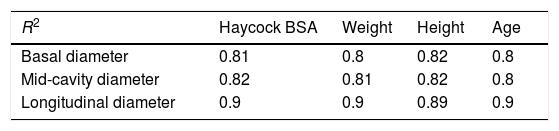
Of the models that fulfilled the normal distribution of residuals and homogeneity of variance assumptions, we selected the one with the highest coefficient of determination, finding very small differences between the BSA and other biometric parameters used for indexing (Table 3). We selected the BSA calculated with the Haycock formula1,4,11,12 as the most suitable biometric parameter for normalization of RV diameters (R2 values of 0.81, 0.82 and 0.9 for the different diameters), followed by weight, height and lastly age.
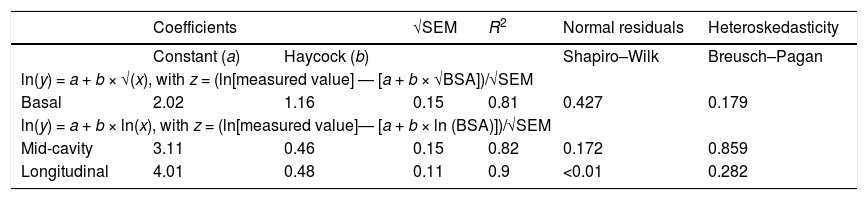
The regression equations that best fitted the different diameters and the BSA corresponded to nonlinear models.
For the association of the basal diameter and the BSA using the Haycock formula, we used square root transformation:
ln(y) = a + b × √(x), so that z = (ln[measured value] – [a + b × √SC])/√SEM, where SEM stands for the standard error of the mean.
Exponential equations provided the best fit for the mid-cavity and longitudinal diameters:
ln(y) = a + b × ln(x), so that z = (ln[measured value] – [a + b × ln(BSA)]/√SEM
These equations satisfied the assumptions of homoskedasticity and normality of residuals with excellent R2 values (Table 4), allowing a more homogeneous variance across the full BSA range.
Regression equations associating right ventricular diameters with body surface area (Haycock formula). Shapiro–Wilk test for normality. Breusch–Pagan test for heteroskedasticity. Standard error of estimate. Coefficient of determination.
| Coefficients | √SEM | R2 | Normal residuals | Heteroskedasticity | ||
|---|---|---|---|---|---|---|
| Constant (a) | Haycock (b) | Shapiro–Wilk | Breusch–Pagan | |||
| ln(y) = a + b × √(x), with z = (ln[measured value] ― [a + b × √BSA])/√SEM | ||||||
| Basal | 2.02 | 1.16 | 0.15 | 0.81 | 0.427 | 0.179 |
| ln(y) = a + b × ln(x), with z = (ln[measured value]― [a + b × ln (BSA)])/√SEM | ||||||
| Mid-cavity | 3.11 | 0.46 | 0.15 | 0.82 | 0.172 | 0.859 |
| Longitudinal | 4.01 | 0.48 | 0.11 | 0.9 | <0.01 | 0.282 |
BSA, body surface area; SEM, standard error of the mean.
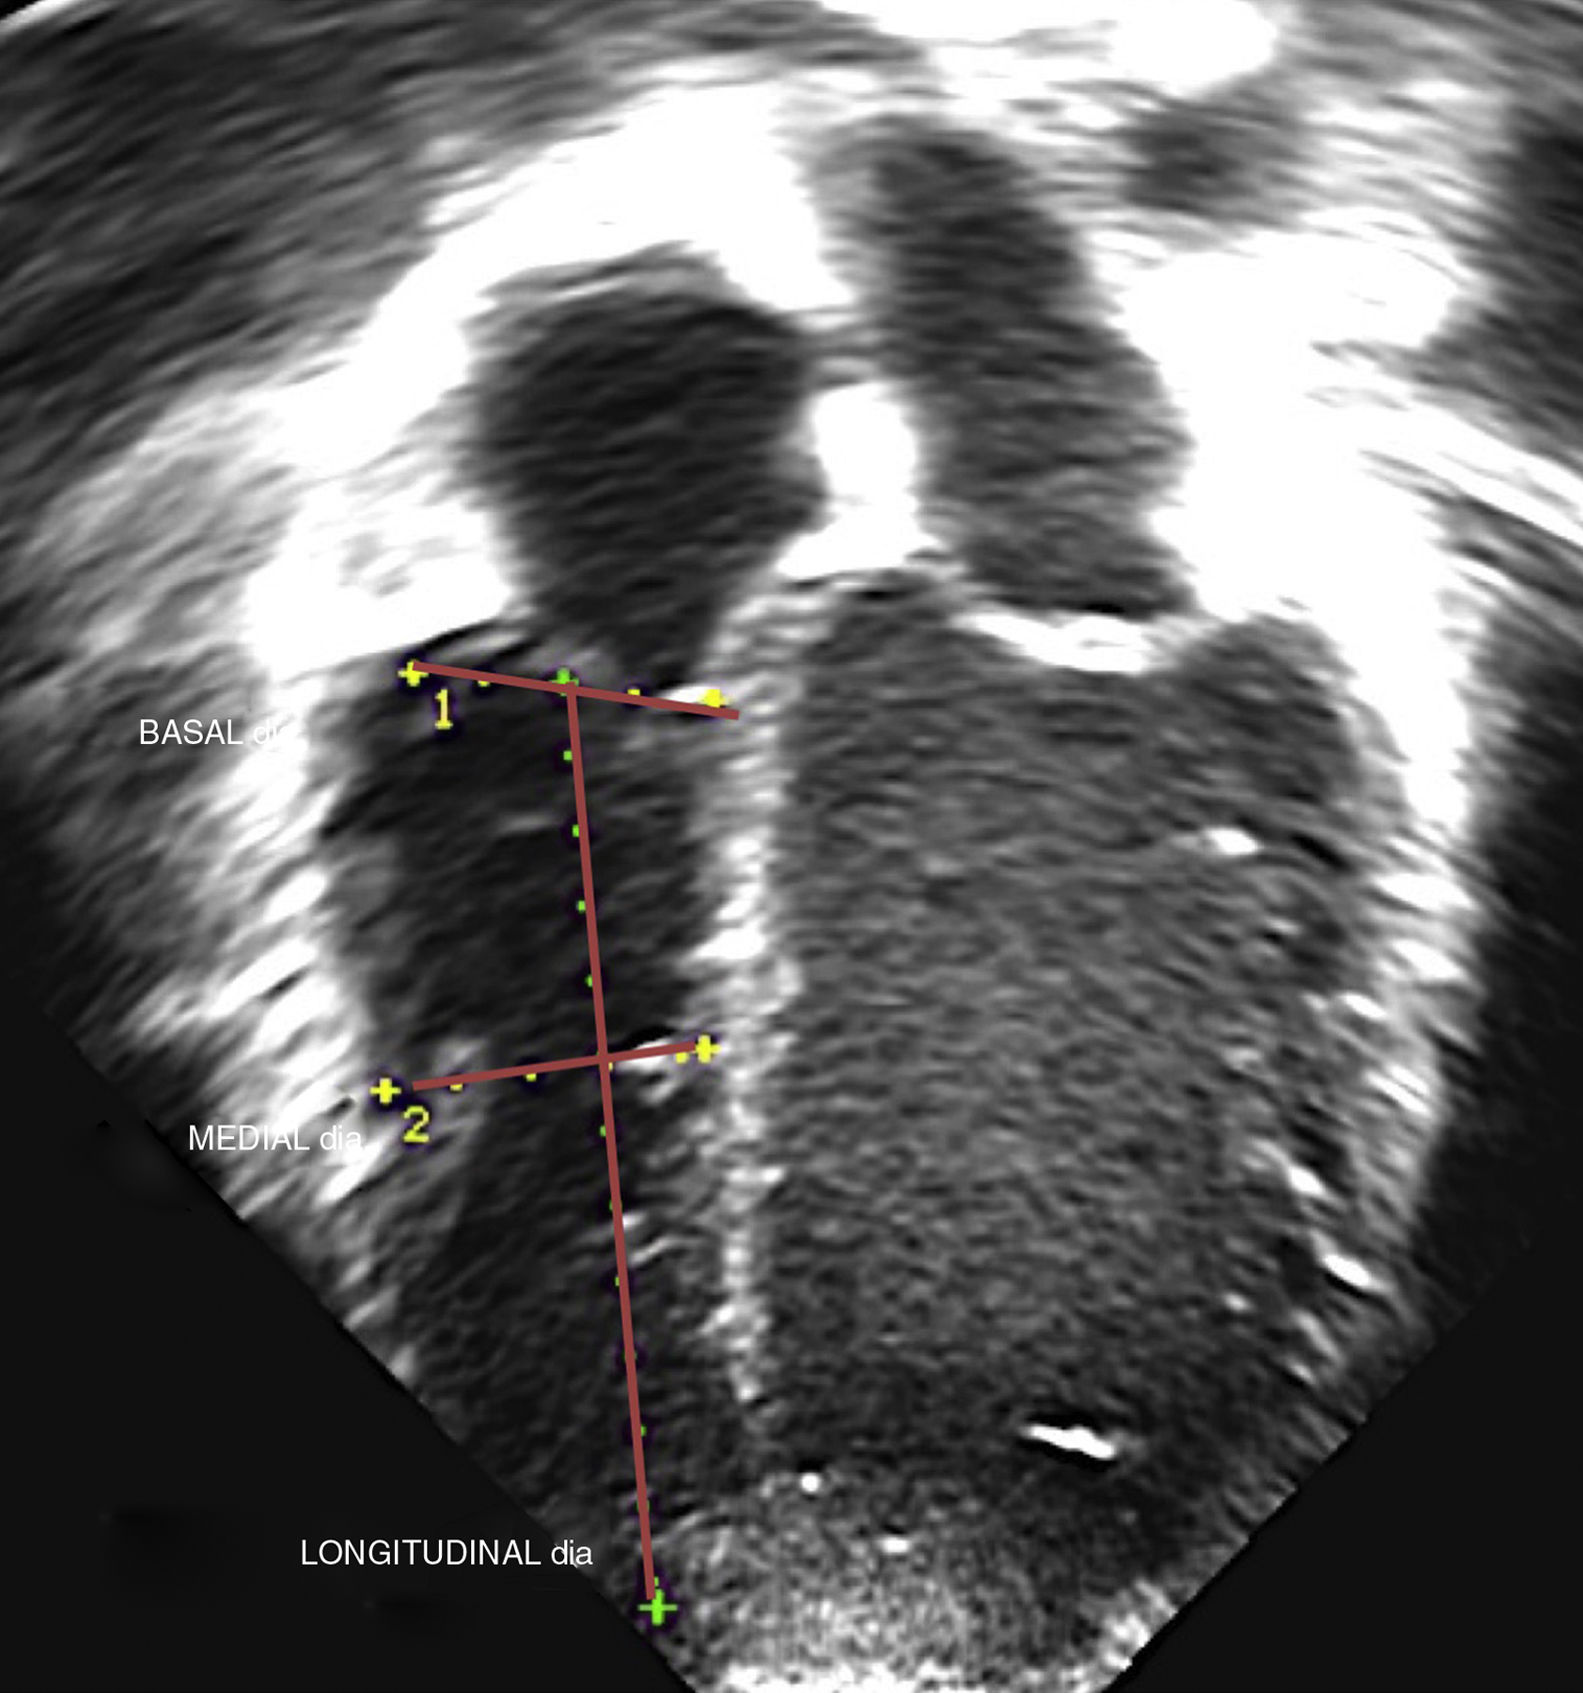
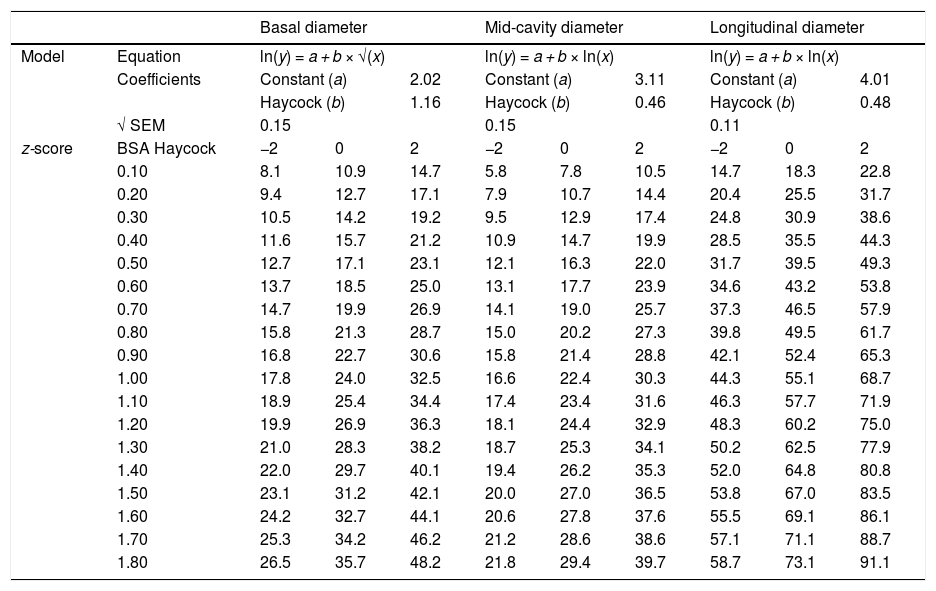
We proceed to present the z-score curves for the different RV diameters indexed by BSA (Haycock formula) accompanied by the regression equation, normalised residual plot and homoskedasticity (Fig. 2). The z-score of a given RV diameter can be identified by finding the diameter value in the z-score curves or consulting Table 5.
. Left: regression model, standardised residuals and homoskedasticity.")
Right ventricular values normalised by body surface area (Haycock formula) corresponding to z-scores of 0, +2 and –2.
| Basal diameter | Mid-cavity diameter | Longitudinal diameter | ||||||||
|---|---|---|---|---|---|---|---|---|---|---|
| Model | Equation | ln(y) = a + b × √(x) | ln(y) = a + b × ln(x) | ln(y) = a + b × ln(x) | ||||||
| Coefficients | Constant (a) | 2.02 | Constant (a) | 3.11 | Constant (a) | 4.01 | ||||
| Haycock (b) | 1.16 | Haycock (b) | 0.46 | Haycock (b) | 0.48 | |||||
| √ SEM | 0.15 | 0.15 | 0.11 | |||||||
| z-score | BSA Haycock | −2 | 0 | 2 | −2 | 0 | 2 | −2 | 0 | 2 |
| 0.10 | 8.1 | 10.9 | 14.7 | 5.8 | 7.8 | 10.5 | 14.7 | 18.3 | 22.8 | |
| 0.20 | 9.4 | 12.7 | 17.1 | 7.9 | 10.7 | 14.4 | 20.4 | 25.5 | 31.7 | |
| 0.30 | 10.5 | 14.2 | 19.2 | 9.5 | 12.9 | 17.4 | 24.8 | 30.9 | 38.6 | |
| 0.40 | 11.6 | 15.7 | 21.2 | 10.9 | 14.7 | 19.9 | 28.5 | 35.5 | 44.3 | |
| 0.50 | 12.7 | 17.1 | 23.1 | 12.1 | 16.3 | 22.0 | 31.7 | 39.5 | 49.3 | |
| 0.60 | 13.7 | 18.5 | 25.0 | 13.1 | 17.7 | 23.9 | 34.6 | 43.2 | 53.8 | |
| 0.70 | 14.7 | 19.9 | 26.9 | 14.1 | 19.0 | 25.7 | 37.3 | 46.5 | 57.9 | |
| 0.80 | 15.8 | 21.3 | 28.7 | 15.0 | 20.2 | 27.3 | 39.8 | 49.5 | 61.7 | |
| 0.90 | 16.8 | 22.7 | 30.6 | 15.8 | 21.4 | 28.8 | 42.1 | 52.4 | 65.3 | |
| 1.00 | 17.8 | 24.0 | 32.5 | 16.6 | 22.4 | 30.3 | 44.3 | 55.1 | 68.7 | |
| 1.10 | 18.9 | 25.4 | 34.4 | 17.4 | 23.4 | 31.6 | 46.3 | 57.7 | 71.9 | |
| 1.20 | 19.9 | 26.9 | 36.3 | 18.1 | 24.4 | 32.9 | 48.3 | 60.2 | 75.0 | |
| 1.30 | 21.0 | 28.3 | 38.2 | 18.7 | 25.3 | 34.1 | 50.2 | 62.5 | 77.9 | |
| 1.40 | 22.0 | 29.7 | 40.1 | 19.4 | 26.2 | 35.3 | 52.0 | 64.8 | 80.8 | |
| 1.50 | 23.1 | 31.2 | 42.1 | 20.0 | 27.0 | 36.5 | 53.8 | 67.0 | 83.5 | |
| 1.60 | 24.2 | 32.7 | 44.1 | 20.6 | 27.8 | 37.6 | 55.5 | 69.1 | 86.1 | |
| 1.70 | 25.3 | 34.2 | 46.2 | 21.2 | 28.6 | 38.6 | 57.1 | 71.1 | 88.7 | |
| 1.80 | 26.5 | 35.7 | 48.2 | 21.8 | 29.4 | 39.7 | 58.7 | 73.1 | 91.1 | |
BSA, body surface area; SEM, standard error of the mean.
We fitted multivariate models that included sex as a confounder. We found a statistically significant (P < .05) but negligible effect. Afterwards, we performed an analysis stratified by age group in which we also included sex. This yielded estimates that were nearly equal, so we decided not to correct the different models for sex.
We analysed the effect of age on the different ventricular diameters, and found high R2 values (0.79, 0.8, 0.9) demonstrating a strong association between these variables.
In the neonatal group, we assessed the association between ventricular diameters and weight. The highest R2 was 5.7%, and the assumption of the normal distribution of residuals was not met. We also assessed the association between ventricular diameters and the Meban BSA formula. When we fitted different models to establish this association, we found that the best coefficient of determination was 4% and the assumption of the normality of residuals was not met.
In the adolescent group we analysed the association between ventricular diameters and height. The best model that met the assumptions corresponded to an R2 of 14%.
Inter- and intrarater reliabilityWe assessed reliability in 20 patients and found a high level of agreement for all measures (ICC > 0.9). The highest inter-rater variability corresponded to the mid-cavity diameter.
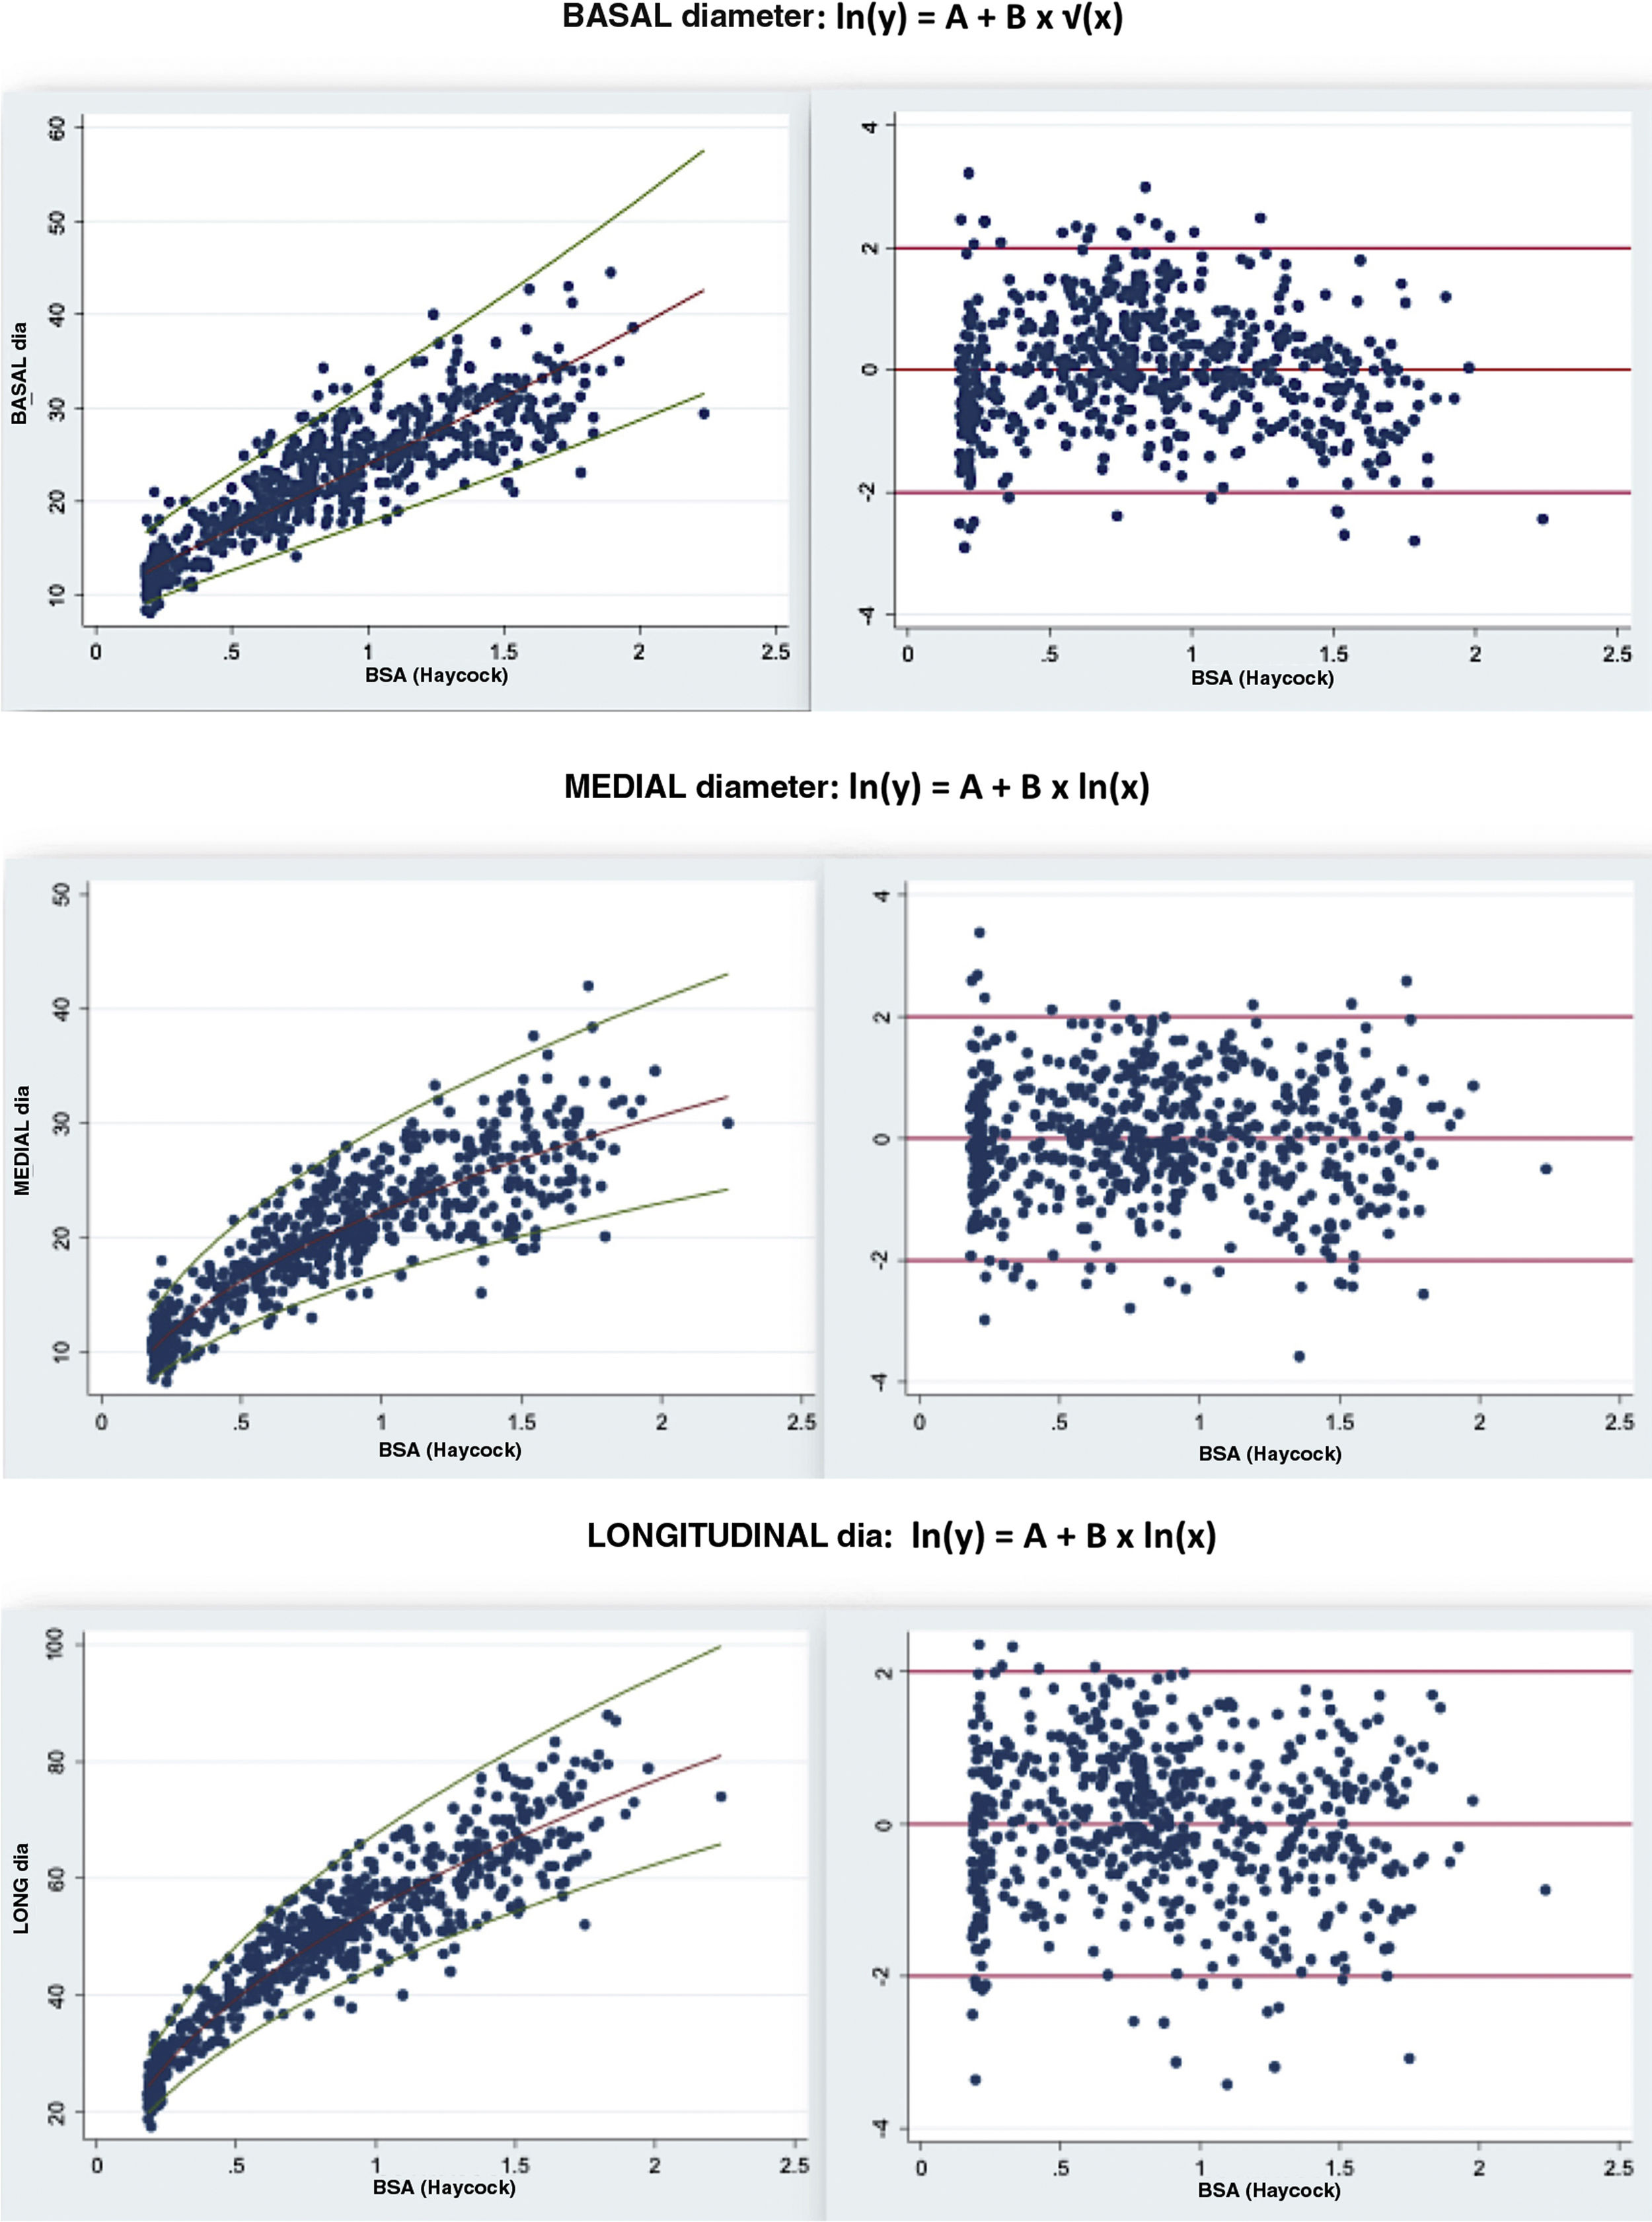
Comparison with the literatureWe present z-score curves based on data from the population of healthy white children in Spain. Other authors have also developed z-score curves in the paediatric population. We thought it would be interesting to compare our z-score curves with those published by Koestenberger et al.13 and Cantinotti et al.,11 graphically and through calculation of the coefficient of agreement.
Cantinotti et al. normalised values using the Haycock BSA formula and published their regression models. Fig. 3 provides a graphical comparison of the z-score curves obtained in our study with those obtained by Cantinotti et al. We found good agreement in the mid-cavity and longitudinal diameters (concordance indices of 0.9 and 0.76) and an underestimation of the basal diameter (concordance index of 0.36).

Koestenberger et al. indexed RV measures by BSA (Mosteller formula) and age. Their article did not include the equations of the regression models, so we were unable to calculate concordance indices. We made a subjective, visual comparison of the z-score curves obtained in our study with those obtained by Koestenberger et al. and considered that there was greater agreement in the mid-cavity and longitudinal diameters, and once again underestimation of the basal diameter z-scores.
Given the discrepancy we had observed in the basal diameter values, we compared the values obtained by Cantinotti et al. with those obtained by Koestenberger et al. normalising the RV diameters by BSA. Once again, we found a good correlation in the mid-cavity and longitudinal diameters but found disagreement in the basal diameters.
DiscussionThe assessment of the RV with imaging techniques is essential, as many medical and surgical management decisions are made based on the dimensions of this chamber. Our study focused on the use of 2D echocardiography because it is a simple, inexpensive and widely available technique. The dimensions of the RV at the inlet and in the trabecular zone are optimal measures due to their repeatability, easy measurement in the apical 4-chamber view and an ample body of evidence supporting their use. However, we must not forget the RV outlet, which is significantly dilated in some congenital heart diseases.
The need to standardise echocardiographic parameters in paediatric cardiology stems from another obvious need, which is to establish reference values. Once normal is known and defined, it will be possible to detect the pathological. Despite these essential needs, expressed in the main echocardiography guidelines,4,14 efforts to standardise measurements of heart structures in the paediatric population have yet to bear fruit. Reference value ranges have been proposed for most structures,15 but there are no specific guidelines for the evaluation of the RV in the paediatric population, and the available guidelines for its evaluation in adults2,3 cannot be applied to children because the measurements are not indexed by any biometric parameter (such as body surface area).
Several authors12 have demonstrated that despite advances in methodology, the normalization of echocardiographic measures in paediatrics has not been properly validated and is thus not reliable.11,13
Our study fulfils the required criteria for normalization of echocardiographic measures described in the literature12,16,17 as follows:
- 1
We collected RV dimensions following a uniform protocol that adhered to current guidelines.
- 2
The cohort under study was homogeneous, with similar sizes for each age group and all participants being white, which makes it possible to obtain normal values for a specific population (Spanish and/or white) and to make comparisons with populations of similar characteristics and difference race.
- 3
We selected the most suitable biometric parameter for the normalization of right ventricular diameters (BSA calculated with Haycock formula), followed by weight, height and age.
The normalization of echocardiographic parameters in paediatrics is challenging due to allometry (the influence of bodily growth on the heart chambers) and other confounders. This results in substantial variability and disagreement in the measurements of a given parameter that has an impact on clinical decision-making. To address this problem, echocardiographic values are adjusted based on biometric variables (weight, height or BSA), as this allows to take into account the change in cardiac dimensions that occurs in growing children. However, there is still disagreement as to which is the most suitable biometric variable to use for this purpose. Several authors propose that, overall, the body surface area is the best indicator of somatic growth, performing better than weight or height alone in the paediatric population.1,18 In our study, the best fit also corresponded to the BSA (although followed closely by weight) with a lesser influence of height or age.
The BSA is not a perfect parameter, as depending on the formula used in its calculation different normalised values will be obtained from the same measurement, with a degree of variation that will depend on the magnitude of the weight or height of the patient. Considering this issue, in our study we analysed the differences in the values obtained using different BSA formulas and found an R2 greater than 0.99 for their association, which suggests that any BSA formula could be used for normalising RV diameter values.
- 4
None of the variables followed a normal distribution, which extended to the residual distribution and was associated with heteroskedasticity. To counteract these phenomena, we applied specific statistical methods15–17 and parametric methods: development of z-score charts for the association of RV diameters (dependent variable) and body surface area (independent variable) using regression equations capable of estimating the theoretical mean of the RV diameter for a given BSA.
The use of z-scores is essential in paediatrics for estimating the distribution of measured values through the range of body sizes in the normal population, thus allowing the identification of abnormal dimensions. Their use is endorsed and recommended by the United States echocardiography guidelines as the best parametric normalization method for the purpose of establishing reference values. However, z-scores are not absolutely accurate and should always be interpreted taking into account the clinical context of the patient.19
- 5
We fitted linear and nonlinear regression models. We selected nonlinear models (exponential and square root) because they were simpler and allowed a correct fit (visual and statistical) throughout the sample.
To prevent heteroskedasticity and obtain results that could be extrapolated to the general population, we used logarithmic and square root transformation in the regression equations, which we subsequently assessed with the Breusch–Pagan test. We then used the Shapiro-Wilk test to select models with a normality of the error distribution and a high predictive power.
- 6
We analysed confounding factors and found no significant changes in the results.
The confounding factors we analysed in our sample were age, sex and inter- and intrarater reliability. We fitted multivariate regression models and used analysis of variance to assess the effect of these factors on ventricular diameters.
In our study, we found a strong association of age with RV diameters as evinced by high R2 values nearing the values achieved with the BSA, suggesting a strong association between both variables. There is evidence that specific analysis is necessary in the extreme age groups (newborns and adolescents), subsets of the population in which the use of the BSA for indexing is more controversial. Ahn et al.20–22 claim that weight provides a better fit in newborns and Motz et al.23,24 propose the use of height in adolescents, and therefore we analysed the fit for these two variables. We found that the coefficients of determination were significantly lower and that the assumption of the normal distribution of residuals was not met. It is possible that the disagreement with our findings is due to these authors analysing different variables in their studies.
We found a significant effect of sex, but negligible, and therefore sex was not included in the definitive models. Many articles provide evidence on the effect of sex on cardiac dimensions in adults,25–27 whereas in paediatrics, Cantinotti et al. reported findings similar to ours.1,11,12 It is possible that sex becomes relevant with increasing age,28 which would explain the discrepancies found between the results in paediatric and adult studies.
Lastly, the inter-rater and intrarater reliability analysis yielded a high ICC (0.89–0.98), which supports the reproducibility of the study.
- 7
We compared the obtained z-score curves with those published in the literature.
Our results exhibited a high degree of agreement with those published by Koestenberger13 and Cantinotti12 for the mid-cavity and longitudinal diameters indexed by BSA, but not for the basal diameter. Upon noticing this discrepancy, we compared these two sources with each other, and once again found a good correlation between the mid-cavity and longitudinal diameters and disagreement in the basal diameters. It may be worth considering whether age could be the optimal parameter to normalise the basal diameter (or a different parameter other than the BSA) or that there may be factors associated with the measurement of this diameter that interfere with the estimation of its dimension, such as the variability in the basal diameter associated with the apical 4-chamber view. On the other hand, the disagreement found in z-score distributions supports the development of local standards.
ConclusionsBy obtaining a representative sample and applying robust statistical methods and a standardised imaging protocol, we were able to develop accurate and reliable ventricular diameter z-score curves.
We have established reference values, which are scarce in the current literature, to allow accuracy and precision in the echocardiographic measurement of the RV, which is extremely useful in clinical practice.
Conflicts of interestThe authors have no conflicts of interest to declare.
I thank every author involved in this publication. Without their help and guidance, my dissertation and this project would not have been possible.
Please cite this article as: Álvarez LG-C, et al. Valores de referencia (Z-score) de diámetros de porcion de entrada y trabecular del ventrículo derecho: primera descripción en población pediátrica española sana. An Pediatr (Barc). 2020;92:147–155.