
Paediatric malnutrition during hospital admission is a prevalent comorbidity, which is estimated around 31.4% in our environment, and could influence the clinical outcomes of paediatric patients.
ObjectiveThe aim of this study was to describe the malnutrition risk in hospitalised children using STAMP (Screening Tool for the Assessment of Malnutrition in Paediatrics), and to study its relationship with clinical outcomes.
MethodsA single-centre, analytical and prospective study was conducted on children aged 1 month to 15 years hospitalised in a tertiary hospital between October and December 2017. An analysis was made of the clinical data and anthropometric measurements (weight, height, Waterlow weight classification). Patients were classified according to STAMP, which is a validated screening tool used to classify the risk of paediatric malnutrition during hospital admission. Multivariate statistical analysis was used to identify predictive variables of illness severity.
ResultsAn analysis was made on a total of 200 patients (55% male), with a median age of 15.8 months (IQR 2.5–42.8), and a median length of stay of 3 days (IQR 1–18 days). Almost half (48.3%) of them had high risk of malnutrition at admission (STAMP ≥4), and 48.2% showed medium risk (STAMP 2–3). A higher STAMP score was associated with longer length of hospital stay (P<.01) and greater severity (P<.01). Multivariable analysis showed that STAMP could be a predictor of illness severity (OR 1.48, 95% CI: 1.18–1.86, P<.01).
ConclusionsNearly 50% of hospitalised children have a high risk of malnutrition at admission according to the STAMP screening tool. Risk of malnutrition at admission measured according to STAMP nutritional screening was associated with a longer length of stay and greater severity of illness. It is important to evaluate the risk of malnutrition as this could be related to illness severity.
La desnutrición en el paciente pediátrico hospitalizado es una comorbilidad prevalente que puede influir en la evolución clínica y se estima en un 31,4% en nuestro medio.
ObjetivoNuestro objetivo fue describir el riesgo de desnutrición de los pacientes que ingresan en nuestro centro, mediante la herramienta Screening Tool for the Assessment of Malnutrition in Paediatrics (STAMP), así como analizar su asociación con la evolución del ingreso hospitalario.
MétodosSe realizó un estudio prospectivo, unicéntrico y analítico desde octubre hasta diciembre de 2017 en pacientes hospitalizados, de edades entre 1 mes y 15 años. Se recogieron variables clínicas y datos antropométricos (peso, talla, peso según Waterlow al ingreso (T0), a las 48h (T1) y al alta (T2). Se construyeron modelos multivariantes para identificar variables predictoras de gravedad.
ResultadosAnalizamos a 200 pacientes (55% varones) con una mediana de edad de 15,8 meses (RIQ 2,5-42,8) y una estancia media de 3 días (RIQ 1-18 días). El 48,3% presentaba alto riesgo de desnutrición en T0 (STAMP ≥ 4) y un 48,2% riesgo moderado (STAMP = 2-3). En el análisis bivariante, una mayor puntuación de STAMP se asoció a mayor estancia media (p < 0,01) y a mayor gravedad (p < 0,01). En el análisis multivariante, el STAMP en T0 fue predictor de gravedad (OR 1,48; IC 95%: 1,18-1,86; p < 0,01).
ConclusionesCasi el 50% de los pacientes ingresados tenían un elevado riesgo de desnutrición durante el ingreso. El riesgo de desnutrición al ingreso medido según el cribado nutricional STAMP se asoció con una mayor estancia media y mayor gravedad. Es importante evaluar el riesgo de desnutrición al ingreso dada su influencia en la evolución de la enfermedad.
Malnutrition in hospitalised children is a significant comorbidity that influences the outcome of disease and increases health care costs.1–5 Different authors have described an increase in morbidity and mortality attributable to malnutrition, as it leads to a state of partial immunosuppression, delays wound healing, causes muscular atrophy and increases length of stay.5,16
According to the PREDyCES study, the prevalence of malnutrition in Spanish hospitals is as high as 37% in patients aged more than 70 years and is associated with an increase in health care costs of more than 12,000 € per patient.4 The prevalence of malnutrition in hospitalised children has not been clearly established; some studies have estimated that the prevalence in developed countries ranges between 12% and 24%.9-14,17,27-31 However, the DHOSPE study on malnutrition in paediatric inpatients, conducted in 2011 in 32 Spanish hospitals, found a higher prevalence of malnutrition at admission in these patients, of approximately 31.4%.19
Different circumstances may be present at the time of admission, as some children may already have a degree of it at this time, but there is also a subset of patients that develop malnutrition during their hospital stay, which means that it is not only important to detect malnutrition, but also to prevent it.
There are different tools to assess the risk of malnutrition in hospitalised children. The most widely used ones are the Screening Tool for Risk on Nutritional Status and Growth (STRONGkids) proposed by Hulst et al.6,21,22,26 and the Screening Tool for the Assessment of Malnutrition in Paediatrics (STAMP) developed by McCarthy et al.7,29 The latter is a nutritional screening tool validated in Spain in 2012 that uses anthropometric measurements, body composition and the clinical condition of the patient to determine nutritional risk at admission. It has a high sensitivity (90%) but a low specificity.24 There is no consensus on the optimal screening method or the scales that should be used to detect and establish the level of malnutrition in paediatric inpatients,20–23 but previous studies have recommended the use of these tools even in outpatients at the primary care level.25
Few studies in the paediatric population have analysed the association of malnutrition during hospitalisation with patient outcomes, and none has analysed whether the STAMP in particular could be used to predict outcomes and severity in these patients.
The main goal of our study was to use the STAMP instrument to assess the risk of malnutrition in inpatients by including a nutritional screening in the admission process, and to analyse the association between the degree of malnutrition and patient outcomes in their hospital stay.
Materials and methodsStudy design and sampling methodWe conducted a prospective longitudinal analytical single-centre study between October 1 and December 31, 2017. The setting was a tertiary care hospital with a general paediatrics ward with 38 beds that manages 1750 admissions per year.
We included patients by consecutive sampling during the period under study. We included all patients admitted to the paediatric inpatient ward aged 1 month to 15 years with a length of stay of at least 24h and for whom data on anthropometric measurements taken within the first 24h of the stay were recorded. We excluded patients in other paediatric specialities (cardiology, nephrology, oncology and haematology) and postoperative patients.
These patients underwent weight and height measurements at admission (T0), at 48h after admission (T1) and at discharge (T2). The nursing staff weighted the patients at the time of admission and in subsequent measurements in early morning, with the patient naked or lightly clothed, in the decubitus position for patients aged less than 2 years and standing in older children, using validated SECA GmbH 375® baby scales. The length of patients aged less than 2 years was obtained by measuring the distance from the top of the head to the heel with the patient lying down using an ASMEDIC® T101 stadiometer. The height of children aged more than 2 years was measured with the patient standing with the SECA 797® column scale.
Data collectionWe collected data on clinical and demographic variables for each patient, including anthropometric measurements of weight (in kg), height (in cm), body mass index (BMI) and Waterlow classification.
The Waterlow classification assesses the nutritional status of the patient based on the current weight in relation to the median weight in the reference population corresponding to the same height. Based on this expected weight-for-height percentage, the nutritional status is classified as overweight/obesity (>100%), normal (90–100%), mild undernutrition (80–90%), moderate undernutrition (70–80%) and severe undernutrition (<70%).5
We calculated the BMI as the weight divided by the height square (in kg/m2). We documented the weight, height and BMI based on the growth tables published by Carrascosa in 2010.9
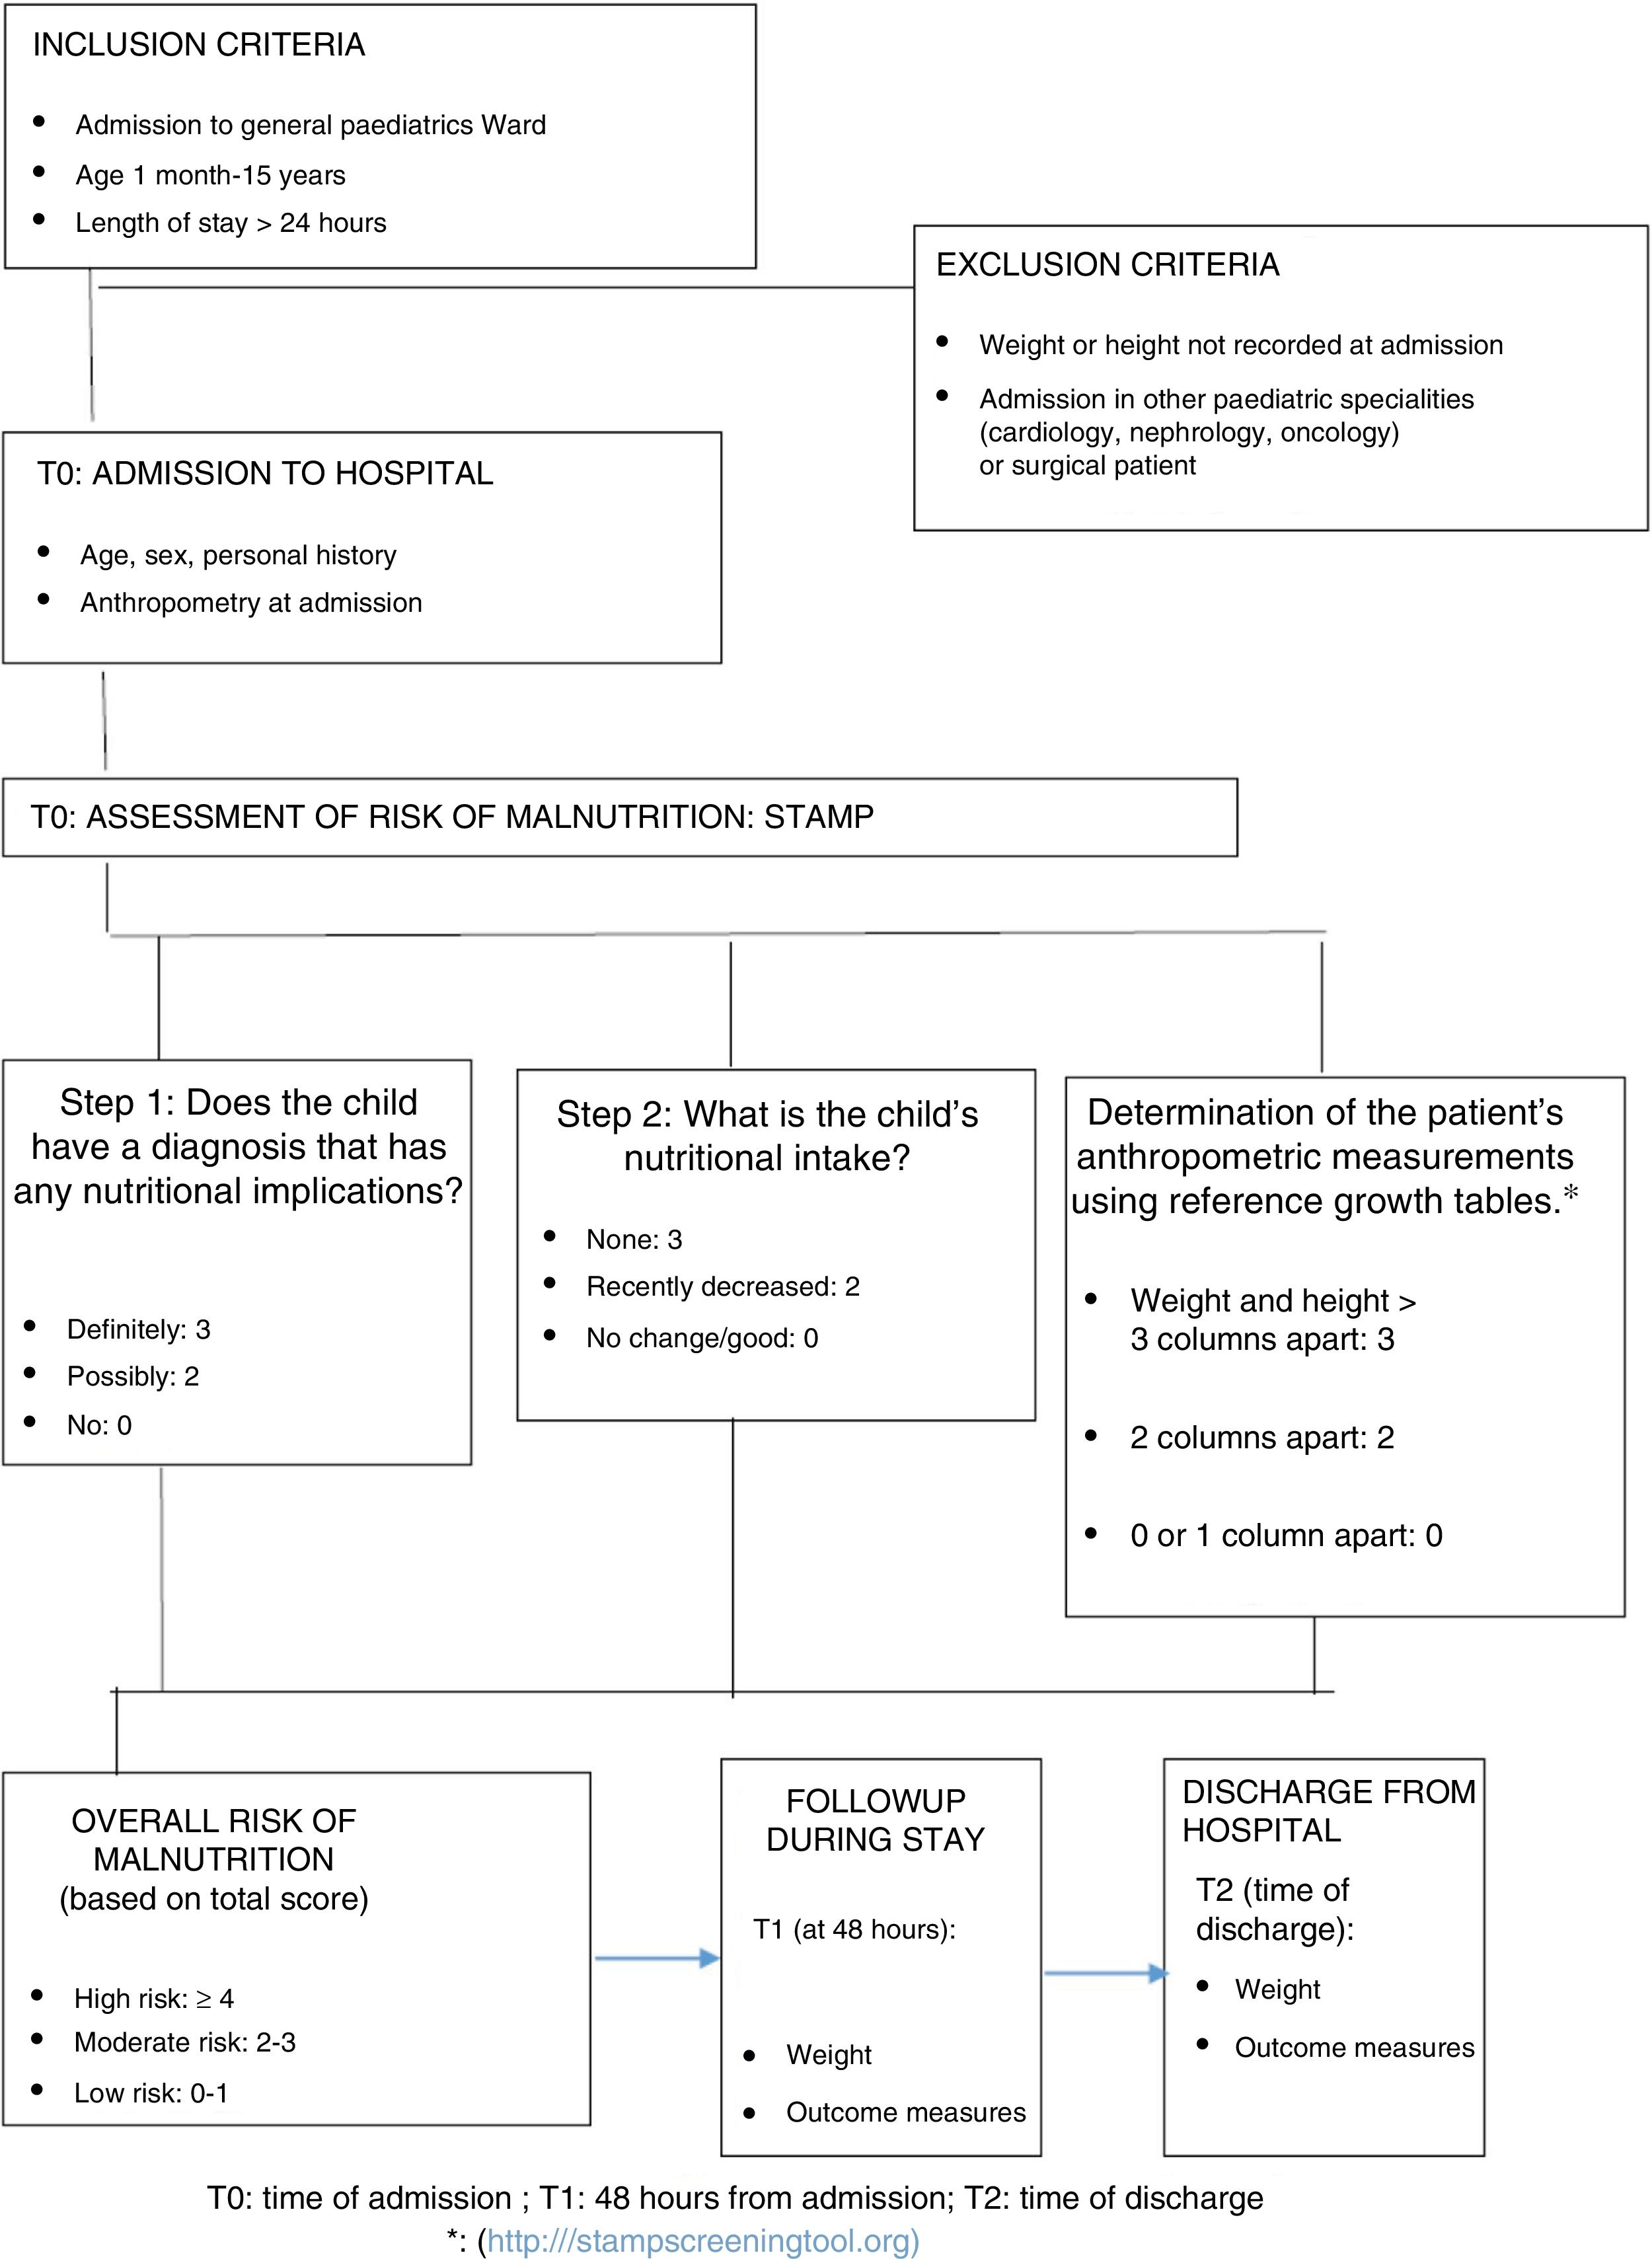
We developed a data collection form specifically for the study, where anthropometric measurements were recorded at different times: T0 (admission), T1 (48h after admission) and T2 (discharge). We also used it to collect other information, such as the nutritional intake during the hospital stay, the reason for admission or the presence of underlying diseases. We classified the severity of disease with the Wood-Downes clinical scoring system (severity ≥8) in patients with bronchiolitis and/or the Pulmonary Score in patients with asthma exacerbations (severity ≥7), both of which have been validated. For all other diseases, we considered a case severe if the patient required admission to the paediatric intensive care unit (PICU). In the subset of patients with severe respiratory illness, we differentiated between those that required high-flow oxygen therapy (HFOT) in the paediatric ward and those that required admission to the PICU (see Fig. 1).
Nutritional screening
We assessed the risk of malnutrition in the patients included in the study by means of the Spanish version of the Screening Tool for the Assessment of Malnutrition in Pediatrics (STAMP), validated for use in Spanish children aged 1 month to 18 years the same year the tool was developed.8
The STAMP (http://www.stampscreeningtool.org) allows the identification of patients at risk of malnutrition at admission and provides recommendations for intervention based on the score obtained. It consists of 3 items: diagnosis, which assesses whether the disease causing the admission has nutritional implications; the nutritional intake in the days prior to admission; and the discrepancy in the percentiles for weight and height of the patients based on the number of columns the values are apart (see Fig. 1).31 The scores in each of these items are added to obtain a total score that ranges from 0 to 9 and that establishes the risk of the patient: high (≥4 points), moderate (2–3 points) or low (0–1 points).7,8 (Fig. 1). The recommendations given by the authors are that patients at high nutritional risk be assessed by a paediatric nutritionist, who would be responsible for determining which interventions will be implemented to decrease the risk of malnutrition during hospitalisation.7,8 Patients with a moderate risk should be assessed by the paediatrician in the inpatient ward, with repeated assessment with the STAMP in the next 3 days, while patients with low risk ought to be assessed with the STAMP each week.7,8 Prior to the introduction of this nutritional screening tool, training sessions on its correct use were held to educate the entire nursing and medical staff of the paediatrics ward.
Statistical analysisWe analysed the collected data with the software SPSS version 22 (IBM SPSS Statistics; Armonk, NY, USA) and Prism version 7 (GraphPad, La Jolla, California, USA). We summarised quantitative variables as mean and standard deviation or as median and interquartile range, based on whether or not the data followed a normal distribution. We have summarised qualitative variables as percentages. To compare categorical variables, we used the chi square or Fisher exact test, and to compare continuous variables the Mann–Whitney U and Kruskal–Wallis tests. We assessed the correlation between quantitative variables with the Spearman rank correlation test. To analyse the association between the level of malnutrition and the median length of stay, we plotted Kaplan–Meier survival curves.
We performed a bivariate analysis and a multivariate analysis. Thus, to assess the factors that could have an impact on the median length of stay, we constructed a linear probability model including as covariates all variables with a statistically significant association in the bivariate analysis and clinically relevant variables such as age, sex, underlying disease, nutritional intake at admission and STAMP score at admission. Subsequently, we built a logistic regression model in which the dependent variable was severity, including as covariates age and the STAMP score at admission. We present the results of linear regression in the form of the β coefficient and t statistic, and of logistic regression as odds ratios (ORs) with their 95% confidence intervals (CIs). We assessed the goodness of fit of the model by means of the R2 or the Nagelkerke pseudo R2. We ruled out colinearity in all models. We defined statistical significance as a P-value of less than 0.05. The study was approved by the Clinical Research Ethics Committee of our hospital (CEIC file 286/17).
ResultsGeneral resultsIn the period under study (October-December 2017) a total of 568 patients were admitted to the general paediatrics ward, of who 200 met the inclusion criteria. In the final sample, 55% of patients were male, and the median age was 15.8 months (IQR, 2.5–42.8). The median length of stay was 3 days (IQR, 1–18 days). Most patients were previously healthy and only 29.5% had underlying disease, of who 7.5% had been born preterm. The most frequent diagnosis at admission was acute respiratory illness (68%), and of these patients, 10% required HFOT. The proportion of patients in this cohort that required admission to the PICU was 7.5%.
Nutritional statusIn this sample, 1.5% of patients had a Waterlow score of less than 70% at admission (severe undernutrition) and 45.5% had overweight or obesity.
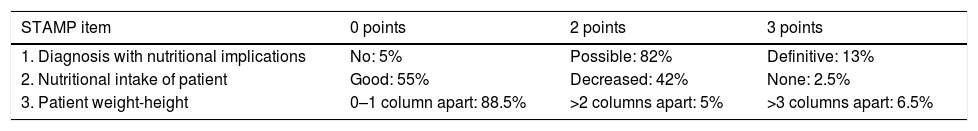
We found a high risk of malnutrition (STAMP ≥4) in 48.3% of patients, a moderate risk (STAMP=2–3) in 48.2% and a low risk (STAMP=0–1) in 3.5%. Table 1 presents the scores obtained in each of the items of the STAMP.
Scores obtained in the different items of the STAMP in the sample under study.
| STAMP item | 0 points | 2 points | 3 points |
|---|---|---|---|
| 1. Diagnosis with nutritional implications | No: 5% | Possible: 82% | Definitive: 13% |
| 2. Nutritional intake of patient | Good: 55% | Decreased: 42% | None: 2.5% |
| 3. Patient weight-height | 0–1 column apart: 88.5% | >2 columns apart: 5% | >3 columns apart: 6.5% |
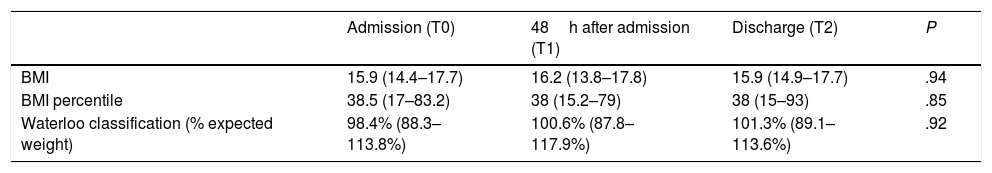
During the hospital stay, nearly 31% of the patients had a dietary intake of less than 50% their normal baseline intake by day 3 of admission, according to the nursing records, and only 2.5% received nutritional supplementation. Table 2 presents the values of the different nutritional parameters at the timepoints under study.
Nutritional parameters at different timepoints.
| Admission (T0) | 48h after admission (T1) | Discharge (T2) | P | |
|---|---|---|---|---|
| BMI | 15.9 (14.4–17.7) | 16.2 (13.8–17.8) | 15.9 (14.9–17.7) | .94 |
| BMI percentile | 38.5 (17–83.2) | 38 (15.2–79) | 38 (15–93) | .85 |
| Waterloo classification (% expected weight) | 98.4% (88.3–113.8%) | 100.6% (87.8–117.9%) | 101.3% (89.1–113.6%) | .92 |
Results expressed as median (IQR).
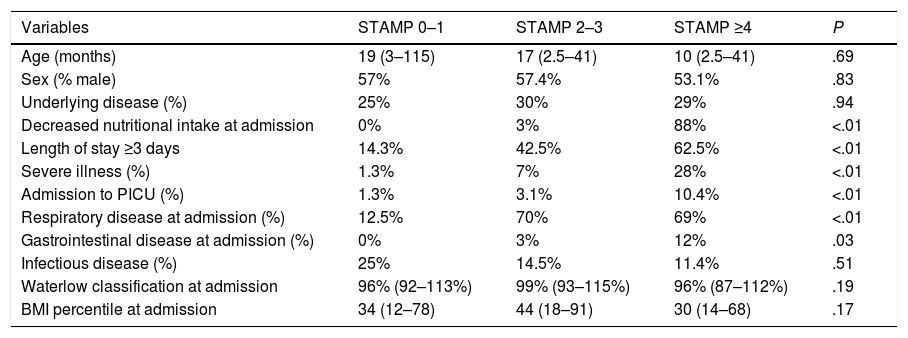
We made a comparative analysis based on the STAMP score, dividing the cohort into 3 groups: STAMP 0–1, STAMP 2–3 and STAMP ≥4 (Table 3). The 3 groups were comparable in terms of age, sex and underlying disease.
Comparative analysis based on the STAMP score at admission.
| Variables | STAMP 0–1 | STAMP 2–3 | STAMP ≥4 | P |
|---|---|---|---|---|
| Age (months) | 19 (3–115) | 17 (2.5–41) | 10 (2.5–41) | .69 |
| Sex (% male) | 57% | 57.4% | 53.1% | .83 |
| Underlying disease (%) | 25% | 30% | 29% | .94 |
| Decreased nutritional intake at admission | 0% | 3% | 88% | <.01 |
| Length of stay ≥3 days | 14.3% | 42.5% | 62.5% | <.01 |
| Severe illness (%) | 1.3% | 7% | 28% | <.01 |
| Admission to PICU (%) | 1.3% | 3.1% | 10.4% | <.01 |
| Respiratory disease at admission (%) | 12.5% | 70% | 69% | <.01 |
| Gastrointestinal disease at admission (%) | 0% | 3% | 12% | .03 |
| Infectious disease (%) | 25% | 14.5% | 11.4% | .51 |
| Waterlow classification at admission | 96% (92–113%) | 99% (93–115%) | 96% (87–112%) | .19 |
| BMI percentile at admission | 34 (12–78) | 44 (18–91) | 30 (14–68) | .17 |
BMI, body mass index; HFOT, high-flow oxygen therapy; PICU, paediatric intensive care unit; STAMP, Screening Tool for the Assessment of Malnutrition in Paediatrics.
We analysed quantitative variables with the Kruskal–Wallis test and categorical variables with the chi square or Fisher exact test. Data expressed as median and interquartile range or as percentages.
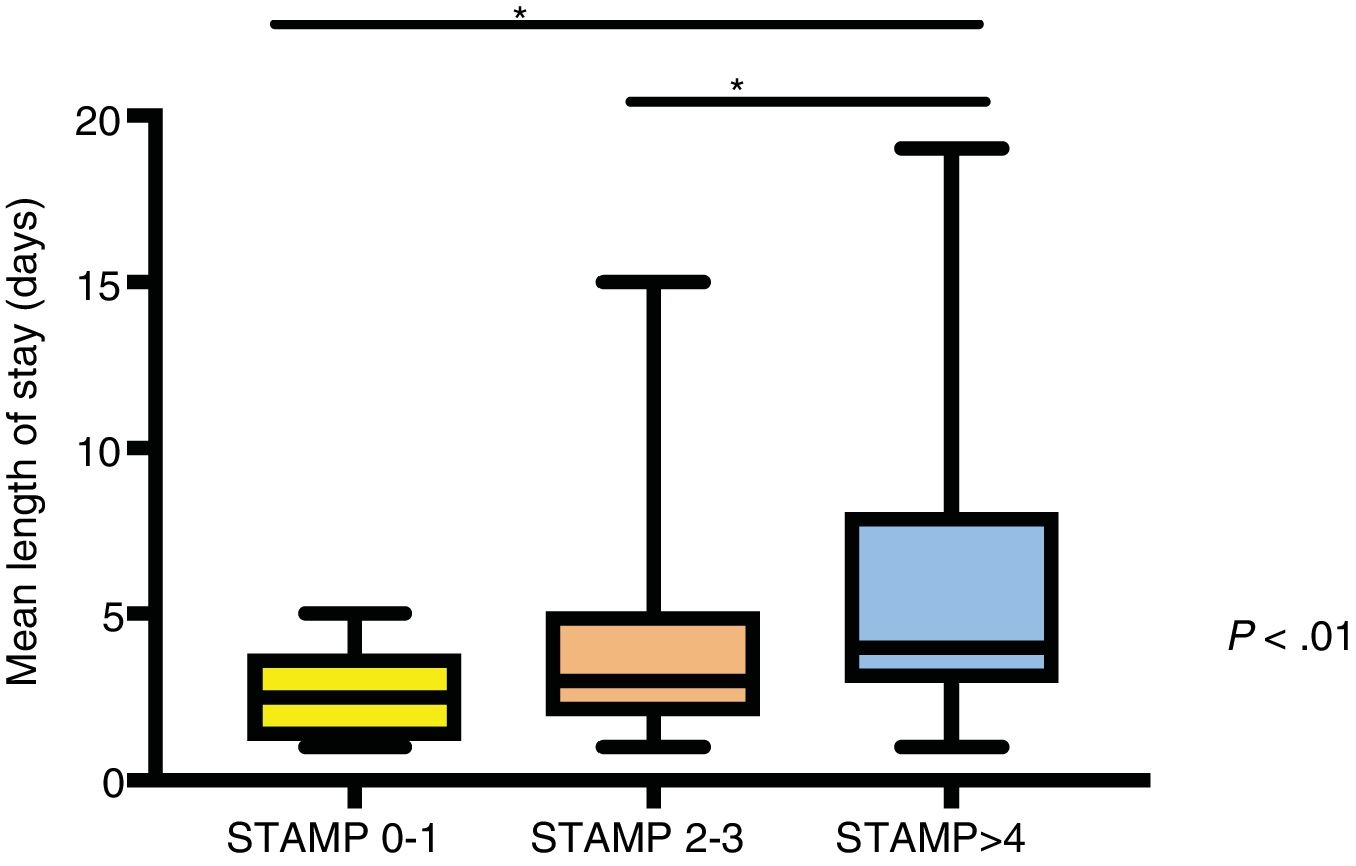
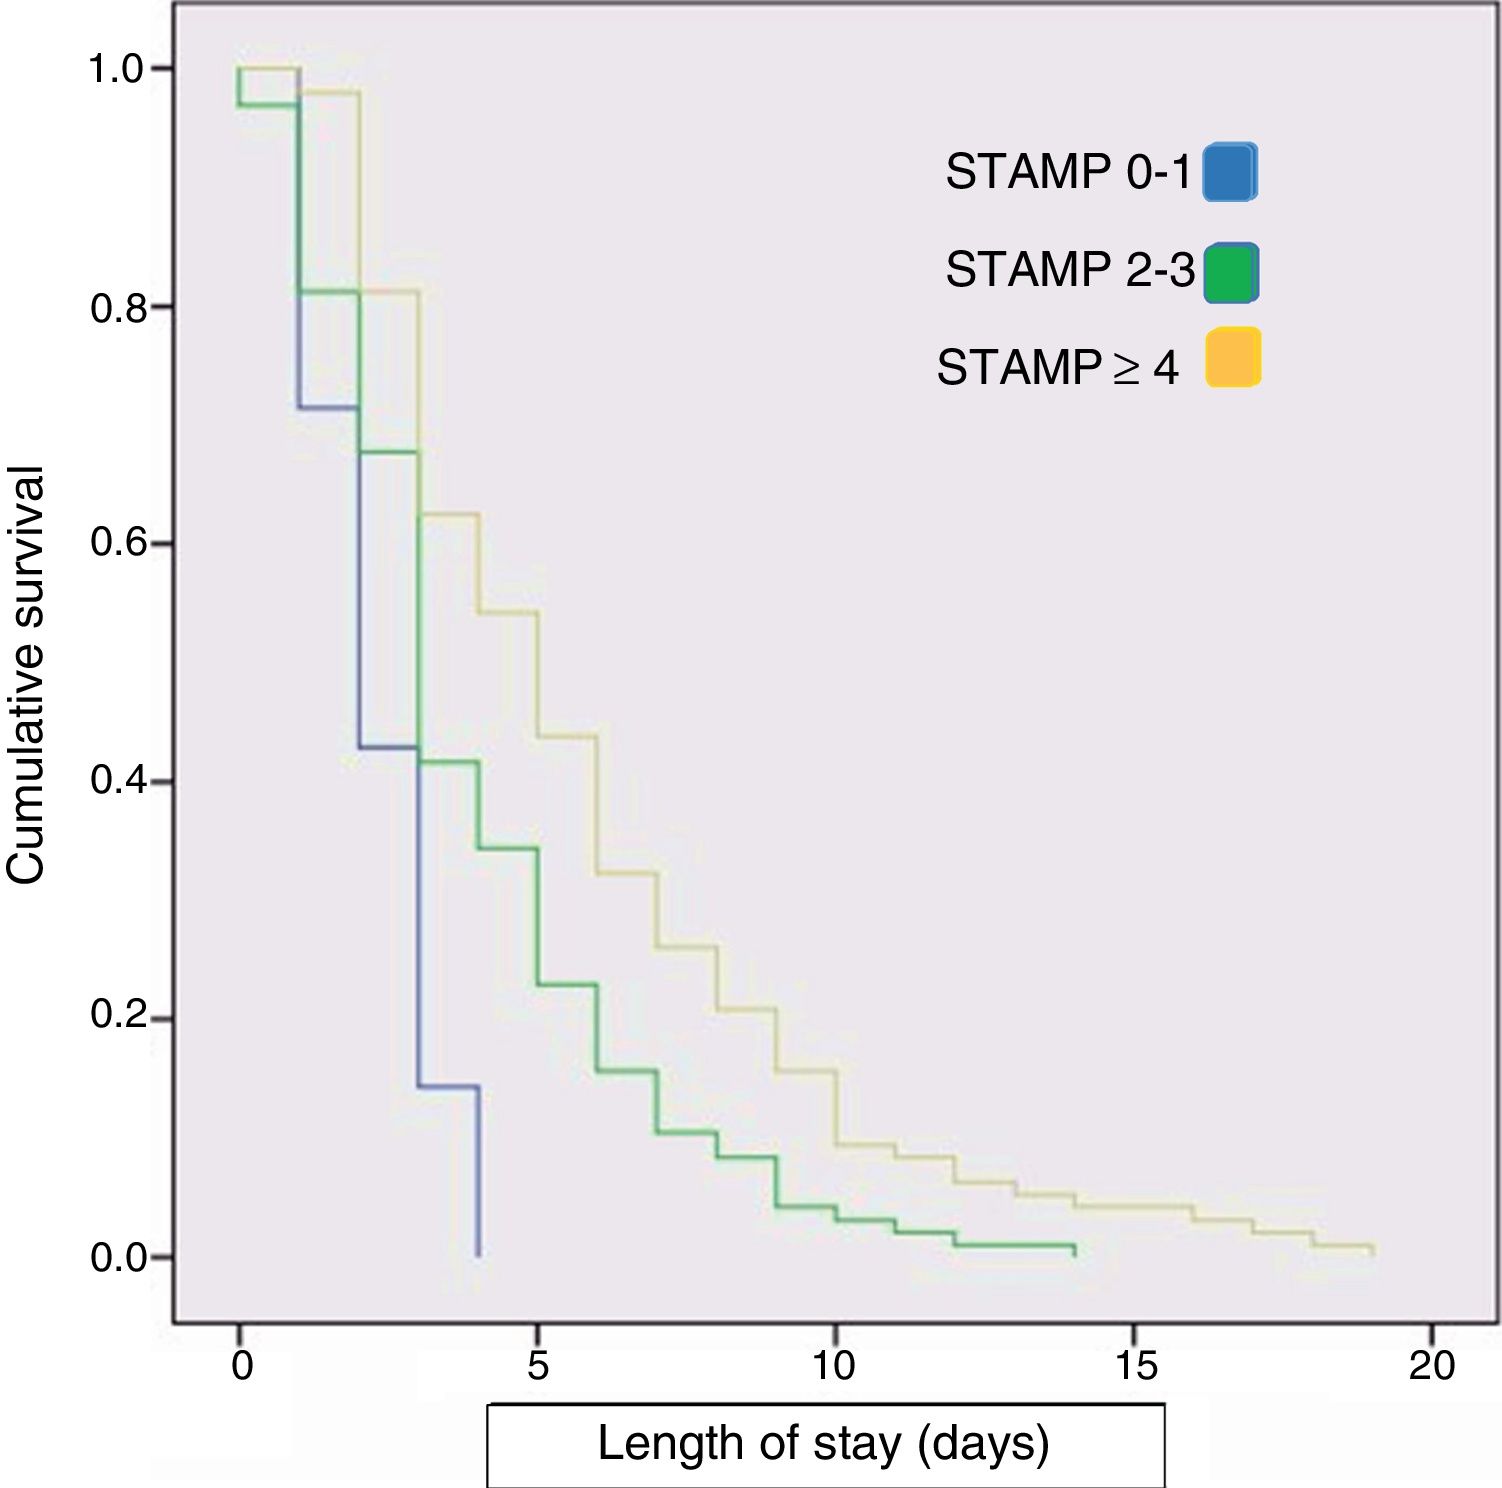
We found that patients with higher STAMP scores had longer lengths of stay (Fig. 2), required admission to the PICU more frequently and had more severe disease during their stay (P<.01). The Spearman rho coefficient for the correlation between the STAMP score and the median length of stay was 0.3 (P<.01). We calculated the Spearman correlation coefficient to assess the association between the STAMP score and the BMI (r=–0.14; P=.05) and the STAMP score and the Waterlow classification (r=–0.12; P=.08), and neither correlation was relevant or statistically significant. We also plotted a Kaplan–Meier survival curve that reflected the length of stay of each patient in relation to their STAMP score at admission. The curve revealed that the higher the STAMP score, the longer the median length of stay (Fig. 3). On the other hand, we did not find statistically significant differences in the median length of stay based on the Waterlow classification.

Comparative analysis of length of stay by risk of malnutrition at admission.
Median and interquartile range of length of stay in days of children with different scores in the STAMP at the time of admission. We used the Kruskal–Wallis test for the analysis. The asterisks mark associations with P<.01.
.")
Children with underlying disease were at higher risk of undernutrition at admission (STAMP score >2 points; 80% vs. 48.9%; P=.02).
Multivariate analysisIn the linear regression model, the median length of stay was the dependent variable, and male sex (t=2.4; P=.01), higher STAMP scores at T0 (t=3.5; P=.01) and greater severity (t=7.8; P<.0001) were the covariates associated with increases in the median length of stay.
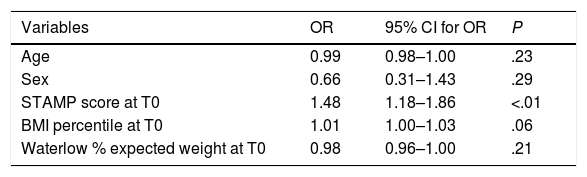
The logistic regression model had severity as the dependent variable, and it showed that a higher STAMP score at T0 (odds ratio [OR]=1.48; 95% CI, 1.18–1.86; P=.01) was the covariate most strongly associated with severity. The BMI and the Waterlow weight classification did not seem to be associated with severity (Table 4).
Covariates associated with severity in the multivariate logistic regression analysis.
| Variables | OR | 95% CI for OR | P |
|---|---|---|---|
| Age | 0.99 | 0.98–1.00 | .23 |
| Sex | 0.66 | 0.31–1.43 | .29 |
| STAMP score at T0 | 1.48 | 1.18–1.86 | <.01 |
| BMI percentile at T0 | 1.01 | 1.00–1.03 | .06 |
| Waterlow % expected weight at T0 | 0.98 | 0.96–1.00 | .21 |
BMI, body mass index; CI, confidence interval; OR, odds ratio; STAMP, Screening Tool for the Assessment of Malnutrition in Paediatrics.
We analysed the age, BMI percentile, Waterlow classification and STAMP score at admission as continuous variables, whereas sex was a categorical variable. The results presented in boldface are those that were statistically significant in the adjusted analysis. Nagelkerke R2=0.26.
The main objectives of our study were to describe the risk of malnutrition in children hospitalised in a general paediatrics ward and to analyse the association between malnutrition and patient outcomes. We found that 48% of paediatric inpatients were at high risk of malnutrition and that patients with high scores in the STAMP had longer lengths of stay and were more likely to require HFOT or admission to the PICU. Previous studies15 have also found a high proportion of patients at risk of moderate-to-severe malnutrition at admission, estimated at 70% to 75% depending on the age group.
We ought to highlight the possible subjective assessment that the health care staff could use to evaluate the impact of the existing disease and the nutritional intake of previous days (items 1 and 2 of the STAMP). Only item 3 is a more objective measure based on the discrepancy of weight and height percentiles in relation to reference values, and this was the item in which we found the lowest proportion of abnormal results. All of these factors may increase the sensitivity of the STAMP, which is an advantage considering that this tool is meant for screening purposes. This makes the health care staff be alert to the potential risk of malnutrition, even though the majority of children admitted to the ward have overweight or obesity based on the Waterlow classification.
Previous studies9 have shown that early oral nutritional supplementation is associated with a decrease in the length of stay and in health care costs, so nutritional intervention should be implemented in patients identified as being at risk of malnutrition.
Our results show that children with underlying disease are at higher risk of malnutrition based on the STAMP scores. This finding is consistent with those of previous studies1 that showed that patients with chronic disease were hat higher risk of malnutrition (91% vs. 45%), although these authors used other screening tools, such as the STRONGkids or the Paediatric Yorkhill Malnutrition Score (PYMS).
Our study is the first to assess the use of the STAMP nutritional screening in paediatrics as a predictor of the median length of stay and of the severity of disease. However, it is possible that the STAMP is strongly correlated to severity, and that it is the greater severity that actually results in increased lengths of stay, although both factors (STAMP and severity at admission) significantly contributed to the prediction of the mean length of stay in the multivariate analysis. Previous studies have found an association of nutritional status assessed by means of the BMI2,18 with the length of stay, finding an increase in the length of stay by a factor of 1.6 in children with severe undernutrition.2 In our study, we found a weak correlation of the BMI with the median length of stay, but not with clinical severity, which suggests that the STAMP score is a better measure than the BMI due to its correlation to severity and length of stay. Other studies1 that have used the STRONGkids screening tool also concluded that lengths of stay are longer in patients at increased risk of malnutrition. However, the DHOSPE study, which used the STAMP, did not assess the correlation of the scores obtained with this tool with the median length of stay or the severity of disease. Based on the findings of previous studies, blood chemistry variables, such as serum levels of proteins, electrolytes or triglycerides, are not correlated with the length of stay or with mortality.9,28
The correlation of a poorer nutritional status with a longer length of stay also implies an increase in health care expenditure in these patients. Previous economic studies on this subject have estimated that the malnutrition associated with disease in paediatric inpatients accounts for 5.6% of the total inpatient care costs, amounting to an additional expenditure of nearly 80 million euro per year.3
There is evidence that malnutrition is associated with an increased risk of infection due to the resulting immunosuppression, with longer durations of mechanical ventilation and thus with a greater severity of disease during hospitalisation. Our study confirms that the STAMP score is associated with the severity of disease during admission, which was established based on the need of high-flow oxygen therapy or of admission to PICU.
Nutritional screening should be a routine measure during hospitalisation, yet this is not always the case, as we found in our study, perhaps due to the heavy caseloads, as we conducted the study during the epidemic season of respiratory illness, which is when hospital occupancy is highest. It has been hypothesised that the use of screening tools to assess the risk of malnutrition with previous training of the staff increases awareness in health professionals of the importance of collecting anthropometric data at admission, and therefore we believe that we should continue to advocate for the implementation of these educational interventions.
LimitationsThe main limitation of the study is that it was performed in a single centre in a relatively small sample of patients. This sample may not be very representative of the total population of paediatric inpatients in our hospital, as we excluded patients receiving care in other medical specialities. Anthropometric data were only collected in 35% of the patients admitted in the period under study, so our results may not reflect the nutritional status of the entire paediatric population admitted to the hospital. Therefore, our descriptive sample statistics cannot be used to determine the actual prevalence of nutritional risk in paediatric inpatients for the purpose of comparison with previous studies. The low frequency of recording anthropometric data for admitted patients may have been a source of selection bias in our study. The lack of records of weight at different timepoints also limited our ability to assess weight gain or loss during admission. Nevertheless, our study had a prospective design and is the first to confirm the association between the STAMP screening tool score, parameters of disease severity and median length of stay.
ConclusionsThe risk of malnutrition at admission identified with the STAMP was associated with a longer length of stay and greater disease severity. Children with underlying diseases were at higher risk of malnutrition according to this screening tool. Assessing the risk of malnutrition at admission is important, as nutritional status has an impact on disease outcomes and length of stay, and nutritional interventions should be performed in patients at risk.
Declaration of Competing InterestThe authors declare that they have no knowncompeting financial interests or personalrelationships that could have appeared to influence the workreported in this paper.
Please cite this article as: Pérez Moreno J, de la Mata Navazo S, López-Herce Arteta E, Tolín Hernani M, González Martínez F, Isabel González Sánchez M, et al. Influencia del estado nutricional en la evolución clínica del niño hospitalizado. An Pediatr (Barc). 2019;91:328–335.