
Given the possible coexistence of infection by the SARS-CoV-2 with other seasonal infections, the aim is to identify differential symptoms. The role of children in intrafamily contagion and the sensitivity of reverse transcriptase polymerase chain reaction (RT-PCR) in an area with low community transmission has been studied.
Material and methodsCross-sectional observational study. Patients between 0–15 years studied by RT-PCR technique due to clinical suspicion of infection by SARS-CoV-2 virus in the months of March-May 2020. Survey on symptoms and contacts. Determination of Anti-SARS-CoV-2 antibodies at least 21 days after the RT-PCR test.
Results126 patients were included, 33 with confirmed infection and age mean 8.4 years (95% CI 6.8–10.5) higher than not infected. Fever was the most common and with greater sensitivity. The differences found were a greater frequency of anosmia (P=.029) and headache (P=.009) among children infected with a specificity of 96.7% and 81.5% respectively. There were no differences in the duration of the symptoms. 81.8% of those infected were probably infected in the nucleus 85.2% by a parent who worked outside the home. The sensitivity of RT-PCR was 70.9% and its negative predictive value 91.1%.
ConclusionsThe clinical picture is nonspecific and the symptoms more specific difficult to detect in younger children. Children had a reduced role in the intrafamily transmission. The sensitivity of RT-PCR could be related to a less contagiousness in children after one week of infection.
Ante la posible coexistencia de la infección por el virus SARS-CoV-2 con otras infecciones estacionales, se pretende identificar síntomas diferenciales. Se ha estudiado el papel de los niños en el contagio intrafamiliar y la sensibilidad de la reacción en cadena de la polimerasa con transcriptasa inversa (RT-PCR) en un área con baja transmisión comunitaria.
Material y métodosEstudio observacional transversal. Pacientes entre 0-15 años estudiados por técnica RT-PCR por sospecha clínica de infección por virus SARS-CoV-2 en los meses de marzo-mayo del 2020. Encuesta sobre síntomas y contactos. Determinación de anticuerpos anti-SARS-CoV-2 al menos 21 días después del test RT- PCR.
ResultadosSe incluyó a 126 pacientes, 33 con infección confirmada y edad media 8,4 años (IC del 95%, 6,8-10,0) superior a los no infectados. La fiebre fue el síntoma más común y con mayor sensibilidad. Las diferencias encontradas fueron una mayor frecuencia de anosmia (p=0,029) y cefalea (p=0,009) entre los niños infectados con una especificidad del 96,7 y el 81,5% respectivamente. No hubo diferencias en la duración de los síntomas.
Un 81,8% de los infectados fue probablemente contagiado en el núcleo familiar, en un 85,2% por un progenitor que trabajaba fuera del hogar. La sensibilidad de RT-PCR fue 70,9% y su valor predictivo negativo 91,1%.
ConclusionesEl cuadro clínico es inespecífico y los síntomas más específicos difíciles de detectar en niños más pequeños. Los niños tuvieron un papel reducido en la transmisión intrafamiliar. La sensibilidad de la RT-PCR podría estar relacionada con una menor contagiosidad infantil tras una semana de infección.
From the beginning of the ongoing pandemic caused by severe acute respiratory syndrome coronavirus 2 (SARS-CoV-2), the role of children as transmission vectors has been gradually redefined. Initially, children were considered important vectors, probably by extrapolating patterns observed in other viruses such as influenza virus.1 Subsequent studies have been questioning their capacity for transmission, especially for children aged less than 10 years.2–4 In the autonomous community of Galicia (Spain), population-wide lockdown measures were introduced when the rate of community transmission was low. The cumulative incidence of SARS-CoV-2 infection in the paediatric population of Galicia in March and June, during the state of alert, were lower compared to other regions.5–7 Seroprevalence surveys in our region estimated a transmission rate of 2.0% in the general population and 0.5% in children under 15 years, while in Spain overall, the rate in children aged less than 10 years is 3.0%.8,9
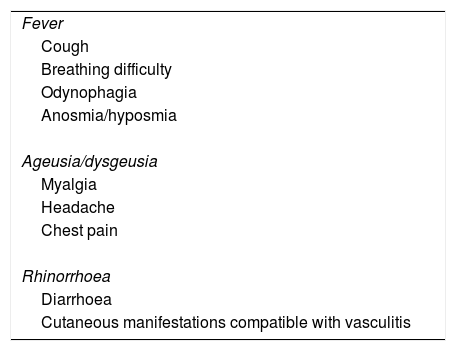
The health care system of our region established specific measures, such as separate care pathways to isolate patients or telemedicine systems for diagnosis, which contributed to reducing transmission. A screening protocol was established for the paediatric emergency setting using the reverse transcriptase polymerase chain reaction (RT-PCR) test for detection of SARS-CoV-2 in nasopharyngeal samples in any possible cases. The clinical criteria used for diagnosis were adjusted as our knowledge of the disease grew (Table 1).
Signs and symptoms that prompted performance of the RT-PCR test in the paediatric emergency department during the period under study.
| Fever |
| Cough |
| Breathing difficulty |
| Odynophagia |
| Anosmia/hyposmia |
| Ageusia/dysgeusia |
| Myalgia |
| Headache |
| Chest pain |
| Rhinorrhoea |
| Diarrhoea |
| Cutaneous manifestations compatible with vasculitis |
Anticipating the coexistence of SARS-CoV-2 infections with infections by other seasonal viruses in the autumn-winter, we conceived the study presented here with the aim of identifying the main differential clinical features of infection by SARS-CoV-2. The secondary objectives were to study potential routes of transmission in children in a region where community transmission was very low and assess the role of children in transmission within the household. Lastly, we analysed the diagnostic performance of RT-PCR, which has not been established rigorously in the paediatric population, compared to other methods.10
MethodsWe conducted a cross-sectional observational study. The parents or legal guardians of participants provided their informed consent, and we also obtained the assent of participants aged more than 12 years. The study was approved by the Research Ethics Committee of Galicia (File 2020/275).
Study universe: our catchment population includes 73000 children. We requested the participation of every paediatric patient (ages 0–15 years) that had undergone a RT-PCR test for detection of SARS-CoV-2 in a nasopharyngeal sample due to suspected infection during the period under study.
Inclusion criteria: patients aged 0 to 15 years who underwent a RT-PCR test due to clinical suspicion of SARS-CoV-2 during the period under study whose parents/legal guardians provided consent and did not meet any of the exclusion criteria.
Exclusion criteria: patients with serum immunoglobulin (Ig) deficiency. Patients that underwent the RT-PCR test when asymptomatic in the context of contact tracing.
Study period: March and May 2020, the months that followed the declaration of the state of alert and the population-wide lockdown.
Diagnostic tests: nucleic acids were extracted from nasopharyngeal samples using the STARlet handler (Microlab) and the STARMag 96×4 Universal Cartridge Kit. Nucleic acids were amplified and detected in a CFX-96 thermal cycler (Bio-Rad Laboratories, Hercules, CA, USA) using the Allplex™ 2019-nCoV assay kit (Seegene Inc, Seoul, South Korea). This assay simultaneously detects 3 target genes in the virus: the RNA-dependent RNA polymerase gene (RdRP), the nucleocapsid gene (N) and a conserved region in gene E that encodes a structural protein in the envelope of Sarbecoviruses. All patients included in the study also underwent testing for detection of anti-SARS-CoV-2 IgA and IgG antibodies3,4 weeks after the RT-PCR test. The semiquantitative detection of these antibodies was performed with the EUROIMMUN Anti-SARS-CoV-2 ELISA assay, which detects IgG and IgA antibodies using the S1 domain of the SARS-CoV-2 spike protein as antigen.
Structured interview: for every patient, we conducted an interview to explore clinical manifestations and potential routes of transmission at the time of the antibody test. The data was obtained by 2 of the researchers using a structured interview, which was conducted with the adult that accompanied the child and also included the child if the age was greater than 10 years. Questions asked specifically and individually about the presence and duration of a list of signs and symptoms that had been previously determined by the research group (Tables 2–4).
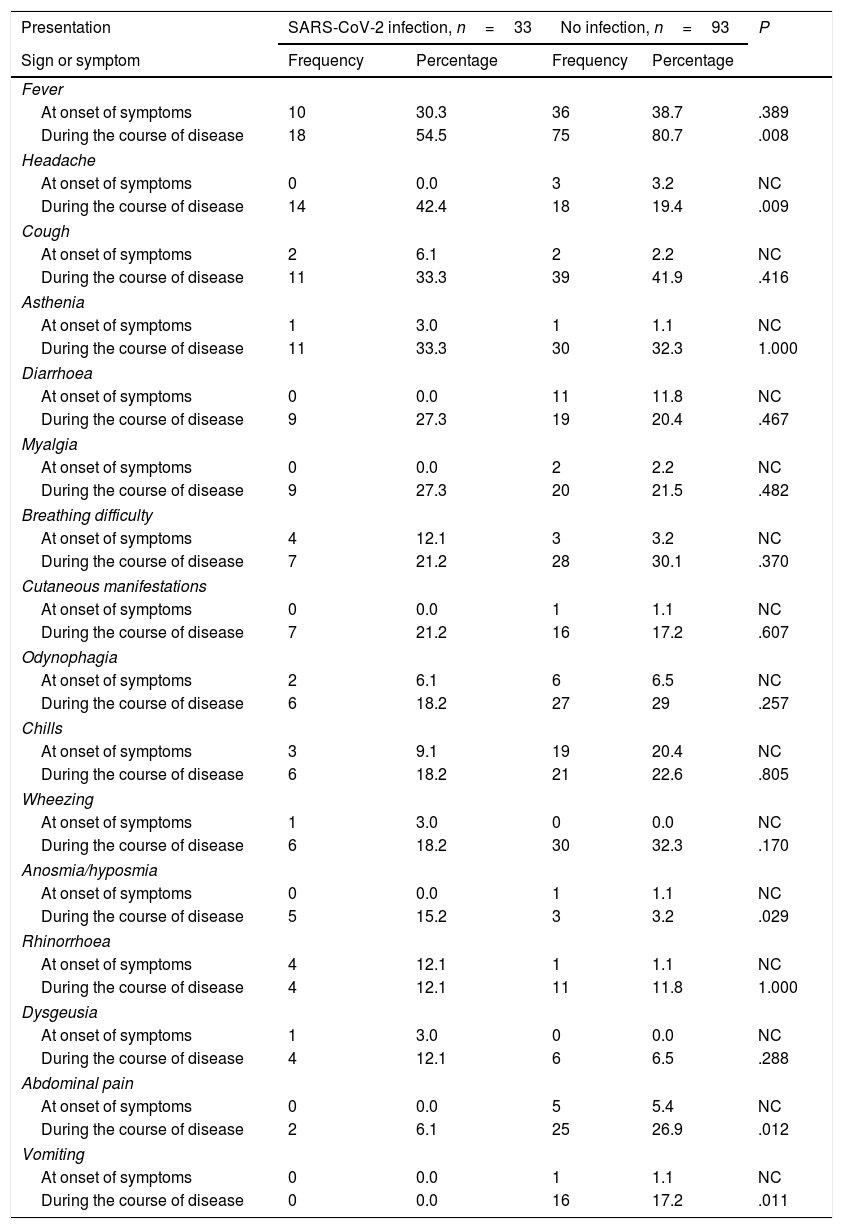
Frequency of different clinical manifestations in children with confirmed SARS-CoV-2 infection versus children with unconfirmed suspected infection.
| Presentation | SARS-CoV-2 infection, n=33 | No infection, n=93 | P | ||
|---|---|---|---|---|---|
| Sign or symptom | Frequency | Percentage | Frequency | Percentage | |
| Fever | |||||
| At onset of symptoms | 10 | 30.3 | 36 | 38.7 | .389 |
| During the course of disease | 18 | 54.5 | 75 | 80.7 | .008 |
| Headache | |||||
| At onset of symptoms | 0 | 0.0 | 3 | 3.2 | NC |
| During the course of disease | 14 | 42.4 | 18 | 19.4 | .009 |
| Cough | |||||
| At onset of symptoms | 2 | 6.1 | 2 | 2.2 | NC |
| During the course of disease | 11 | 33.3 | 39 | 41.9 | .416 |
| Asthenia | |||||
| At onset of symptoms | 1 | 3.0 | 1 | 1.1 | NC |
| During the course of disease | 11 | 33.3 | 30 | 32.3 | 1.000 |
| Diarrhoea | |||||
| At onset of symptoms | 0 | 0.0 | 11 | 11.8 | NC |
| During the course of disease | 9 | 27.3 | 19 | 20.4 | .467 |
| Myalgia | |||||
| At onset of symptoms | 0 | 0.0 | 2 | 2.2 | NC |
| During the course of disease | 9 | 27.3 | 20 | 21.5 | .482 |
| Breathing difficulty | |||||
| At onset of symptoms | 4 | 12.1 | 3 | 3.2 | NC |
| During the course of disease | 7 | 21.2 | 28 | 30.1 | .370 |
| Cutaneous manifestations | |||||
| At onset of symptoms | 0 | 0.0 | 1 | 1.1 | NC |
| During the course of disease | 7 | 21.2 | 16 | 17.2 | .607 |
| Odynophagia | |||||
| At onset of symptoms | 2 | 6.1 | 6 | 6.5 | NC |
| During the course of disease | 6 | 18.2 | 27 | 29 | .257 |
| Chills | |||||
| At onset of symptoms | 3 | 9.1 | 19 | 20.4 | NC |
| During the course of disease | 6 | 18.2 | 21 | 22.6 | .805 |
| Wheezing | |||||
| At onset of symptoms | 1 | 3.0 | 0 | 0.0 | NC |
| During the course of disease | 6 | 18.2 | 30 | 32.3 | .170 |
| Anosmia/hyposmia | |||||
| At onset of symptoms | 0 | 0.0 | 1 | 1.1 | NC |
| During the course of disease | 5 | 15.2 | 3 | 3.2 | .029 |
| Rhinorrhoea | |||||
| At onset of symptoms | 4 | 12.1 | 1 | 1.1 | NC |
| During the course of disease | 4 | 12.1 | 11 | 11.8 | 1.000 |
| Dysgeusia | |||||
| At onset of symptoms | 1 | 3.0 | 0 | 0.0 | NC |
| During the course of disease | 4 | 12.1 | 6 | 6.5 | .288 |
| Abdominal pain | |||||
| At onset of symptoms | 0 | 0.0 | 5 | 5.4 | NC |
| During the course of disease | 2 | 6.1 | 25 | 26.9 | .012 |
| Vomiting | |||||
| At onset of symptoms | 0 | 0.0 | 1 | 1.1 | NC |
| During the course of disease | 0 | 0.0 | 16 | 17.2 | .011 |
Ordered by frequency in children with SARS-CoV-2 infection.
NC: not calculated due to the sample size.
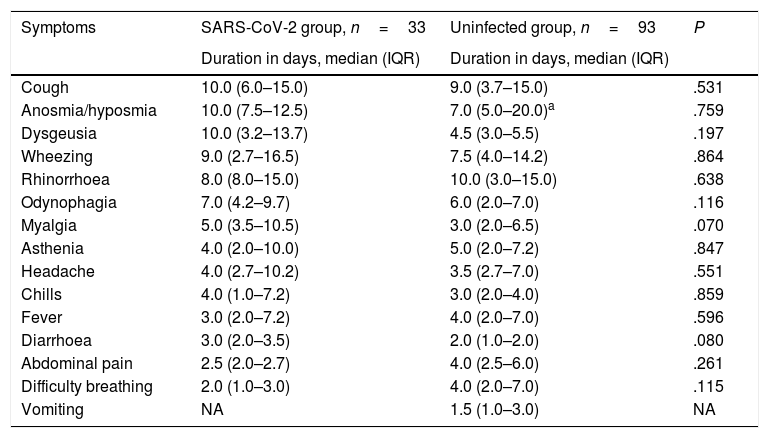
Duration in days of the different clinical manifestations, comparison of children with confirmed infection by SARS-CoV-2 and children in who the infection had been suspected but not confirmed.
| Symptoms | SARS-CoV-2 group, n=33 | Uninfected group, n=93 | P |
|---|---|---|---|
| Duration in days, median (IQR) | Duration in days, median (IQR) | ||
| Cough | 10.0 (6.0–15.0) | 9.0 (3.7–15.0) | .531 |
| Anosmia/hyposmia | 10.0 (7.5–12.5) | 7.0 (5.0–20.0)a | .759 |
| Dysgeusia | 10.0 (3.2–13.7) | 4.5 (3.0–5.5) | .197 |
| Wheezing | 9.0 (2.7–16.5) | 7.5 (4.0–14.2) | .864 |
| Rhinorrhoea | 8.0 (8.0–15.0) | 10.0 (3.0–15.0) | .638 |
| Odynophagia | 7.0 (4.2–9.7) | 6.0 (2.0–7.0) | .116 |
| Myalgia | 5.0 (3.5–10.5) | 3.0 (2.0–6.5) | .070 |
| Asthenia | 4.0 (2.0–10.0) | 5.0 (2.0–7.2) | .847 |
| Headache | 4.0 (2.7–10.2) | 3.5 (2.7–7.0) | .551 |
| Chills | 4.0 (1.0–7.2) | 3.0 (2.0–4.0) | .859 |
| Fever | 3.0 (2.0–7.2) | 4.0 (2.0–7.0) | .596 |
| Diarrhoea | 3.0 (2.0–3.5) | 2.0 (1.0–2.0) | .080 |
| Abdominal pain | 2.5 (2.0–2.7) | 4.0 (2.5–6.0) | .261 |
| Difficulty breathing | 2.0 (1.0–3.0) | 4.0 (2.0–7.0) | .115 |
| Vomiting | NA | 1.5 (1.0–3.0) | NA |
Ordered by decreasing duration.
IQR, interquartile range; NA, not applicable.
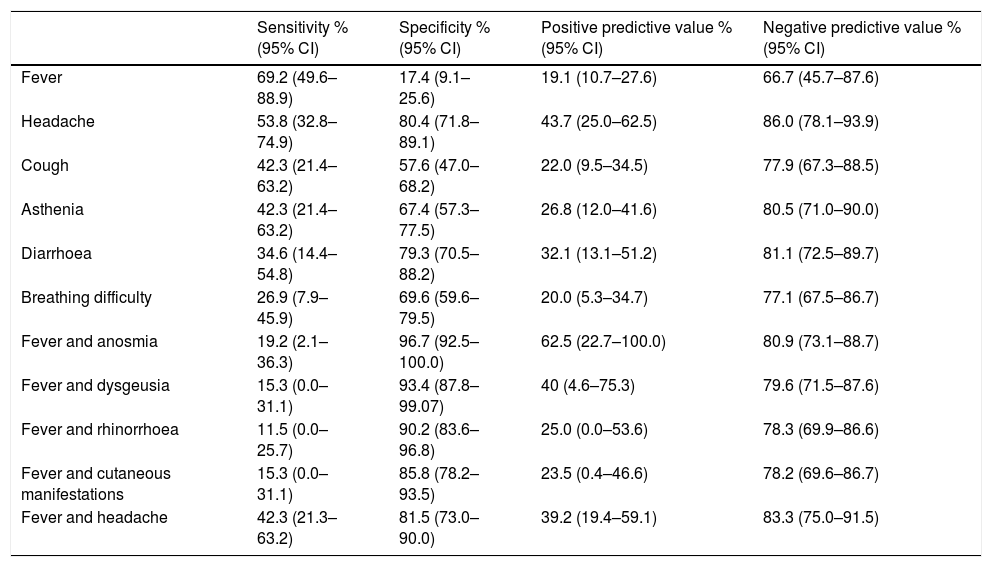
Diagnostic performance of the most frequent symptoms and symptom combinations expressed as sensitivity, specificity and predictive values.
| Sensitivity % (95% CI) | Specificity % (95% CI) | Positive predictive value % (95% CI) | Negative predictive value % (95% CI) | |
|---|---|---|---|---|
| Fever | 69.2 (49.6–88.9) | 17.4 (9.1–25.6) | 19.1 (10.7–27.6) | 66.7 (45.7–87.6) |
| Headache | 53.8 (32.8–74.9) | 80.4 (71.8–89.1) | 43.7 (25.0–62.5) | 86.0 (78.1–93.9) |
| Cough | 42.3 (21.4–63.2) | 57.6 (47.0–68.2) | 22.0 (9.5–34.5) | 77.9 (67.3–88.5) |
| Asthenia | 42.3 (21.4–63.2) | 67.4 (57.3–77.5) | 26.8 (12.0–41.6) | 80.5 (71.0–90.0) |
| Diarrhoea | 34.6 (14.4–54.8) | 79.3 (70.5–88.2) | 32.1 (13.1–51.2) | 81.1 (72.5–89.7) |
| Breathing difficulty | 26.9 (7.9–45.9) | 69.6 (59.6–79.5) | 20.0 (5.3–34.7) | 77.1 (67.5–86.7) |
| Fever and anosmia | 19.2 (2.1–36.3) | 96.7 (92.5–100.0) | 62.5 (22.7–100.0) | 80.9 (73.1–88.7) |
| Fever and dysgeusia | 15.3 (0.0–31.1) | 93.4 (87.8–99.07) | 40 (4.6–75.3) | 79.6 (71.5–87.6) |
| Fever and rhinorrhoea | 11.5 (0.0–25.7) | 90.2 (83.6–96.8) | 25.0 (0.0–53.6) | 78.3 (69.9–86.6) |
| Fever and cutaneous manifestations | 15.3 (0.0–31.1) | 85.8 (78.2–93.5) | 23.5 (0.4–46.6) | 78.2 (69.6–86.7) |
| Fever and headache | 42.3 (21.3–63.2) | 81.5 (73.0–90.0) | 39.2 (19.4–59.1) | 83.3 (75.0–91.5) |
Study variables: the clinical variables under study were age, sex, date of onset, manifestations at onset, other signs and symptoms developed at any point in the course of disease and the duration of each, photographic evidence of cutaneous manifestations (urticaria, perniosis, exanthema). Date of contact with individual(s) infected by SARS-CoV-2 and description of contact, number of affected relatives and their relationship to the patient, number of cases of infection in the family, sequence of transmission in the family and number of household members.
Statistical analysis: in the descriptive analysis, we summarised qualitative data as absolute frequencies and percentages and quantitative data as median and interquartile range (IQR) or mean and 95% confidence interval (CI). We analysed the sensitivity, specificity, predictive positive value and predictive negative value of the RT-PCR test using the anti-SARS-CoV-2 IgG test as reference. We classified patients in 2 groups, those with a positive result in any of the tests (infected group) and those with negative results in both (uninfected group). Then, we compared the different variables under study in these groups. To compare 2 qualitative variables, we used the chi square test. If one of the variables was quantitative, we assessed the normality of the distribution using the Shapiro Wilk test, and we made comparisons with the Mann–Whitney U test because none of the variables followed a normal distribution in the groups under study. To compare 2 quantitative variables, we used the Spearman correlation coefficient. Last of all, we assessed the diagnostic performance of clinical features by calculating the sensitivity, specificity, positive predictive value and negative predictive value. For all tests, we defined statistical significance as a 2-tailed P-value of .05. The statistical analysis of the data was performed with the software SPSS (IBM) version 19 and EPIDAT 3.1 (Government of Galicia).
ResultsThe study included 126 patients, 33 in the infected group and 93 in the uninfected group. Based on this finding, children under 15 years accounted for 2.2% of cases of SARS-CoV-2 infection in our region in the period under study, out of a total of 1650 diagnosed infections.
The cumulative incidence of confirmed infection in this age subset in our catchment population was 0.04%. We did not find significant differences between the 2 groups in the sex distribution (male sex, 66.7% vs. 59.1%; P=.535), although we did find differences in age (P=.035).
The mean age was greater in children with confirmed infection (8.4 years; 95% CI, 6.8–10.0) compared to children without infection (6.5 years; 95% CI, 5.7–7.4). Tables 2 and 3 show the frequency of the symptoms at onset and throughout the course of disease as well as their duration for each group.
The most frequent clinical manifestation at onset was fever in both groups, without significant differences in its frequency. In the infected group, the most frequent symptoms following fever were breathing difficulty and rhinorrhoea. In the uninfected group, they were chills and diarrhoea. None of the patients in the infected group reported diarrhoea as an initial symptom, and none in the uninfected group reported dysgeusia or anosmia as initial symptoms.
During the course of disease, fever continued to be the most frequent symptom, and was significantly more frequent in the uninfected group (P=.008) and in male patients (P=.039), followed in frequency by cough. We did not find significant differences between groups in the frequency of dyspnoea or constitutional symptoms, such as asthenia or myalgia, associated with SARS-CoV-2, or of cutaneous manifestations, found in 21.2% of cases.
The only differences we found between groups were a higher frequency of headache (P=.009) and anosmia (P=.029) in infected children, and, when it came to the uninfected group, a higher frequency of fever (P=.008), vomiting (P=.011) and abdominal pain (P=.012). We found no differences in the duration of any of the symptoms (Table 3). The median duration of fever was 3 days in the infected group (IQR, 2.0–7.2) and 4 days in the uninfected group (IQR, 2.0–7.0).
Only one female patient in the infected group, aged 14 years, required hospital admission due to bilateral pneumonia of moderate severity that did not require intensive care. Table 4 summarises the diagnostic performance of the most frequent symptoms, such as fever, headache, cough, asthenia, diarrhoea and breathing difficulty in symptomatic children. The analysis of all the symptoms found that the most sensitive one was fever (69.23%), while the most specific symptoms were anosmia (96.7%), dysgeusia (93.4%), rhinorrhoea (88.0%), cutaneous manifestations (82.6%) and headache (80.4%). The association with fever increased the specificity of all symptoms save for anosmia and dysgeusia, in which the already high specificity values remained unchanged (Table 4).
As for the source of transmission, 19.4% of uninfected patients reported having had close contact with an infected individual and yet showed no evidence of infection, with the frequency differing significantly compared to infected patients, as 66.7% of this group had close contacts with a positive RT-PCR test (P<.001). In the infected group, 81.8% had relatives with symptoms, compared to 9.7% of the uninfected group (P<.001).
The mean number of affected relatives 3.8 (95% CI, 3.4–4.2) in the infected group compared to 2.6 (95% CI, 0.9–4.4) in the uninfected group (P=.026). However, we did not find differences in the number of relatives that required hospital admission, and the percentage was low in both groups.
Only 6 of the 33 children in the infected group did not have any infected relatives, so it is reasonable to assume that they got the infection outside the household. We were unable to identify the source of the infection in 3 of them. One of the patients in who the source was identified was the patient that had the most severe disease in the case series, who did not transmit the infection to any member of her household
The most likely source of transmission in this patient was a teacher in her school that had the infection and was in close contact with the patient in the days that preceded the onset, as occurred in another 2 patients in the infected group that had contact with a different teacher and with an adolescent classmate, respectively.
The frequency of SARS-CoV-2 infection in a parent was significantly greater in the infected group (P<.001). In the uninfected group, 3 children whose mother had the infection did not get infected, nor did 1 boy whose father had the infection. There were no differences in the frequency of infection in other adults in the household. In 19 cases in the infected group (57.6%), SARS-CoV-2 infection was also detected in other children in the family (siblings), before or after the patient, but in every case it was detected after the onset of symptoms in adults, with a frequency that was significantly different compared to the uninfected group (P<.001). The mean number of members in the household in the infected group was 4.6.
When we analysed the index case in the household, we only found 1 case in which the patient appeared to be the index case, a female patient aged 13 years presumably infected at school that only transmitted the infection to the mother. In 85.2% of the patients infected in the family environment, the index case was one of the parents, followed in frequency by other relatives (7.4%) and a grandparent (3.7%). We assess the impact of parental employment outside the home on transmission. We found differences, with a higher percentage of infected mothers (100%) (P=.022) and infected fathers (81.3%) (P=.002) among those that worked outside the home, even if it was not in direct contact with the public.
We attempted to determine the latency period in infected patients with a well-established history of contact with an infected individual, and found a median of 11.5 days (IQR, 3.7–18.2).
In cases of transmission within the family, the median time elapsed between the onset in the index case in the family and the onset in the child was 14 days (IQR, 6.0–26.0).
In most infected patients (87.9%), the onset of symptoms in adults preceded the onset in the child, and in 3 cases the onset was simultaneous. In a single case, the onset of symptoms occurred in the child before the adult.
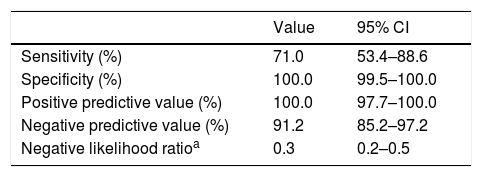
Lastly, we assessed the diagnostic yield of RT-PCR methods. While 22 patients had positive RT-PCR and IgG antibody results, 11 had a positive IgG antibody result and a negative PCR result and none had a positive PCR test followed by a negative IgG test. Table 5 presents the sensitivity, specificity and predictive value data. The median time elapsed from the onset of symptoms to performance of the RT-PCR test was 8 days (IQR, 3.8–23.0), and the median time elapsed to the first antibody test was 51 days (IQR, 32.0–6.0). All children that had a negative IgG result with a positive IgA result were scheduled for a second test 3 to 4 weeks later. Three of them refused the test and in the rest the IgG titre remained in the negative range, which ruled out infection by SARS-CoV-2.
Sensitivity, specificity, positive predictive value and negative predictive value of the RT-PCR test.
| Value | 95% CI | |
|---|---|---|
| Sensitivity (%) | 71.0 | 53.4–88.6 |
| Specificity (%) | 100.0 | 99.5–100.0 |
| Positive predictive value (%) | 100.0 | 97.7–100.0 |
| Negative predictive value (%) | 91.2 | 85.2–97.2 |
| Negative likelihood ratioa | 0.3 | 0.2–0.5 |
The main findings of the study are the strong similarities of the clinical presentation of children infected by SARS-CoV-2 compared to children that did not have the virus. It is also worth mentioning the limitations of the diagnostic methods used in the study.
The clinical manifestations were quite nonspecific and did not allow us to clearly distinguish what symptoms or duration of symptoms may be associated with infection by SARS-CoV-2.
A systematic review on the usefulness of different signs and symptoms for predicting the presence of SARS-CoV-2 infection was recently published10 that only included adult patients, as no data have been published to date on the sensitivity and specificity of clinical manifestations in children, on which our study focused. One third of patients with SARS-CoV-2 had onset with fever, with no differences in comparison with children without the infection.
The symptoms that were most specific for SARS-CoV-2 infection, such as headache or changes in smell, as was the case in adults,10,11 are difficult to detect in young children. These symptoms were more frequent in the infected group, especially in patients aged more than 10 years, and their presence could increase suspicion.
In general, gastrointestinal manifestations12–14 have been more frequent in patients without SARS-CoV-2 infection, although the specificity of diarrhoea for prediction of the infection was 79.3%. And while we found no difference between groups in the frequency of cutaneous manifestations, their presence corresponded to a high specificity, which increased if associated with fever.15,16
It is important to consider that the cumulative incidence of infection by SARS-CoV-2 during the lockdown period in children aged less than 15 years in our region was lower compared to the paediatric case series in other countries or other regions of Spain.5–7,10 Our cumulative incidence values are lower compared to population-based serological surveys in our region,8,9 which suggests a high frequency of asymptomatic cases in the paediatric population. The greater age of patients in the infected group compared to the uninfected group corroborates the findings of other population-based studies in which the cumulative incidence was lower in children aged less than 10 years.2–4 Whether it is the frequency of infection or the yield of the diagnostic techniques used to measure the viral load in nasopharyngeal samples that is lower in this age group remains to be determined.17,18
As for the source of transmission, in our study household transmission was most frequent, as expected given the limitation of interpersonal contact imposed by the lockdown mandate.19 Adults were the source of household spread in nearly every case in the infected group, with the onset of symptoms in adults preceding the onset in children by 2 weeks. Parents were the main vectors of household transmission, even when other relatives, such as the grandparents, lived in the household. We found a significant association with parental employment outside the home. We ought to highlight that children that got infected outside the home rarely transmitted the infection to their relatives, with only 1 such case in our study (3.0%), which supports the hypothesis that children are less contagious. A recent study conducted in Switzerland, which did not impose a lockdown,20 found that the index case was a child in only 8% of households, and other studies have reported similar figures.21 Other reviews did not identify any cases of child-to-adult transmission in the household.22
The households in our study were small, so that contact with infected individuals outside the established preventive measures was infrequent and the viral inoculum was probably lesser. Different studies have analysed the association between exposure to a greater inoculum and greater severity of disease. Guallar et al. analysed 3 small clusters of infection in Madrid.23 Social distancing measures had not been used in 2 of the clusters and had been used in 1, and the severity of disease was milder in the latter. Other authors have hypothesised that a smaller inoculum due to social distancing measures could explain why the virus appears to be less virulent compared to the beginning of the pandemic.
The association between the viral inoculum and the severity of disease has already been established in other infections, such as influenza, infection by respiratory syncytial virus or SARS.24,25 Our findings seem to support this association, given the low severity of disease in infected patients and their families compared to other series, although this interpretation must be made with caution, as we did not analyse the age of household members or the presence of comorbidities that may have played a role in the decreased severity observed in our study.26–28 Some studies have found an association of higher viral loads with disease severity and the development of antibodies.12,29,30
Community transmission was rare in our series, considering the population-wide lockdown that was in place during the study period. The role of the paediatric population in community transmission is unclear. Danis et al. described a cluster in the French Alps before the generalised closure of schools in which 1 child that had the infection did not transmit it to any of the 112 contacts considered high-risk.31 Other studies and the experience in several European countries after the reopening of schools in May seem to suggest that the transmission rate in the school setting is low.32,33
As for the RT-PCR test, the results were positive in 1 out of 5 tested children (17.0%). This low positivity rate could be due to the number of tests performed, given the coexistence in time with other infections, especially in the first month of the study. However, it must be taken into account that some of the patients with negative results turned out to have been infected based on the findings of the antibody test, resulting in a relatively low sensitivity (70.9%) and negative predictive value (91.1%) for RT-PCR in this age group. These values may have been affected by errors in sample collection or the number of days elapsed from the onset of symptoms at the time of testing, as the median was 8 days, when the viral load could have started to decrease.34
The period in which the probability of contagion is highest ranges from 2 days before onset to 7 days from onset, as the viral load peaks. Another aspect to consider is that children aged less than 10 years may shed less virus from the respiratory tract, which may be associated with the lower likelihood of them transmitting the disease, especially after 1 week from infection. However, there is no clear evidence that individuals with lower viral loads are less likely to transmit the infection or that asymptomatic paediatric patients have lower viral loads compared to adults.12,35
The main limitations of our study are the small sample size and the low generalizability of certain results, such as the routes of transmission, outside the context of a population lockdown. We were also unable to analyse viral loads and assess their potential impact on the course of disease. Since we collected data on clinical manifestations by interviewing parents and patients versus an examination, there is a risk of bias due to deficiencies in recollecting or identifying clinical manifestations.
In conclusion, we ought to highlight the substantial nonspecificity of the clinical manifestations associated with infection by SARS-CoV-2, the difficulty in detecting specific symptoms in younger children and the low frequency of transmission in the household by children in the context of a lockdown. The observed sensitivity of the RT-PCR test could be associated with a decrease in the viral load after 1 week of infection, which may suggest that children are less contagious after this period.
Conflicts of interestThe authors have no conflicts of interest to declare.
Please cite this article as: Fiel-Ozores A, González-Durán ML, Novoa-Carballal R, Portugués-de la Red MM, Fernández-Pinilla I, Cabrera-Alvargonzález JJ, et al. Clínica diferencial en niños infectados por SARS-CoV-2, trazabilidad de contactos y rentabilidad de pruebas diagnósticas: estudio observacional transversal. An Pediatr (Barc). 2021;94:318–326.