
To establish whether the duodenal mucosa microbiota of children with active coelic disease (CD) and healthy controls (HC) differ in composition and biodiversity.
Material and methodsSamples of duodenal biopsies in 11 CD patients were obtained at diagnosis, and in 6 HC who were investigated for functional intestinal disorders of non-CD origin. Total duodenal microbiota and that belonging to the genus Lactobacillus using PCR-denaturing gradient gel electrophoresis (DGGE) were analyzed. The banding patterns obtained in the resulting gels were analyzed to determine the differences between the microbiota of CD patients and HC (FPQuest 4.5) while environmental indexes (richness, diversity and habitability) were calculated with the past version 2.17 program.
ResultsThe intestinal microbiota of patients with Marsh 3c lesion showed similarity of 98% and differs from other CD patients with other type of histologic lesion as Marsh 3a, Marsh 3b and Marsh 2. The main differences were obtained in ecological indexes belonging to the genus Lactobacillus, with significant richness, diversity and habitability reduction in CD patients. In CD bands were categorized primarily with Streptococcus, Bacteroides and Escherichia coli species. In HC the predominant bands were Bifidobacterium, Lactobacillus and Acinetobacter, though the Streptococcus and Bacteroides were lower.
ConclusionsThe celiac patients with major histological affectation presented a similar microbiota duodenal. The ecological indexes applied to the genus Lactobacillus were significantly reduced in CD.
Comprobar diferencias en la microbiota duodenal al diagnóstico de la EC en relación con grupo control.
Material y MétodosSe obtuvieron muestras de biopsias duodenales en 11 pacientes con EC al diagnostico y en 6 controles. Se analizó la microbiota duodenal total así como la perteneciente al género Lactobacillus mediante la técnica molecular PCR-Electroforesis en gel con gradiente desnaturalizante (DGGE). Los patrones de bandas obtenidos en los geles resultantes fueron analizados para determinar las diferencias presentes entre la microbiota de pacientes con EC y controles (FPQuest 4.5) mientras que los índices ecológicos (riqueza, diversidad y habitabilidad) fueron calculados con el programa Past versión 2.17.
ResultadosLa microbiota intestinal de los individuos con histología Marsh 3c presentó similitud del 98% y fue diferente del resto de pacientes celiacos. Las principales diferencias se obtuvieron en los índices ecológicos pertenecientes al género Lactobacillus, con importante reducción de especies en los celiacos respecto al grupo control (riqueza, diversidad y habitabilidad). En los pacientes con EC las bandas principalmente fueron catalogadas con las especies Streptococcus, Bacteroides y E. coli. En los controles las bandas predominantes fueron Bifidobacterium, Acinetobacter y Lactobacillus, sin embargo los Streptococcus y Bacteroides fueron más bajos.
ConclusionesLos índices ecológicos aplicados al género Lactobacillus fueron significativamente reducidos en los pacientes celíacos. Los casos con mayor afectación histológica presentaron una microbiota duodenal similar.
Coeliac disease (CD) is a chronic inflammatory disorder of the small intestine characterized by a permanent intolerance to dietary gluten occurring in genetically predisposed individuals.1 This disease can occur at any age and with a variety of clinical features, but typical cases often present in early childhood. Patients with CD may be asymptomatic, only with extraintestinal symptoms or silent forms. Currently, CD with a classical gastrointestinal symptoms is diagnosed by demonstrating mucosal villous atrophy, crypt hyperplasia and infiltration of intraepithelial lymphocytes.
CD is a multifactorial disorder that involves interactions between genetic and environmental factors. Environmental factors include early life gluten exposure, short duration of breastfeeding, intestinal infections and changes in microbiota.
Recently, scientific evidence showed changes in the intestinal microbiota composition in these patients.2 So far, differences in the microbiota composition and related metabolites between CD patients and healthy controls (HC) have been reported mainly in feces.3,4 Increased bacterial diversity and changes in several bacterial groups in the duodenal microbiota of pediatric CD patients have also been reported.5–7 However, other studies have failed to show major microbiota differences between CD and HC.8–10 Cheng et al.10 describe a similar microbiota composition in the duodenal mucosa between the CD and healthy children but a sub-population profile comprising eight genus-like bacterial groups was found to differ significantly between the study groups, probably with a specific role in the epithelial disruption in CD.
Changes in the duodenal microbiota have been described in coeliac patients, adults and children, with active disease5,9,11 and when they were also under gluten free diet.12 Wacklin et al.13 found differences in the diversity and composition of the intestinal microbiota in adults with classic intestinal CD symptoms and extraintestinal symptoms; this indicated that the composition of mucosa-associated microbiota in the duodenum of the patients differed depending on the manifestations of CD.
This study was designed to establish whether the duodenal mucosal microbiota of children with active CD and controls differ in composition and biodiversity in order to explain the differences in microbiota of pediatric CD patients and HC.
Material and methodsSubjectsDuodenal biopsies were collected from children newly diagnosed with CD on a normal gluten-containing diet and from HC. The HC group consisted of children who were investigated for functional intestinal disorders of non-CD origin. All HC subjects had both negative celiac serology and showed normal small intestinal mucosa (Marsh 0).14 CD patients had both positive celiac serology markers (anti-tissue transglutaminase antibodies IgA, deamidated gliadin antibodies IgG, and antiendomysium antibodies IgA) and histological lesions in duodenal biopsy.
This study was conducted according to the guidelines established in the Helsinki Declaration according to EEC Good Clinical Practice Guidelines (document 111/3976/88, July 1990), and under the guidelines of current Spanish law which regulates clinical research in humans (Royal Decree 561/1993). The study protocol was approved by the Committee on Ethical Practice from CSIC and the Hospital.
Written informed consent was obtained from the parents of the children included in the study. No case included in the study received antibiotic treatment within 2 months before the completion of the endoscopy. Four duodenal mucosa biopsies were taken from each patient. Two samples from each case were sent for histological examination using the Marsh score and two other samples were immediately frozen at −20°C and kept until processing for bacteriological study. These were collected with 1ml of PBS and centrifuged at 1000×g for 5min.
DNA extractionTotal DNA was extracted from each sample as described by Martínez et al.,15 with some modifications, as reported by Tapia-Paniagua et al.16 Twenty microlitres of DNA were treated with 2μl of sodium acetate 3M and 46μl of isopropanol. Samples were centrifuged 12,000×g for 6min. Pellet was cleaned with ethanol 70% and centrifuged 12,000×g for 6min. Pellet was dried and resuspended in water.
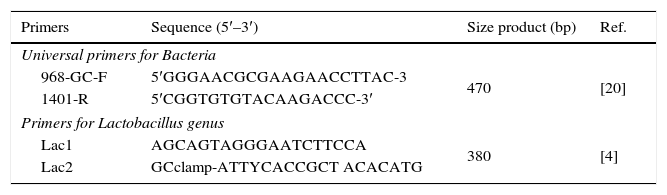
PCR-denaturing gradient gel electrophoresis (DGGE)In order to compare DGGE patterns of the duodenal microbiota, DNA was amplified using the 16S rDNA bacterial domain-specific primers 968-GC-F and 1401-R. These primers were used to amplify V6-V8 regions of 16S rDNA. PCR mixtures and conditions to perform PCR were those previously described.12 Specific amplicons were also used for the genus Lactobacillus (Table 1). PCR mixtures (50μl) contained 1.25U Taq polymerase (Life Technologies Gaithersburg, MD, USA), 20mM Tris–HCl (pH 8.5), 50mM KCl, 3mM MgCl2, 200μM of each deoxynucleoside triphosphate, 5pmol of the primers, 1μl of DNA template, and UV-sterilized water. The PCR was performed in a T1 thermocycler (Whatman Biometra, Göttingen, Germany) using 1 cycle of 94°C for 2min, 35 cycles of 95°C for 30s, 56°C for 40s, and 72°C for 1min, followed by 1 cycle of 72°C for 5min. Aliquots (5μl) were analyzed by electrophoresis on 1.5% (w/v) agarose gels containing ethidium bromide to check for product size and quantity.
The amplicons obtained were separated by DGGE according to the specifications of Muyzer et al.17 using a Dcode TM system (Bio-Rad Laboratories, Hercules, CA). Electrophoresis was performed in 8% polyacrylamide gels (37.5:1 acrylamide–bisacrylamide; dimensions, 200mm×200mm×1mm) using a 30–55% denaturing gradient for separation of PCR products. The gels contained a 30–55% gradient of urea and formamide increasing in the direction of the electrophoresis. A 100% denaturing solution contained 7M urea and 40% (vol/vol) deionized formamide. PCR samples were applied to gels in aliquots of 13μl per lane. The gels were electrophoresed for 16h at 85V in 0.5× TAE (20mM Tris acetate [pH 7.4], 10mM sodium acetate, 0.5mM Na2-EDTA) buffer at a constant temperature of 60°C and subsequently stained with AgNO3.18
Analysis of DGGE patternsA DGGE analysis was performed and the banding patterns were analyzed using FPQuest Software version 4.0 (Applied Maths BVBA, Sint-Martens-Latem, Belgium). A matrix of similarities for the densitometric curves of the band patterns was calculated using the band-based Pearson coefficient, and clustering of DGGE patterns was achieved by construction of dendrograms using the Unweighted Pair Groups Method using Arithmetic Averages (UPGMA). The values of Pearson coefficients obtained for each treatment were compared using multiple range tests for similarity by diet. In order to determine the structural diversity of the microbial community corresponding to the DGGE banding patterns several parameters were calculated: (1) the specific richness (r) was calculated based on the total number of bands; (2) the Shannon index (H′) was calculated following the function: H′=−ΣPilogPi, where Pi is defined as (ni/N), ni is the peak surface of each band, and N is the sum of all the peak surfaces of all bands; (3) range-weighted richness (Rr) calculated as the total number of bands multiplied by the percentage of denaturing gradient needed to describe the total diversity of the sample analyzed, according to the following formula: Rr=(N2×Dg), where N represents the total number of bands in the pattern, and Dg the denaturing gradient comprised between the first and the last band of the pattern.19
Sequencing of DGGE bandsIn order to determine the principal bacteria, predominant bands in the DGGE gels were retrieved for sequencing with sterile pipette tips, placed in 100μl of double distilled water (ddH2O) and incubated at 4°C overnight. Volumes of 5μl were used as template in PCR amplification reaction performed as described above. The product was re-run on DGGE to confirm its position and further subjected to cycle sequencing with primers 968-without the GC clamp (5′-AACGCGAAGAACCTTAC-3′) and 1401-R and (5′-ACG′GCTACCTTGTTACGACTT-3′). The PCR was performed in a T1 thermocycler (Whatman Biometra, Göttingen, Germany) using one cycle of 94°C for 2min, 28 cycles of 95°C for 30s, 56°C for 40s and 72°C for 1min, followed by one cycle of 72°C for 5min. Products were purified using the High Pure Spin Kit PCR purification kit (Roche). The sequencing of the amplicons was performed on the ABI PRISM 377 sequencer (Perkin-Elmer). The sequence was read from both directions with primers RV-M and M13-47, respectively. The resulting sequences (∼500bp) were compared with the sequences from the National Center for Biotechnology Information (NCBI) or Greengenes DNA sequence database using the BLAST21 sequence algorithm. Database sequences showing the highest identity were used to infer identity. Although the high resolution of DGGE does not exclude the possibility that two different 16S rDNA sequences might migrate to exactly the same position, all sequences that migrated to the same position were sequenced. Chimeric sequences were identified by using the CHECK CHIMERA program of the Ribosomal Database Project.22
Principal components analysis (PCA)Principal component analysis (PCA) is a mathematical procedure that uses an orthogonal transformation to convert a set of observations of possibly correlated variables into a set of values of linearly uncorrelated variables. It has been used to summarize RFLP profiles.23 In the present study it has been applied to correlate different such as ecological parameters (H′, R and Rr), histological parameters and the proportion of the DNA of each microbial species detected in the intestinal microbiota assayed with the intestinal microbiota of these patients. PCA has been performed using the LXSTAT 2012 software (Addinsoft, Spain) calculated with the help of the MS excel software XLSTAT 2012.1.01; Addinsoft The influence of the variables in the PCA was determined by the distance of each variable from the center of the axis d ≥√2/n, where n is the number of variables. For determining the quantity of DNA, the intensities obtained from each of the DGGE bands were used.
Statistical analysisThe data expressed as mean and standard deviation were analyzed with SPSS (Statistical Package for Social Science for Windows, version 15.0, SPSS Inc., Chicago, IL, USA). The ecological indices were analyzed with the Kruskal–Wallis test using the Statgraphics Plus 5.0 software (Statgraphics Corporation, Rockville, MD, USA). Differences were considered statistically significant when p≤0.05.
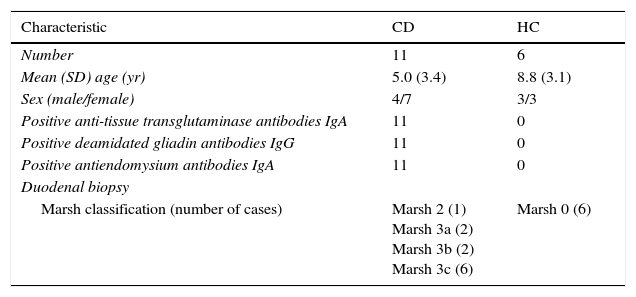
ResultsDuodenal biopsy specimens were collected from 11 children with newly diagnosed CD on a normal gluten-containing diet, and 6 HC (Table 2).
Clinical characteristics of study subjects: untreated coeliac patients and healthy controls.
| Characteristic | CD | HC |
|---|---|---|
| Number | 11 | 6 |
| Mean (SD) age (yr) | 5.0 (3.4) | 8.8 (3.1) |
| Sex (male/female) | 4/7 | 3/3 |
| Positive anti-tissue transglutaminase antibodies IgA | 11 | 0 |
| Positive deamidated gliadin antibodies IgG | 11 | 0 |
| Positive antiendomysium antibodies IgA | 11 | 0 |
| Duodenal biopsy | ||
| Marsh classification (number of cases) | Marsh 2 (1) Marsh 3a (2) Marsh 3b (2) Marsh 3c (6) | Marsh 0 (6) |
Modified Marsh classification of CD: Marsh 0, normal mucosa; Marsh 1, infiltrative lesion: increased numbers of intraepithelial lymphocytes in the villous epithelium in an otherwise normal mucosa with normal villous to crypt ratio; Marsh 2, hyperplasic type: crypt hyperplasia with normal villi showing increased numbers of intraepithelial lymphocytes; Marsh 3, atrophic lesion with crypt hyperplasia and increased numbers of intraepithelial lymphocytes (Marsh 3a: mild villous atrophy; Marsh 3b: marked villous atrophy; Marsh 3c: flat mucosa).14
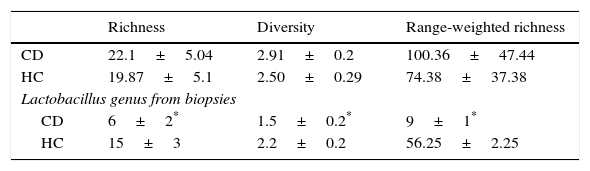
The values of richness, diversity, and range-weighted richness did not show significant differences among HC subjects and CD patients (Table 3), whereas the three values were significantly lower for CD compared to HC when the Lactobacillus genus was analyzed (Table 3).
Richness, diversity and range-weighted values obtained from microbiota of biopsies in CD patients and in healthy controls.
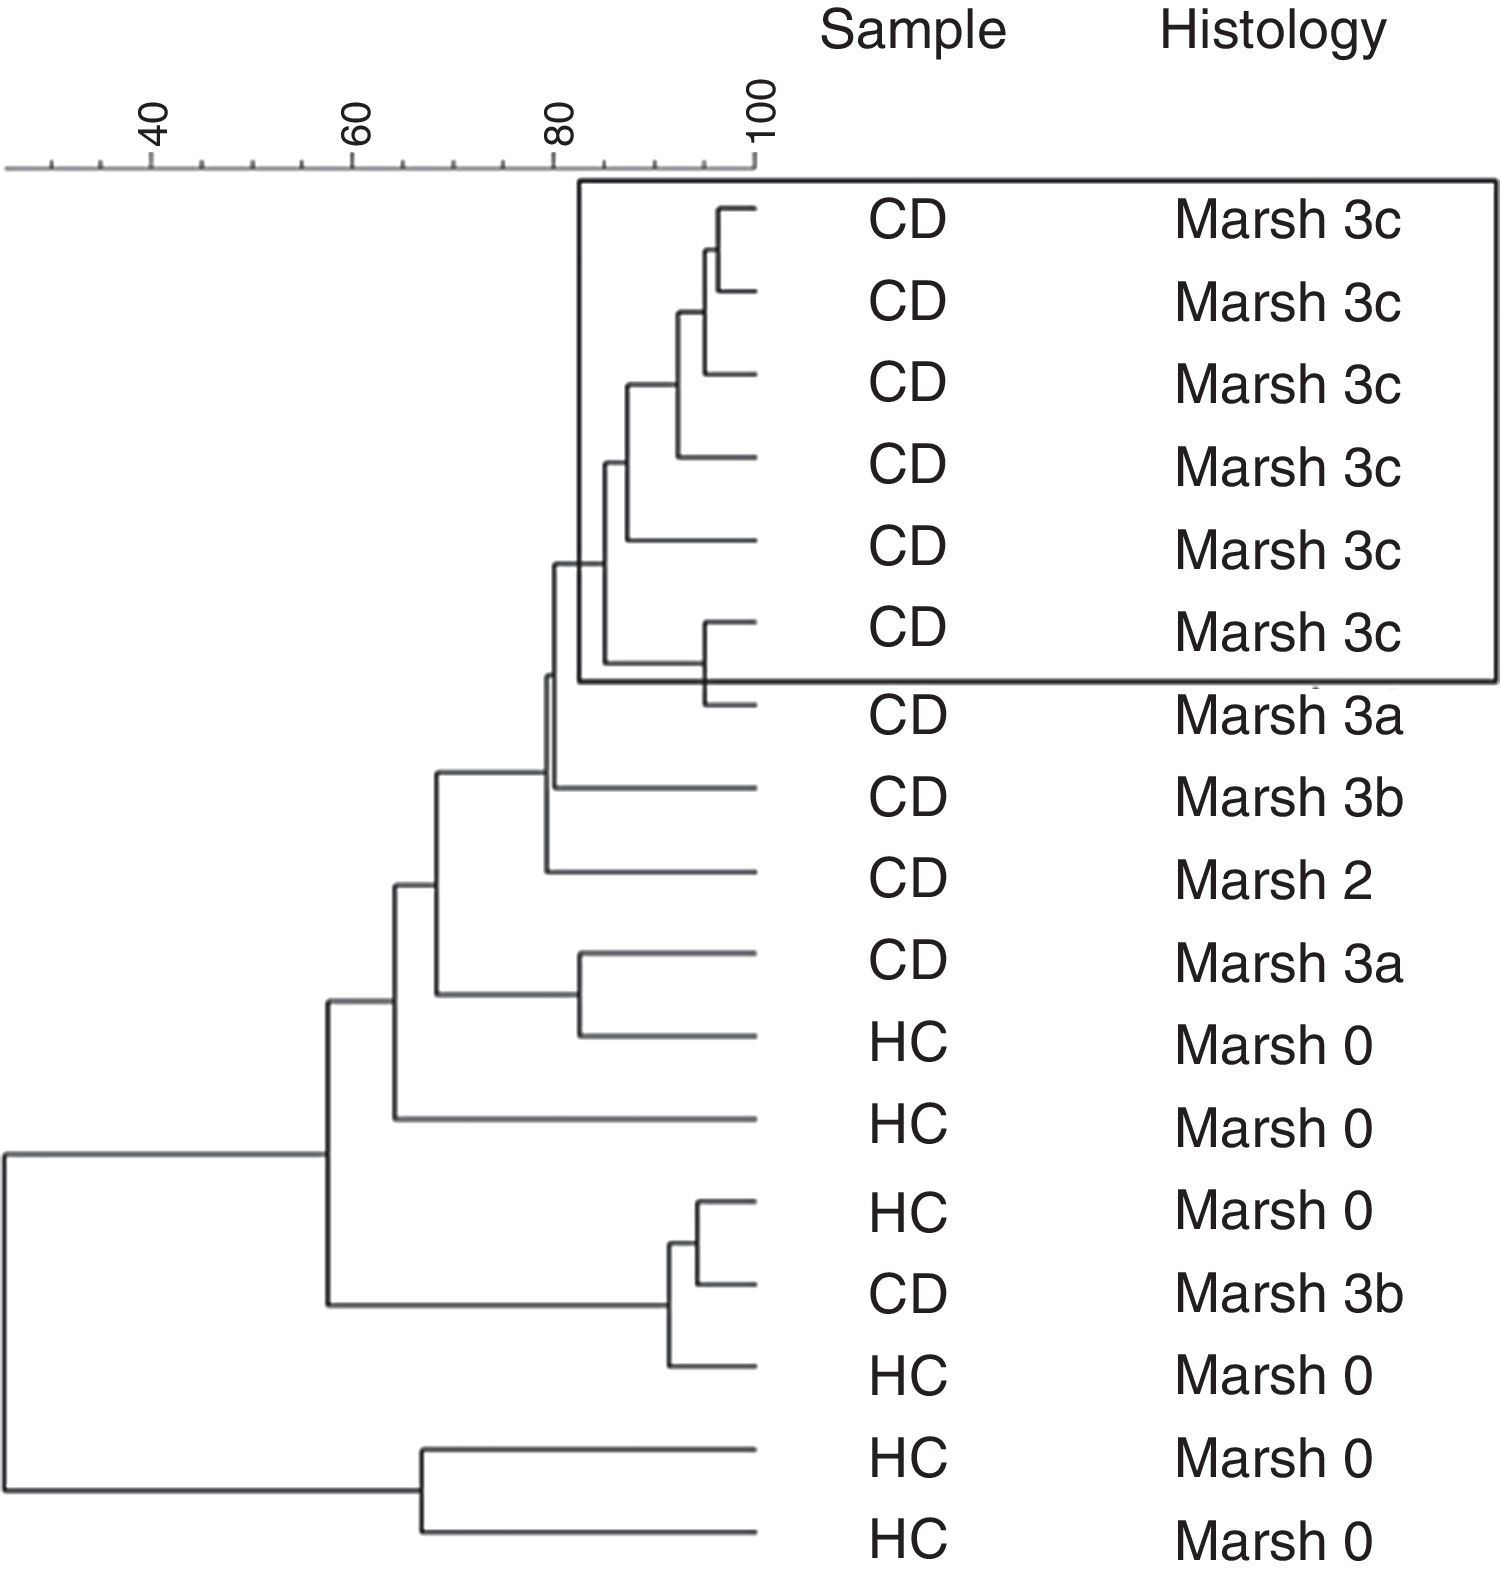
Furthermore, a clustering analysis was applied to the duodenal microbiota DGGE patterns. This resulted in high intragroup similarity percentages (98%) in patients that presented histology associated with Marsh 3c type. The other patients showed a similarity from 80% until 30% and the group was not based on other characteristics (Fig. 1).

A second dendrogram was done only with the amplicons of Lactobacillus genus showing two separate clusters with a 40% of similarity, approximately but the groups were not based on any analyzed characteristic. (Data not shown.)
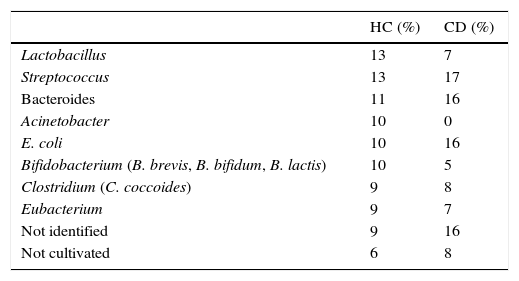
Bands showing higher intensities in DGGE gels of samples of biopsies were sequenced and compared with BLAST references based on the phylogenetic relationship of the ∼500bp partial 16S rDNA sequence (Table 4). The bands were mainly related to species such as Streptococcus, Bacteroides and Escherichia coli in CD patients, while in HC the predominant bands were Bifidobacterium, Acinetobacter, and Lactobacillus. Other groups like Streptococcus (17–13%) or Bacteroides (16–11%) were minor.
Relative abundance of different microbial groups sequenced from the duodenal microbiota in HC and in CD.
| HC (%) | CD (%) | |
|---|---|---|
| Lactobacillus | 13 | 7 |
| Streptococcus | 13 | 17 |
| Bacteroides | 11 | 16 |
| Acinetobacter | 10 | 0 |
| E. coli | 10 | 16 |
| Bifidobacterium (B. brevis, B. bifidum, B. lactis) | 10 | 5 |
| Clostridium (C. coccoides) | 9 | 8 |
| Eubacterium | 9 | 7 |
| Not identified | 9 | 16 |
| Not cultivated | 6 | 8 |
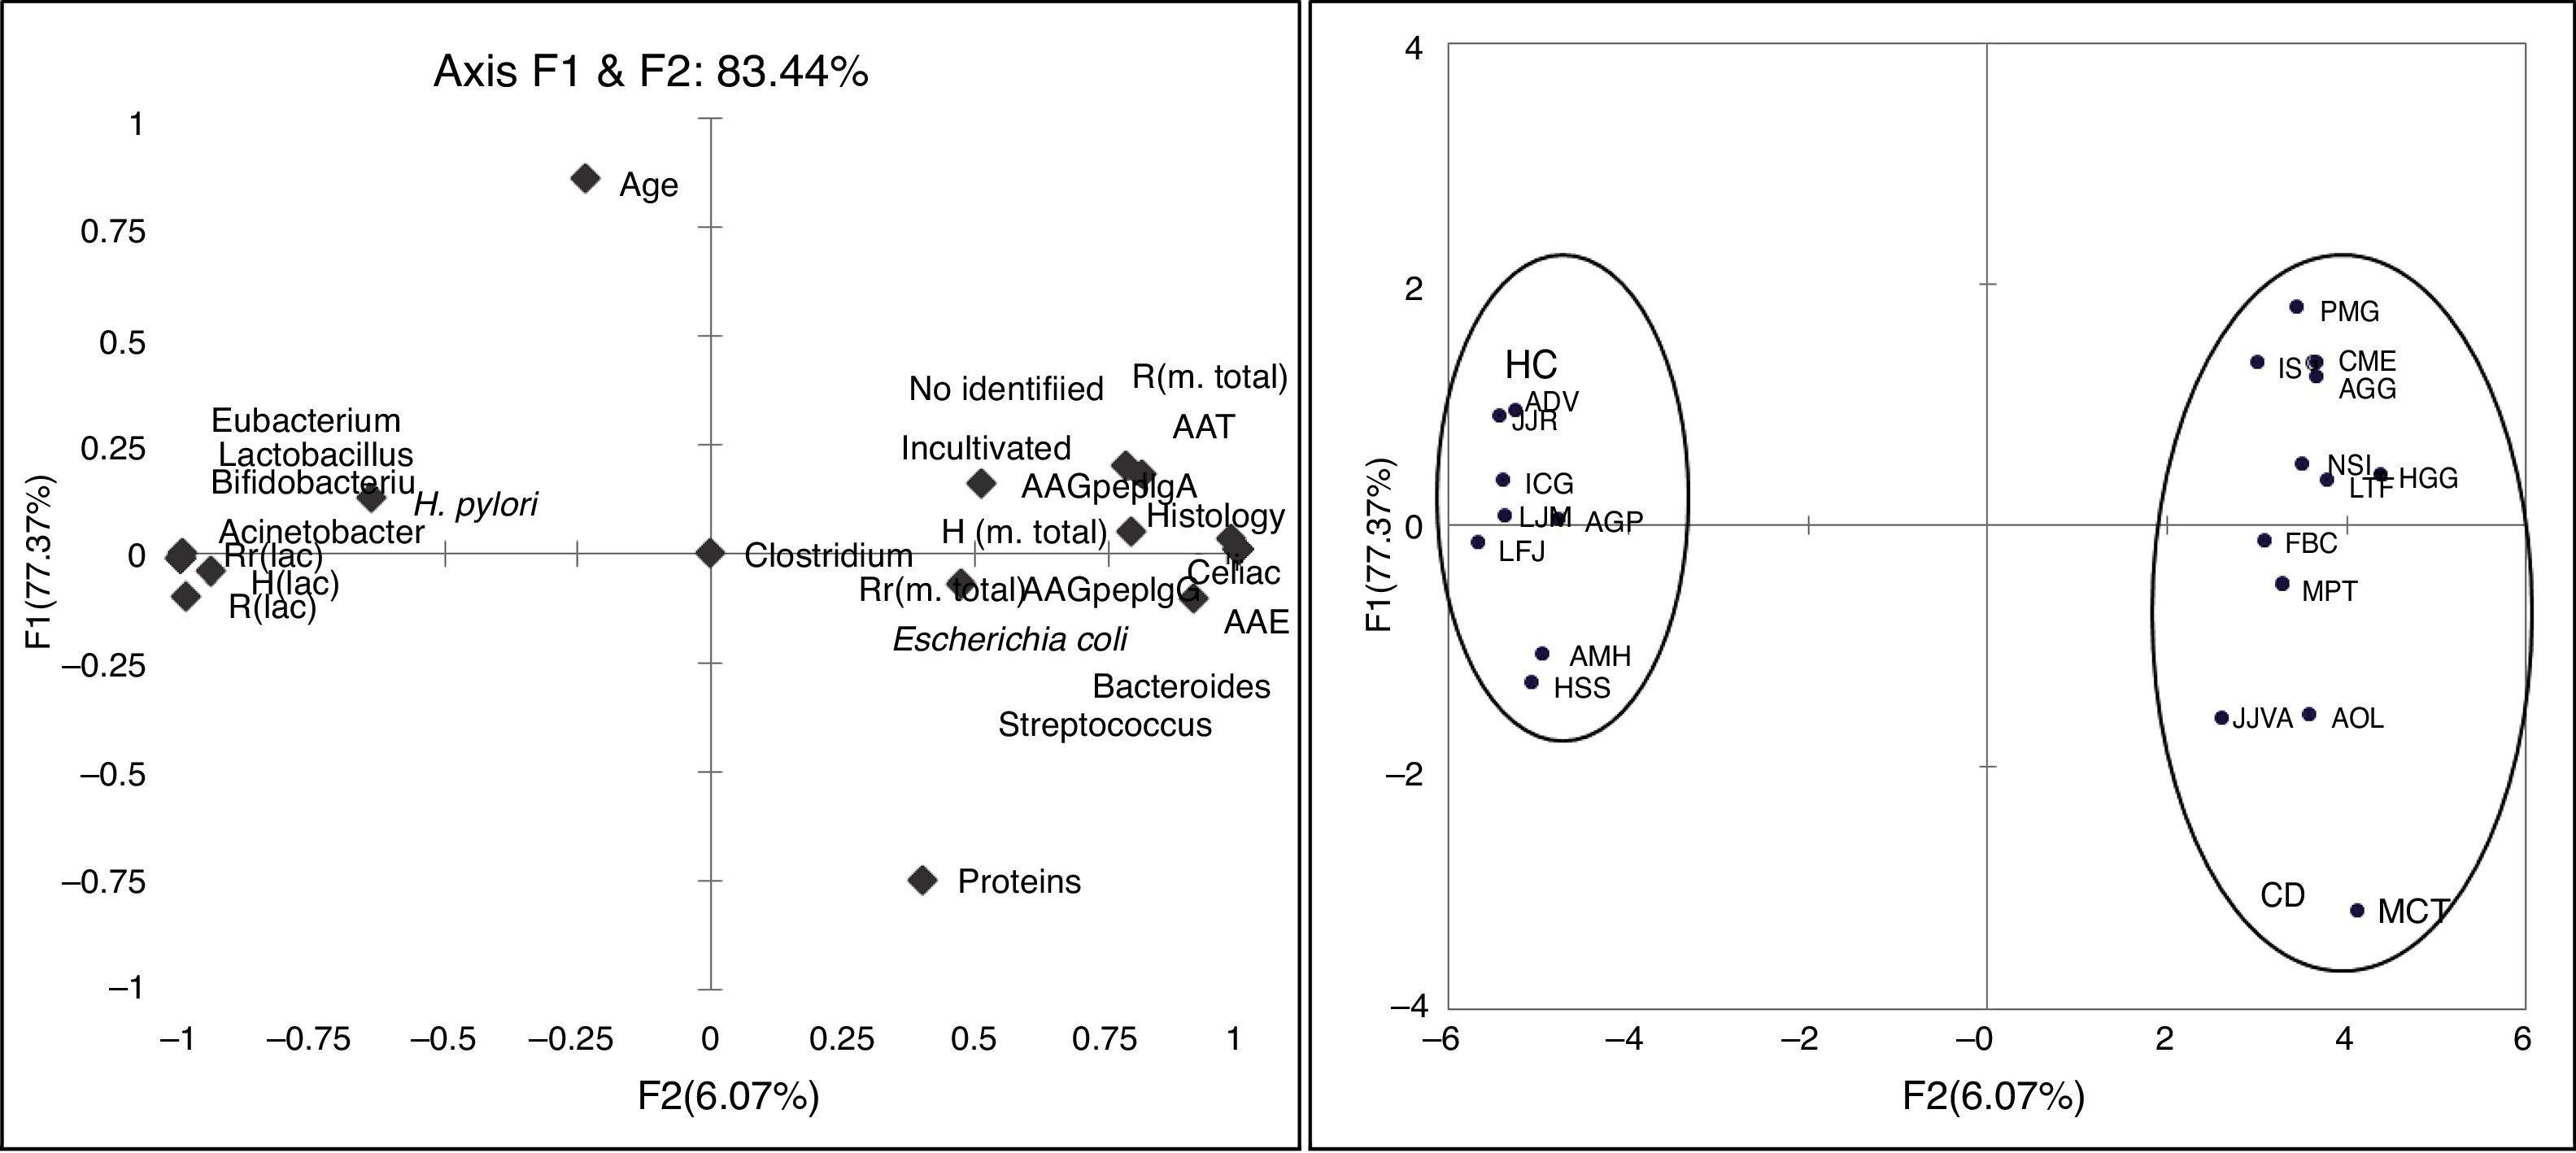
The PCA shows that two factors (F1 and F2) are able to explain 83.44% of the variability found between the microbiota and the other variables studied in patients and controls. It is noteworthy that the variables related to the richness, diversity and habitability of the genus Lactobacillus change from reverse to the other variables used by the F1 addressed. Also the F1 separates both axes, HC from CD patients, so that F1 is a factor related to the presence or absence of disease (Fig. 2).
Discussion. Correlation of assayed variables and principal components explaining 83.44% of variability. Distribution of subjects of CD and HC along axis F1 and F2.")
The structural diversity of the microbial community corresponding to the DGGE banding patterns did not show significant differences between HC and CD. DGGE analysis with universal primers did not show a higher bacterial diversity associated with the small intestinal microbiota of CD but the ecological parameters, (H′, R and Rr), were significantly lower for CD compared to HC when the Lactobacillus genus was analyzed.
Nadal et al.,5 conducted bacteriological analyses of duodenal biopsy specimens based on pediatric patients with CD. Their results showed that patients with active CD had significantly higher numbers of total bacteria, especially Gram-negative bacteria, compared with asymptomatic patients and healthy subjects and the ratio of Lactobacillus-Bifidobacterium to Bacteroides-E. coli was lower in patients with CD. Nistal et al.9 analyzed the bacterial 16S rRNA gene sequencing of DNA extracted from duodenal biopsies and showed that the diversity of duodenal microbiota was significantly different between treated and untreated adults with CD.
In our study the patients with Marsh 3c lesion were clustered separately in PCA of the DGGE profiles. The other patients with Marsh 3a and Marsh 3b and one case of Marsh 2, shared different microbiota as compared with more closely clustered patients with Marsh 3c. This indicated that the composition of duodenal microbiota differed depending on the grade of intestinal damage.
Probably the conditions of the intestinal environment in cases of severe villous atrophy cause a profound change in the microbial community. Some changes in the duodenal microbial composition may be due to the destructive inflammatory consequences pattern, most evident in greater duodenal mucosa villous atrophy. In these cases the intestinal inflammatory effect exerted by the gluten may further activate the intestinal inflammation, a consequence of the destructive pattern of atrophic lesion related to Marsh 3c type. We speculate that the most intense atrophy of the duodenal mucosa in untreated CD, as Marsh 3c, promotes a colonization of mucosal similar between these patients.
More studies are necessary to understand the microbiota–host interaction and unravel the significance of specific microbiota to determine if it is just a consequence of the EC or are involved in the variability and the different degrees of enteropathy of the disease. In this respect it has recently been associated with alterations in intestinal microbiota as the reduction of microbial richness, with persistent symptoms in treated CD.24
We expect further research to find bacteriological markers in the duodenal microbiota of CD for diagnostic and therapeutic reasons.
Conflict of interestThe authors declare no conflict of interest.
Please cite this article as: Girón Fernández-Crehuet F, Tapia-Paniagua S, Morinigo-Gutiérrez MA, Navas-López VM, Serrano MJ, Blasco-Alonso J, et al. La composición de la microbiota duodenal en niños con enfermedad celíaca activa está influenciada por el grado de enteropatía. An Pediatr (Barc). 2016;84:224–230.