


Our aim was to determine which foetal or neonatal growth curves discriminate the probability of dying of newborns with low birth weight for their gestational age (small for gestational age, SGA) and sex (weight < 10th percentile) and to establish the curves that are presumably most useful for monitoring growth through age 10 years.
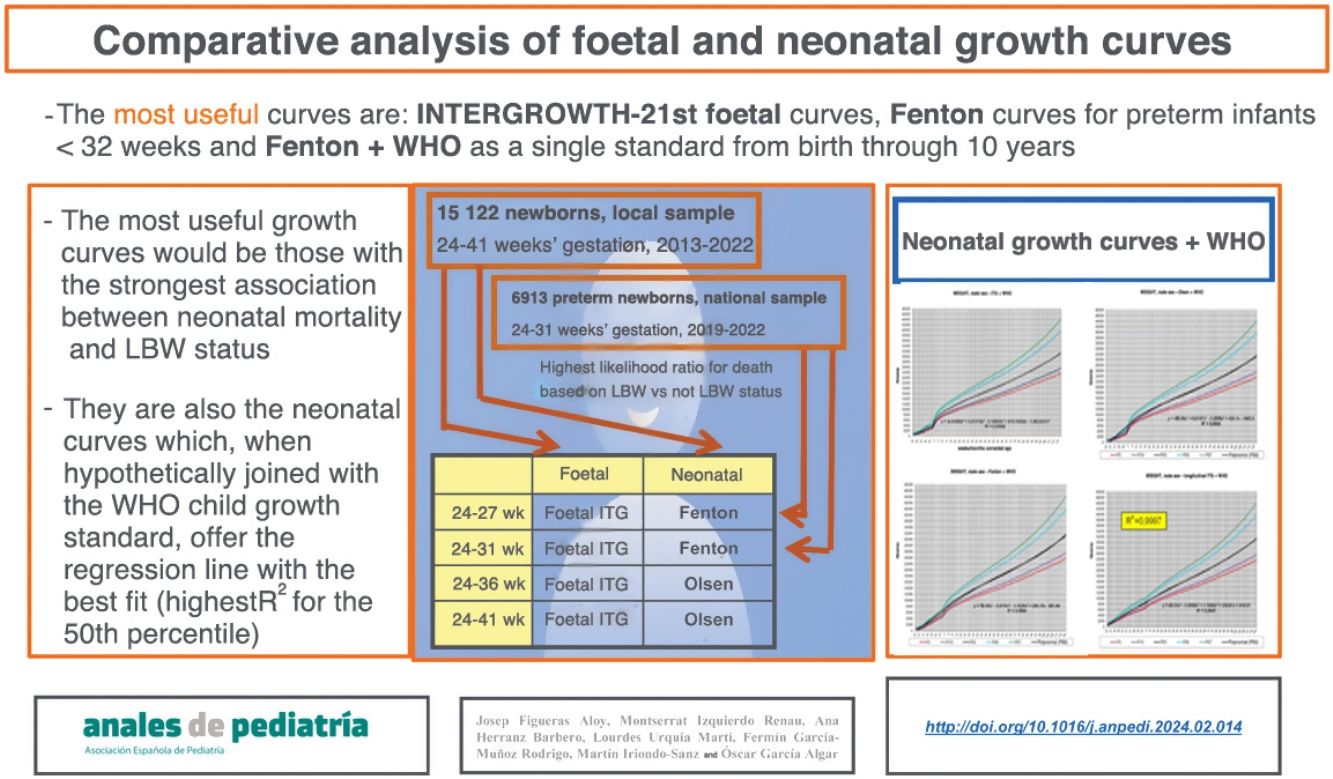
Material and methodsThe analysis included every neonate (15 122) managed in our hospital (2013–2022) and all neonates born preterm before 32 weeks (6913) registered in the SEN1500 database (2019–2022). We considered most useful those curves with the highest likelihood ratio (LR) for dying with or without a history of SGA in each subgroup of gestational ages. Theoretically, the optimal curves for monitoring growth would be those with a higher R2 in the quantile regression formulas for the 50th percentile.
ResultsThe growth curves exhibiting the strongest association between SGA and hospital mortality are the Intergrowth fetal curves and the Fenton neonatal curves in infants born preterm before 32 weeks. However, the optimal curves for premature babies and neonates overall were those of Olsen and Intergrowth. The most useful curves to monitor anthropometric values alone until age 10 years of age are the longitudinal Intergrowth curves followed by the WHO standards, but if a single reference is desired from birth through age 10 years, the best option is the Fenton curves followed by the WHO standards.
ConclusionsThe Intergrowth reference provides the most discriminating foetal growth curves. In neonatal clinical practice, the optimal references are the Fenton followed by the WHO charts.
Se pretende determinar qué curvas de crecimiento fetal o neonatal discriminan la probabilidad de fallecer de los recién nacidos de bajo peso para su edad gestacional (BPEG) y sexo (peso inferior al percentil 10) y conocer las curvas teóricamente más útiles para seguir el crecimiento hasta los 10 años.
Material y métodoSe estudian todos los neonatos (15.122) atendidos en nuestro hospital (2013-2022) y todos los prematuros menores de 32 semanas (6.913) incluidos en la base de datos SEN1500 (2019-2022). Las curvas más útiles serán las que tengan un mayor cociente de probabilidad (LHR=likelihood ratio) de fallecer siendo o no BPEG en cada subgrupo de edades gestacionales. Las curvas más indicadas teóricamente en el seguimiento serán las que tengan una mayor R2 en las fórmulas de regresión de las tendencias del percentil 50.
ResultadosLas curvas de crecimiento que mejor relacionan BPEG con mortalidad hospitalaria son las fetales de Intergrowth y las neonatales de Fenton en los prematuros menores de 32 semanas. Sin embargo, en todos los prematuros y neonatos en su conjunto, son las de Olsen e Intergrowth. Las curvas más útiles para seguir sólo la evolución antropométrica hasta los 10 años son las longitudinales de Intergrowth más OMS, pero si se desea una curva única desde el nacimiento hasta los 10 años son las de Fenton más OMS.
ConclusionesLas curvas de crecimiento fetal más discriminante son las de Intergrowth fetales. En la práctica clínica del neonatólogo, las curvas más indicadas son las de Fenton más OMS.

Multiple curves are available to assess foetal and neonatal growth, and at present, there is no widespread consensus on which should be applied in our region. Low birth weight (LBW) for gestational age or small for gestational age (SGA) are both defined as a birth weight below the 10th percentile for gestational age and sex. Infants are considered to be SGA or constitutionally normal if their birth weights are consistent with the expected optimal birth weight, or to have an abnormal LBW as a result of intrauterine growth restriction (IUGR) due to pathological causes, usually involving the placenta, which prevented the achievement of the expected weight. In clinical practice, there is heterogeneity in the classification of infants with LBW as being SGA or having IUGR.
Obstetricians use foetal growth curves obtained through the serial estimation of foetal weight based on different ultrasound measurements of foetal anatomy (biparietal diameter, abdominal circumference, femur length etc.), differentiating by sex or not, and assuming an accurate gestational age. The most widely used in the general population are the INTERGROWTH-21st foetal growth longitudinal study (ITG-FGLS) curves,1 the World Health Organization foetal growth (WHO-FG) curves2 and, in our region, the Hospital Clínic de Barcelona customised birth weight (HCB-CBW) curves.3,4
The INTERGROWTH-21st project,1 a multicentre population-based study, assessed foetal growth in 4607 women in 8 countries who were healthy, had an adequate nutritional status and received adequate antenatal care. In 4231 cases, the weight was estimated based on the abdominal and health circumferences without using the femur length applying the equation developed by the research group, and the observed values were compared with previously published percentile curves.5 The WHO-FG charts2 are based on a multinational prospective longitudinal observational study of foetal growth in low-risk singleton pregnancies in women of middle to high socioeconomic status without known environmental constraints on foetal growth. The sample included 1387 mothers and 7924 sets of ultrasound measurements. For the HCB-CBW standards,3 foetal growth was estimated using the Hadlock formula6 and weights were customised in a cohort of 13 661 singleton pregnancies without malformations.4
Neonatologists use neonatal growth curves obtained with real-world cross-sectional anthropometric measurements (weight, length, head circumference) taken at birth for the specific gestational age estimated by the obstetrician and the sex of the infant. The most widely used references are the Olsen,7 Fenton8 and INTERGROWTH-21st (ITG)9 curves and, domestically, curves developed using data obtained in the Spanish population.10,11 However, we are not going to discuss the latter further in this article, as they do not include anthropometric measurements for weeks 24 and 25 of gestation.
The Olsen curves7 were developed with data corresponding to 257 855 live singleton births in 33 states in the United States, taking into account the birth weight, length and head circumference, the estimated gestational age, sex and ethnicity. Separate subsamples were used to create and validate smoothed percentile curves. The Fenton growth chart8 was developed through a systematic review of 6 population-based surveys in developed Western countries including the weights recorded in 3 986 456 births. The ITG curves9 were developed through a population-based study that assessed anthropometric measurements of newborns in 8 demarcated urban areas. The sample included 20 486 mothers selected with the same criteria applied in the development of the foetal growth standards.1
The INTERGROWTH-21st project also developed longitudinal postnatal growth reference charts for preterm size infants (ITG-L)12 based on serial weight, length and head circumference measurements adjusted for sex and age from 27 to 64 weeks of postmenstrual age. The exclusion criteria were social or maternal medical risk, illness, complications during pregnancy, intrauterine growth restriction, severe neonatal morbidity, pregnancy achieved through assisted reproductive technology and multiple pregnancy.
The WHO growth reference13 was developed in a multi-country community-based study combining a longitudinal follow-up from birth to 24 months with a cross-sectional survey of children aged 18 to 71 months and subsequently follow-up through age 10 years. The inclusion criteria in the selection of the populations were: socioeconomic conditions favourable to growth, low mobility and at least 20% of mothers practising breastfeeding. The inclusion criteria for individuals were: absence of known environmental constraints for growth, adherence to nutrition recommendations, absence of maternal smoking, singleton term birth and absence of significant morbidity.
It is known that infants with LBW for gestational age and/or IUGR are at increased risk of perinatal, neonatal and postnatal morbidity and mortality.14 However, this classification depends on the curve used in the assessment and, given the methodological differences in the development of each standard, it is possible that the same infant be classified as having a normal weight or LBW depending on which curve is used. It would be reasonable to consider curves that can discriminate foetuses or newborns with poorer outcomes in subsequent development most useful.
Assuming that the most useful curves are those showing the strongest association between hospital neonatal mortality (before discharge home) and the presence of LBW for gestational age, the aim of our study was to determine which foetal and neonatal growth curves were most useful in the assessment of both a local sample from our hospital and of a nationwide sample (SEN1500 database), and to determine whether these same curves were also the most suitable to follow-up postnatal growth through age 10 years.
Material and methodsIn the local and nationwide samples under study, we did not exclude newborns with congenital anomalies or product of multiple pregnancies, and we included all the obtained measurements. We considered that these and other variables, which are potential confounders, would have had a similar effect on all the evaluated curves. The study was approved by the Research Ethics Committee of the hospital of the principal investigator.
The local sample included 15 122 infants (born between 24+° and 41+6 weeks of gestation), corresponding to all the births managed in the hospital between 2013 and 2022. A total of 111 neonates (0.7%) died. To assess the potential effect of gestational age, we divided the sample into the following groups: 282 extremely preterm neonates (born between 24+0 and 27+6 weeks of gestation), of who 70 died (24.8%); 516 very preterm neonates (born between 24+0 and 27+6 weeks of gestation), of who 16 died (3.1%); 2685 moderately and late preterm neonates (born between 32+0 and 36+6 weeks), of who 17 died (0.6%); and 11 639 term neonates (born between 37+0 and 41+6 weeks), of who 8 died (0.1%). We also analysed cumulative sums for gestational age subsets (24–27 weeks, 24–31 weeks, 24–36 weeks and 24–41 weeks), to be used depending on the population under study.
We obtained the national sample from the SEN1500 register database, analysing the 6913 inborn extremely and very preterm neonates (born between 24+0 and 31+6 weeks of gestation) born in the 2019–2022 period, of who 726 died (10.5%). We divided this overall sample into gestational age subsets: 2211 extremely preterm neonates (born between 24+0 and 27+6 weeks of gestation), of who 548 died (24.8%), and 4702 very preterm neonates (born between 24+0 and 27+6 weeks of gestation), of who 178 died (3.8%).
For each analysed neonatal or foetal growth curve, infants were considered LBW infants if the birth weight was below the 10th percentile for age and gestational age. The neonatal references included in the study were the Olsen,7 Fenton8 and ITG9 curves. The foetal references included in the study were the HCB-CBW,3 ITG-FGLS1 and WHO-FG2 curves.
To identify the curves for which the association between LBW and hospital mortality was strongest, we used the positive likelihood ratio (LR+), obtained by dividing the probability of death in LBW infants by the probability of death in infants with birth weights that were not low for gestational age. This ratio is always expected to be greater than 1. We calculated the LR+ for each sample subset and each of the curves, and considered the curves with higher LR+ more useful. For instance, a LR+ of 2.5 for one subset using a given curve indicates that the mortality in LBW infants will be 2.5 times greater compared to non-LBW infants. If the application of a different curve in the same subset of infants yields a LR+ of 1.5, then the first curve offers a greater discriminating power for the probability of death in LBW infants.
To determine whether the aforementioned curves were also the most suitable to assess growth through age 10 years, we made a theoretical calculation using the online data corresponding to each of the tables for each of the sexes. In an Excel worksheet, we entered the neonatal growth tables, in which the rows corresponded to the weeks of gestation, and added more rows including the data for each month in the WHO growth standards, aiming for an adequate fit in the intersection between the last weeks and the first months. In this article, we show as an example the different 50th percentile weight gain curves in boys fitted with 4th order polynomial regression and the corresponding regression equations and R2 values. Curves with higher R2 values are more suitable. The rest of the curves can be found in the figures of Supplementary material.
ResultsTable 1 and Fig. 1 summarise the evidence on the probability of death based on the detection of LBW in each analysed foetal growth curve and in the different gestational age groups in the local sample. We ought to highlight that in practically every cumulative sum of the different gestational age subsets, the foetal growth reference with the highest LR+ values corresponded to the ITG curves, followed by the HCB curves, while the WHO curves had the lowest LR+ values, especially for the entire gestational age range (24 to 41 weeks).
Foetal growth curves. Probability of death based on LBW status (local sample).
| Local samplen = 15 122 | HCB-CBWLBW = 1718 (11.4%)Not LBW = 13 404 (88.6%) | ITG-FGLSLBW = 1775 (11.7%)Not LBW = 13 347 (88.3%) | WHO-FGLBW = 3739 (24.7%)Not LBW = 11 383 (75.3%) | |
|---|---|---|---|---|
| 24+0–27+6 wk | LBW death | 24/64 (37.5%) | 33/87 (37.9%) | 35/95 (36.8%) |
| n = 282 | Not LBW death | 46/218 (21.1%) | 37/195 (19%) | 35/187 (18.7%) |
| dec = 70 (24.8%) | LR+ | 1.817 (1.185–2.788) | 1.851 (1.319–2.596) | 1.767 (1.286–2.427) |
| 28+0–31+6 wk | LBW death | 12/162 (7.4%) | 12/161 (7.5%) | 13/250 (5.2%) |
| n = 516 | Not LBW death | 4/354 (1.1%) | 4/355 (1.1%) | 3/266 (1.1%) |
| dec = 16 (3.1%) | LR+ | 2.500 (1.828–3.419) | 2.517 (1.840–3.443) | 1.754 (1.331–2.207) |
| 32+0–36+6 wk | LBW death | 5/551 (0.9%) | 5/546 (0.9%) | 8/1020 (0.8% |
| n = 2685 | Not LBW death | 12/2134 (0.6%) | 12/2139 (0.6%) | 9/1665 (0.6%) |
| dec = 17 (0.6%) | LR+ | 1.437 (0.686–3.013) | 1.450 (0.692–3.041) | 1.241 (0.748–2.059) |
| 37+0–41+6 wk | LBW death | 1/941 (0.1%) | 1/981 (0.1%) | 2/2374 (0.1%) |
| n = 11639 | Not LBW death | 7/10698 (0.1%) | 7/10658 (0.1%) | 6/9265 (0.1%) |
| dec = 8 (0.1%) | LR+ | 1.547 (0.247–9.684) | 1.484 (0.237–9.289) | 1.226 (0.369–4.073) |
| Cumulative results | ||||
| 24+0–27+6 wk | LBW death | 24/64 (37.5%) | 33/87 (37.9%) | 35/95 (36.8%) |
| n = 282 | Not LBW death | 46/218 (21.1%) | 37/195 (19%) | 35/187 (18.7%) |
| dec = 70 (24.8%) | LR+ | 1.817 (1.185–2.788) | 1.851 (1.319–2.596) | 1.767 (1.286–2.427) |
| 24+0–31+6 wk | LBW death | 36/226 (15.9%) | 45/248 (18.1%) | 48/345 (13.9%) |
| n = 798 | Not LBW death | 53/572 (9.2%) | 44/550 (8%) | 41/453 (9%) |
| dec = 89 (11.2%) | LR+ | 1.569 (1.189–2.070) | 1.835 (1.454–2.316) | 1.338 (1.088–1.645) |
| 24+0–36+6 wk | LBW death | 41/777 (5.3%) | 50/794 (6.3%) | 56/1365 (4.1%) |
| n = 3483 | Not LBW death | 62/2706 (2.3%) | 53/2689 (2%) | 47/2118 (2.2%) |
| dec = 103 (3.0%) | LR+ | 1.828 (1.429–2.338) | 2.205 (1.790–2.717) | 1.404 (1.170–1.684) |
| 24+0–41+6 wk | LBW death | 42/1718 (2.4%) | 55/1775 (3.1%) | 58/3739 (1.6%) |
| n = 15 122 | Not LBW death | 68/13 404 (0.5%) | 56/13 347 (0.4%) | 53/11 383 (0.5%) |
| dec = 111 (0.7%) | LR+ | 3.389 (2.659–4.320) | 4.001 (3.254–4.919) | 2.131 (1.780–2.551) |
dec, deceased; LBW, low birth weight below 10th percentile for sex and gestational age; LR+, positive likelihood ratio with its 95% confidence interval; wk, weeks.
Values in boldface correspond to the highest LR+ with a 95% confidence interval bounds greater than 1.

Table 2 and Fig. 1 summarise the data on the probability of death in relation to LBW status in each neonatal growth curve and for the different gestational age subset in the local sample. The Fenton curves achieved the highest LR+ values for extremely and very preterm infants and for term infants, while the Olsen curves were most useful for moderately or late preterm infants. However, in the previously defined cumulative gestational age groups, the Fenton curves proved most useful for infants born between 24 and 31 weeks, while the Olsen curves were most useful for infants born between 24 and 41 weeks. The ITG curves yielded intermediate LR+ values.
Neonatal growth curves. Probability of death based on LBW status (local sample).
| Local samplen = 15 122 | OlsenLBW = 2132 (14.1%)Not LBW = 12 990 (85.9%) | FentonLBW = 2814 (18.6%)Not LBW = 12 308 (81.4%) | ITGLBW = 1727 (11.4%)Not LBW = 13 395 (88.6%) | |
|---|---|---|---|---|
| 24+0–27+6 wk | LBW death | 24/64 (22.7%) | 21/43 (48.8%) | 17/ 36 (47.2%) |
| n = 282 | No- LBW death | 46/218 (21.1%) | 49/239 (20.5%) | 53/246 (21.5%) |
| dec = 70 (24.8%) | LR+ | 1.817 (1.185–2.788) | 2.891 (1.696–4.928) | 2.710 (1.493–4.918) |
| 28+0–31+6 wk | LBW death | 9/105 (8.6%) | 9/83 (10.8%) | 9/88 (10.2%) |
| n = 516 | Not LBW death | 7/411 (1.7%) | 7/433 (1.6%) | 7/428 (1.6%) |
| dec = 16 (3.1%) | LR+ | 2.930 (1.835–4.678) | 3.801 (2.350–6.146) | 3.560 (2.209–5.737) |
| 32+0–36+6 wk | LBW death | 5/476 (1.1%) | 5/562 (0.9%) | 4/409 (1.0%) |
| n = 2685 | Not LBW death | 12/2209 (0.5%) | 12/2123 (0.6%) | 13/2276 (0.6%) |
| dec = 17 (0.6%) | LR+ | 1.666 (0.794–3.495) | 1.409 (0.672–2.953) | 1.550 (0.655–3.669) |
| 37+0–41+6 wk | LBW death | 1/1487 (0.1%) | 2/2126 (0.1%) | 1/1194 (0.1%) |
| n = 11 639 | Not LBW death | 7/10 152 (0.1%) | 6/9513 (0.1%) | 7/10 445 (0.1%) |
| dec = 8 (0.1%) | LR+ | 0.978 (0.156–6.124) | 1.369 (0.412–4.549) | 1.219 (0.195–7.629) |
| Cumulative sums | ||||
| 24+0–27+6 wk | LBW death | 24/64 (22.7%) | 21/43 (48.8%) | 17/36 (47.2%) |
| n = 282 | Not LBW death | 46/218 (21.1%) | 49/239 (20.5%) | 53/246 (21.5%) |
| dec = 70 (24.8%) | LR+ | 1.817 (1.185–2.788) | 2.891 (1.696–4.928) | 2.710 (1.493–4.918) |
| 24+0–31+6 wk | LBW death | 33/169 (19.5%) | 30/126 (23.8%) | 26/124 (21%) |
| n = 798 | Not LBW death | 56/629 (8.9%) | 59/672 (8.8%) | 63/674 (9.3%) |
| dec = 89 (11.2%) | LR+ | 2.009 (1.477–2.732) | 2.587 (1.835–3.648) | 2.196 (1.517–3.180) |
| 24+0–36+6 wk | LBW death | 38/645 (5.9%) | 35/688 (5.1%) | 30/533 (5.6) |
| n = 3483 | Not LBW death | 65/2838 (2.3%) | 68/2795 (2.4%) | 73/2950 (2.5%) |
| dec = 103 (3.0%) | LR+ | 2.054 (1.580–2.671) | 1.759 (1.332–2.322) | 1.957 (1.433–2.673) |
| 24+0–41+6 wk | LBW death | 39/2132 (1.8%) | 37/2814 (1.3%) | 31/1727 (1.8%) |
| n = 15 122 | Not LBW death | 72/12 990 (0.6%) | 74/12 308 (0.6%) | 80/13 395 (0.6%) |
| dec = 111 (0.7%) | LR+ | 2.520 (1.951–3.255) | 1.802 (1.382–2.349) | 2.472 (1.827–3.344) |
dec, deceased; LBW, low birth weight below 10th percentile for sex and gestational age; LR+, positive likelihood ratio with its 95% confidence interval; wk, weeks.
Values in boldface correspond to the highest LR+ with a 95% confidence interval bounds greater than 1.
Tables 3 and 4 summarise the data on the probability of death in relation to LBW status in each neonatal or foetal growth curve and for the different gestational age subset in the nationwide SEN1500 sample of preterm infants in Spain. The findings were consistent with those obtained in the local sample for preterm infants born between 24 and 31 weeks: the most suitable foetal growth curve was the ITG-FGLS and the most suitable neonatal growth curve for these gestational age group was the Fenton curve.
Foetal growth curves. Probability of death based on LBW status (nationwide preterm infant sample).
| SEN1500n = 6913 | HCB-CBWLBW = 1852 (26.8%)Not LBW = 5061 (73.2%) | ITG-FGLSLBW = 1942 (28.1%)Not LBW = 4971 (71.9%) | WHO-FGLBW = 2734 (39.5%)Not LBW = 4179 (60.5%) | |
|---|---|---|---|---|
| 24+0–27+6 wk | LBW death | 166/474 (35.0%) | 223/627 (35.6%) | 214/665 (32.2%) |
| n = 2211 | Not LBW death | 380/1737 (22%) | 323/1584 (20.4%) | 332/1546 (21.5%) |
| dec = 546 (24.8%) | LR+ | 1.636 (1.391–1.923) | 1.675 (1.468–1.911) | 1.440 (1.263–1.641) |
| 28+0–31+6 wk | LBW death | 91/1378 (6.6%) | 88/1315 (6.7%) | 107/2069 (5.2%) |
| n = 4702 | Not LBW death | 87/3324 (2.6%) | 90/3387 (2.7%) | 71/2633 (2.7%) |
| dec = 178 (3.8%) | LR+ | 1.797 (1.545–2.090) | 1.823 (1.559–2.131) | 1.386 (1.224–1.569) |
| Cumulative results | ||||
| 24+0–27+6 wk | LBW death | 166/474 (35.0%) | 223/627 (35.6%) | 214/665 (32.2%) |
| n = 2211 | Not LBW death | 380/1737 (22%) | 323/1584 (20.4%) | 332/1546 (21.5%) |
| dec = 546 (24.8%) | LR+ | 1.636 (1.391–1.923) | 1.675 (1.468–1.911) | 1.440 (1.263–1.641) |
| 24+0–31+6 wk | LBW death | 257/1852 (13.9%) | 311/1942 (16.0%) | 321/2734 (11.7%) |
| n = 6913 | Not LBW death | 469/5061 (9.3%) | 415/4971 (8.3%) | 405/4179 (9.7%) |
| dec = 726 (10.5%) | LR+ | 1.373 (1.234–1.528) | 1.625 (1.480–1.785) | 1.134 (1.039–1.237) |
dec, deceased; LBW, low birth weight below 10th percentile for sex and gestational age; LR+, positive likelihood ratio with its 95% confidence interval; wk, weeks.
Values in boldface correspond to the highest LR+ with a 95% confidence interval bounds greater than 1.
Neonatal growth curves. Probability of death based on LBW status (nationwide preterm infant sample).
| SEN1500n = 6913 | OlsenLBW = 1280 (18.5%)Not LBW = 5633 (81.5%) | FentonLBW = 844 (12.2%)Not LBW = 6069 (87.8%) | ITGLBW = 854 (12.4%)Not LBW = 6059 (87.6%) | |
|---|---|---|---|---|
| 24+0–27+6 wk | LBW death | 161/453 (35.5%) | 120/263 (45.6%) | 85/206 (41.3%) |
| n = 2211 | Not LBW death | 387/1758 (22.0%) | 428/1948 (22.0%) | 463/2005 (23.1%) |
| dec = 548 (24.8%) | LR+ | 1.673 (1.417–1.976) | 2.547 (2.038–3.182) | 2.132 (1.644–2.765) |
| 28+0–31+6 wk | LBW death | 64/827 (7.7%) | 51/581 (8.8%) | 57/648 (8.8%) |
| n = 4702 | Not LBW death | 114/3875 (2.9%) | 127/4121 (3.1%) | 121/4054 (3.0%) |
| dec = 178 (3.8%) | LR+ | 2.132 (1.734–2.621) | 2.446 (1.914–3.125) | 2.451 (1.954–3.075) |
| Cumulative results | ||||
| 24+0–27+6 wk | LBW death | 161/453 (35.5%) | 120/263 (45.6%) | 85/206 (41.3%) |
| n = 2211 | Not LBW death | 387/1758 (22.0%) | 428/1948 (22.0%) | 463/2005 (23.1%) |
| dec = 548 (24.8%) | LR+ | 1.673 (1.417–1.976) | 2.547 (2.038–3.182) | 2.132 (1.644–2.765) |
| 24+0–31+6 wk | LBW death | 225/1280 (17.6%) | 171/844 (20.3%) | 106/854 (12.4%) |
| n = 6913 | Not LBW death | 501/5633 (8.9%) | 555/6069 (9.1%) | 584/6059 (9.6%) |
| dec = 726 (10.5%) | LR+ | 1.817 (1.609–2.053) | 2.165 (1.865–2.514) | 1.700 (1.444–2.000) |
dec, deceased; LBW, low birth weight below 10th percentile for sex and gestational age; LR+, positive likelihood ratio with its 95% confidence interval; wk, weeks.
Values in boldface correspond to the highest LR+ with a 95% confidence interval bounds greater than 1.
Fig. 2 presents the combined ITG + WHO, Olsen + WHO, Fenton + WHO and ITG-L + WHO weight gain curves for males. Even at a glance it is clear that the combinations with the best fit at the intersection are the ITG-L + WHO and the Fenton + WHO combinations. This can be demonstrated with the 4th order polynomial regression curves for the 50th percentile, the regression equation and the R2 (R2 = 0.9997 for ITG-L + WHO). Additional figures presenting the linear and head circumference growth in male subjects can be found in Supplementary material. In male subjects, the smoothed 50th percentile curves with the highest R2 values for weight gain, linear growth and head circumference growth were those for the ITG-L + WHO combination, followed by the Fenton + WHO combination. The corresponding curves for female subjects can be found in the figures of Supplementary material, and the results of the analysis were similar to the results in male subjects.
 and WHO child growth standards, including the regression equation for the 50th percentile curve.")
Supplementary material presents the regression equations for the Fenton + WHO curve combination for weight, length/height and head circumference from 23 weeks of postmenstrual age through 10 years of age in boys and girls. The Figures in Supplementary material were obtained with these equations.
DiscussionAt present, multiple growth curves are available to track foetal and neonatal growth developed with cross-sectional as well as longitudinal data. Each neonatal unit must choose those that seem most suitable for the infants managed in the setting to assess anthropometry at birth and postnatal growth.
Each foetal or neonatal growth curve has been developed applying different methodologies and inclusion criteria,1–3,7–9 which makes their comparison difficult. In the work presented here, the criterion we applied to determine which references were most useful among those analysed was the prediction of the probability of death in LBW infants in a large local sample as well as a national sample. Mortality is an objective outcome and it is well known that LBW infants are at increased risk of dying.14 The group of LBW infants includes SGA infants and infants with a history of IUGR, whose prognosis is less favourable, however, this potential confounder was present in the same proportion in the evaluation of each of the curves.
In our study, the curves that proved most useful were the ITG-FGLS curves, for both the local and the nationwide samples, while the WHO-FG curves exhibited the lowest discriminating value in the prediction of mortality in LBW infants. The gold standard for comparison of foetal growth curves should be the performance in the prediction of adverse perinatal events. Accordingly, in 2021 Mendoza-Carrera et al.14 evaluated the last recorded foetal weight estimated with the Hadlock formula6 using different charts. The authors found that a weight below the 10th percentile was associated with an increased risk of composite adverse perinatal outcome. The association was strongest using the HCB-CBW (relative risk [RR], 1.69) and ITG-FGLS (RR, 1.59) curves. In our study, in which the sole adverse perinatal outcome under consideration was neonatal death, the result was the same, albeit with the order inverted: the highest predictive value corresponded to the ITG-FGLS curves (LR+, 3.864) followed by the HCB-CBW curves (LR+, 2.986).
Based on our results, in the group of preterm infants born between 24 and 31 week of gestation, the neonatal curves that are best at predicting death in LBW infants are the Fenton curves, which was the case for both the local and the nationwide samples, but when considering all neonates born between 24 and 41 weeks of gestation, the greatest discriminating power corresponded to the Olsen curves. In Spain, new growth curves for extremely preterm newborns15 and data on their postnatal growth through discharge16 have been published recently. Gonzalez Gonzalez et al.17 have proposed a model for the calculation of the optimal foetal and neonatal weight and the automatic calculation of the corresponding percentiles, and the resulting classification exhibited substantial agreement with existing Spanish references.
In real-world practice, it would be useful for neonatologists to have curves that can be applied from birth through the end of the postnatal follow-up, that is, from week 23 of gestation to at least age 6 years. Such a reference should be composed of neonatal growth curves as well as child growth curves, in which case the WHO growth standards13 are the best option currently available for worldwide application. Our findings suggest that the Fenton neonatal curves are most useful to predict the risk of death in LBW infants (except in moderate and late preterm infants) and then could be combined with the WHO child growth standards to obtain the Fenton + WHO curves. However, if what is needed are curves to monitor growth over time, especially in preterm infants, the most useful combination is the ITG-L + WHO curves, which had the highest R2 values in the regression equations of the 50th percentiles (Fig. 2 and Supplementary material). Villar et al.12 already showed that the ITG-L and WHO curves had a good fit at their intersection, that is, at the end of the ITG-L curves (64 weeks) and the beginning of the WHO curves (6th month), in all 50th, 10th and 90th percentiles, so they could be joined. The regression equations for the ITG-L + WHO combined curves have been published by Figueras-Aloy et al.18 González García et al.19 published a study similar to our own in 2022 that sought to determine which neonatal reference was preferable for very low birth weight infants, the Fenton or the INTERGROWTH-21st curves, but based on their performance in predicting anthropometric outcomes at age 2 years (WHO). The weight z score at discharge was useful to predict the risk of low stature, undernutrition and a head circumference z score of less than 2 at age 2 years, without significant differences between the Fenton and the INTERGROWTH-21st curves.
The main strengths of the study were: (1) the use of an objective outcome to compare the performance of the curves, the mortality in LBW infants; (2) the analysis of 2 samples which were both large, the local sample (15 122 neonates) and the national sample (6913 preterm neonates born before 32 weeks); (3) finding consistent results in preterm infants born before 32 weeks’ gestation in both the local and national samples, which strongly supports the appropriateness of the methodological approach and the reliability of the obtained results; (4) providing evidence of the growth curve combinations that are most useful for anthropometric assessment at birth and through age 10 years; (5) the inclusion in the appendices of the Fenton + WHO curves.
Among the weaknesses of the study, we ought to highlight: (1) the discriminating power for the probability of death was only assessed using the weight; (2) in the comparative study of the association of the neonatal growth curves and the WHO child growth standards, we only took into account the 50th percentile; (3) it is not possible to assert that certain curves are superior to others, even if the LR+ is greater, as there is overlap between their 95% confidence intervals, as would be expected.
ConclusionThe growth curves that exhibited the greatest discriminating power regarding the risk of mortality in LBW infants were the ITG-FGLS foetal growth curves, the Fenton neonatal curves in infants born preterm before 32 weeks’ gestation and the Olsen curves in preterm infants born before 37 weeks and in neonates overall. The most useful curves for the assessment of postnatal growth through age 10 years were the ITG + WHO curves, but if a single reference is desired from birth through age 10 years, the best option is the Fenton curves followed by the WHO standards.
FundingThis research did not receive any external funding.
Conflicts of interestThe authors have no conflicts of interest to declare.
We thank the Sociedad Española de Neonatología for granting us access to the SEN1500 database.
The following are Supplementary data to this article:
